HAL Id: hal-00299266
https://hal.archives-ouvertes.fr/hal-00299266
Submitted on 19 Sep 2005
HAL is a multi-disciplinary open access
archive for the deposit and dissemination of
sci-entific research documents, whether they are
pub-lished or not. The documents may come from
teaching and research institutions in France or
abroad, or from public or private research centers.
L’archive ouverte pluridisciplinaire HAL, est
destinée au dépôt et à la diffusion de documents
scientifiques de niveau recherche, publiés ou non,
émanant des établissements d’enseignement et de
recherche français ou étrangers, des laboratoires
publics ou privés.
Principal component analysis and singular spectrum
analysis of ULF geomagnetic data associated with
earthquakes
A. Serita, K. Hattori, C. Yoshino, M. Hayakawa, N. Isezaki
To cite this version:
A. Serita, K. Hattori, C. Yoshino, M. Hayakawa, N. Isezaki. Principal component analysis and singular
spectrum analysis of ULF geomagnetic data associated with earthquakes. Natural Hazards and Earth
System Science, Copernicus Publications on behalf of the European Geosciences Union, 2005, 5 (5),
pp.685-689. �hal-00299266�
SRef-ID: 1684-9981/nhess/2005-5-685 European Geosciences Union
© 2005 Author(s). This work is licensed under a Creative Commons License.
and Earth
System Sciences
Principal component analysis and singular spectrum analysis of
ULF geomagnetic data associated with earthquakes
A. Serita1,∗, K. Hattori2, C. Yoshino2, M. Hayakawa3, and N. Isezaki4
1Graduate School of Science and Technology, Chiba University, Inage, Chiba 263-8522, Japan 2Marine Biosystems Research Center, Chiba University, Inage, Chiba 263-8522, Japan 3The University of Electro-Communications, Chofu, Tokyo 182-8585, Japan
4Department of Earth Science, Faculty of Science, Chiba University, Inage, Chiba 263-8522, Japan
∗
now at: Japan Defense Agency, Japan
Received: 7 July 2005 – Revised: 15 August 2005 – Accepted: 15 August 2005 – Published: 19 September 2005 Part of Special Issue “Seismic hazard evaluation, precursory phenomena and seismo electromagnetics”
Abstract. In order to extract any ULF signature associated
with earthquakes, the principal component analysis (PCA) and singular spectral analysis (SSA) have been performed to investigate the possibility of discrimination of signals from different sources (geomagnetic variation, artificial noise, and the other sources (earthquake-related ULF emissions)). We adopt PCA to the time series data observed at closely sep-arated stations, Seikoshi (SKS), Mochikoshi (MCK), and Kamo (KAM). In order to remove the most intense signal like the first principal component, we make the differential data sets of filtered 0.01Hz SKS-KAM and MCK-KAM in NS component and 0.01 Hz band. The major findings are as follows. (1) It is important to apply principal component analysis and singular spectral analysis simultaneously. SSA gives the structure of signals and the number of sensors for PCA is estimated. This makes the results convincing. (2) There is a significant advantage using PCA with differential data sets of filtered (0.01 Hz band) SKS-KAM and MCK-KAM in NS component for removing the most intense sig-nal like global variation (solar-terrestrial interaction). This provides that the anomalous changes in the second princi-pal component appeared more sharply. And the contribution of the second principal component is 20–40%. It is large enough to prove mathematical accuracy of the signal. Fur-ther application is required to accumulate events. These facts demonstrate the possibility of monitoring the crustal activity by using the PCA and SSA.
1 Introduction
Many studies on electromagnetic phenomena associated with earthquakes have been reported (e.g. Hayakawa and
Fuji-Correspondence to: K. Hattori
nawa, 1994; Hayakawa, 1999; Hayakawa and Molcahnov, 2002; Hattori, 2004). One of the important problems is the investigation of the relationship between ULF (Ultra Low Frequency) geomagnetic anomalous changes and earthquake activity (Fraser-Smith, 1990; Bernardi, 1991; Hattori, 2004). In comparison with other higher frequency ranges, ULF has the advantage to propagate in the crust due to the skin depth. Therefore, we investigate the anomalous ULF geomagnetic changes associated with 2000 Izu Islands Earthquake Swarm by using principal component analysis.
Miyake-jima Island is a basaltic volcano, about 150 km south of Tokyo, Japan. On 26 June 2000, a seismic swarm beneath the summit suddenly occurred. Then, a migration of magma and a small-scale sea floor eruption started. Earth-quake epicenters migrated from the island westward and then northward. During this period 4 large (>M6.0) earthquakes, 7/1:M6.4, 7/8:M6.1, 7/15:M6.3, 8/18:M6.0 occurred within 100 km from Mochikoshi station, Izu as shown in Fig. 1. They occurred in shallow depth 15 km, 13 km, 5 km, and 11 km, respectively. On the other hand, a phreatic explosion and the formation of the initial sink at the summit of the vol-cano occurred on 9 July. 18 August 2000 largest eruption fol-lowed by low temperature ash flow on 29 August occurred.
We measured three components of the ULF geomagnetic field and two horizontal geoelectrical potential differences at Izu Peninsula, Japan (Hattori et al., 2004b). The measure-ment equipmeasure-ment is constituted by an array with intersensor distance of 5 km as shown Fig. 1. We recorded the signals at stations, Mochikoshi (MCK), Seikoshi (SKS), and Kamo (KAM). Observed ULF geomagnetic fields are considered a superposition of solar origin signal, artificial noise, and other noises that propagate in the crust. The signal associated with crustal activity is very week and sophisticated signal clas-sification methods are required. In this paper, we applied principle component analysis (PCA) and singular spectral
686 K. Hattori et al.: PCA and SSA of ULF geomagnetic data associated with earthquakes
Fig. 1. The map of ULF geomagnetic station (array station) and
seismic activity of 2000 Izu Islands Earthquake.
analysis (SSA) method to the observed data in order to dis-criminate signals associated with the crustal activity from of other sources (geomagnetic variation, artificial noise, and so on).
2 Principal component analysis (PCA) of ULF geomag-netic data
We apply PCA to the time series data observed at closely separated stations. The analyzed period is from February 2000 to December 2000. In this paper, we show the re-sults of 0.01 Hz band with 12.5 Hz sampling rate. Let us indicate the time series of data (30 min) observed at each station by X(n)= [xn(t1), xn(t2), . . . xn(tN)], where n is an
index denoting the site and N is the number of the data (12.5×30×60=225 000). The data matrix X= [x1x2x3]T is
obtained, where T means transpose, and then the covariance matrix R=N1(XX)T is calculated. The eigenvalue decompo-sition of R=V λVT has been performed. The variations of eigenvaluses and eigenvectors are investigated.
In addition, we perform the PCA with differential data at Izu Peninsula applying the methods to SKS-KAM and MCK-KAM data as X(1) and X(2) in order to remove the coherent influence in the region of the array.
3 Singular spectral analysis (SSA) of ULF geomagnetic data
In order to estimate the number of signals observed at each station, singular spectral analysis (SSA) (Golyandina et al., 2001, 2004) has been applied to the time series of data at 0.01 Hz. SSA is sometimes called caterpillar method. The mathematical basis is very similar to PCA. The procedure is as follows. Let’s consider one dimensional time series data
Izu 2000 0.01Hz 30min night
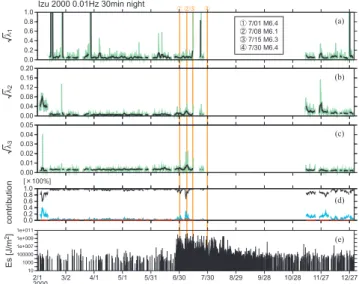
10 1000 100000 1e+007 1e+009 1e+011 Es [J/m 2] 0.0 0.2 0.4 0.6 0.8 1.0 contribution [100%] 2/1 3/2 4/1 5/1 5/31 6/30 7/30 8/29 9/28 10/28 11/27 12/27 0.0 0.2 0.4 0.6 0.8 1.0 λ1 л 0.00 0.04 0.08 0.12 0.16 0.20 λ2 л 0.00 0.01 0.02 0.03 0.04 0.05 λ3 л 2000 Ԙ 7/01 M6.4 ԙ 7/08 M6.1 Ԛ 7/15 M6.3 ԛ 7/30 M6.4 Ԙ ԙԚ ԛ (a) (b) (c) (d) (e)
Fig. 2. The results of PCA using the three-station data. (a) The
variation of eigenvalue of the first principal component. (b) The variation of eigenvalue of the second principal component. (c) The variation of eigenvalue of the third principal component. (d) Con-tribution rate of principal components. Black, blue and red lines correspond to the first, second and the third principal component,
respectively. (e) Es index (E/r2)which indicates the seismic
ergy felt at the observation site (MCK), where E and r are the en-ergy of earthquake and hypocentral distance during 30 min.
{xi}Ni=1. The multidimensional matrix X is obtained as using
the evolvement of the 1-D time series,
X = (xij)k,Mi,j =1= x1 x2 x3 · · · xM x2 x3 x4 · · ·xM+1 .. . ... ... . .. ... xk xk+1xk+2· · · xN .
Here M is caterpillar length with M<N/2 and
k=N −M+1. Then the matrix X is normalized. The element (i, j ) component of normalized matrix X∗is given by
xij∗ = (xij− ¯xj) sj , where ¯xj=1k k P i=1 xi+j −1and sj= s 1 k k P i=1 (xi+j −1− ¯xj)2.
Then, the covariance matrix of R=N1(X ∗ X∗)T and the singular value decomposition of R=V λVT are computed. The procedure is very similar to that of PCA except the di-mension of the matrix. In this paper the variations of ac-cumulated contribution of singular values have been investi-gated for the number of signals detected by the station. In this analysis, M=1800 and N =3750 (12.5 Hz×5 min×60 s).
(a) 0.01Hz night 0.0 0.2 0.4 0 50 100 150 A p [Date] 4/1 4/5 4/9 4/13 4/17 4/21 4/25 4/29 2000 λ 1 (b) 0.00 0.02 0.04 0.06 0.08 0.10 [Date] 4/1 4/5 4/9 4/13 4/17 4/21 4/25 4/29 2000 Weekdays 0.0 0.1 0.2 hour [UT] 0 2 4 6 8 10 12 14 16 18 20 22 24 Sundays 0.0 0.1 0.2 hour [UT] 0 2 4 6 8 10 12 14 16 18 20 22 24 0.01Hz whole day λ 2 λ2 λ 2 (c) Fig.3c
Fig. 3. The detailed results of PCA the three-station data. (a) The
variation of the first principal component√λ1in the night time with
that of Apindex in April 2000. (b) The variation of second principal
component in all day data√λ2in April 2000, the diurnal variation
of√λ2in week days, and the diurnal variation of
√
λ2in holidays.
(c) The variation of the third principal component√λ3in the
inter-val of June–July 2000, the variation of contribution rate of the third
principal component, and Esindex (E/r2)which indicates the
seis-mic energy felt at the observation site (MCK), where E and r are the energy of earthquake and hypocentral distance during 30 min.
4 Results of PCA and SSA
4.1 PCA results of three station data
In this study the results of differential PCA and SSA will be shown, the results of normal PCA have been already re-ported (Hattori et al., 2004a). However, we will mention them briefly. Figures 2 and 3 indicate that (1) the variation of the first eigenvalue is similar to that of Apindex. The
corre-sponding eigenvector is found to be stable. This suggests that the dominant origin of the first principle component may be
sks-kam_kam-mck 2000 0.01Hz 30min night
0 20 40 60 80 100 120 140 Ap 10 1000 100000 1e+007 1e+009 1e+011 Es [J/m 2] 0.0 0.2 0.4 0.6 0.8 1.0 contribution [100%] 0.00 0.05 0.10 0.15 0.20 λ1 л 0.000 0.005 0.010 0.015 0.020 λ2 л 2/1 3/2 4/1 5/1 5/31 6/30 7/30 8/29 9/28 10/28 11/27 12/27 2000 Ԙ 7/01 M6.4 ԙ 7/08 M6.1 Ԛ 7/15 M6.3 ԛ 7/30 M6.4 Ԙ ԙԚ ԛ (a) (b) (c) (d) (e)
Fig. 4. The results of PCA with differential data. (a) The variation
of eigenvalue of the first principal component. (b) The variation of eigenvalue of the second principal component. (c) The variation of contribution rates. Black and blue indicate first and second
princi-pal component, respectively. (d) The variation of Apindex. (e) Es
index (E/r2)which indicates the seismic energy felt at the
obser-vation site (MCK), where E and r are the energy of earthquake and hypocentral distance during 30 min.
solar-terrestrial interaction. (2) The variation of the second eigenvalue seems to be related to that of electricity consump-tion power around staconsump-tions. (3) The variaconsump-tion of the third eigenvalue shows the peak values before a few days before the earthquakes with M greater than 6, which are marked by vertical lines. The variation of the third principal component in June–July 2000 shows that there is also local maximum about two weeks before the swarm activity. However, some-one may comment on (1) a small contribution of the third principal component, and (2) uncertainness of the number of signals observed at each station.
4.2 PCA results of differential station data
In order to remove the most intense noise source denoted by the first principal component in the three-station data analy-sis, we referred the SKS and MCK signals to KAM station, that is, we analyzed data sets of SKS-KAM and MCK-KAM in NS component. On the other hand, the signal associated with earthquakes has a small velocity and there is an arrival time difference among three station with 12.5 Hz sampling rate (Ismaguilov et al., 2003). Results of differential PCA are shown in Figs. 4 and 5. The behavior of the first and second principal component in Fig. 4 resembles to that of the second and third component using three station data in Fig. 2, respectively. The daily variation of the first princi-pal component is plotted in Fig. 5a and compared the pre-vious results in Fig. 3b. The tendency is very similar. The daily variation of the second principal component and con-tribution in the interval of June–July is plotted in Fig. 5b.
688 K. Hattori et al.: PCA and SSA of ULF geomagnetic data associated with earthquakes
(a)
Fig.5a
(b)
Fig.5b
Fig. 5. The results of PCA with differential data. (a) The variation
of first principal component in all day data√λ1in April, the
diur-nal variation of√λ1in week days, and the diurnal variation of in
holidays. (b) The variation of the third principal component√λ2
in the interval of June–July 2000, the variation of contribution rate of the third principal component, and the seismic activity around
the station. Es index (E/r2)which indicates the seismic energy
felt at the observation site (MCK), where E and r are the energy of earthquake and hypocentral distance during 30 min.
The results show the contribution is rather significant and the variation is very close to that of the previous third component as shown in Fig. 3c. These results suggest the differential PCA is very effective to remove the global variation due to the solar-terrestrial interaction and enhances the remaining signals including earthquake-related one.
4.3 SSA results of each station data
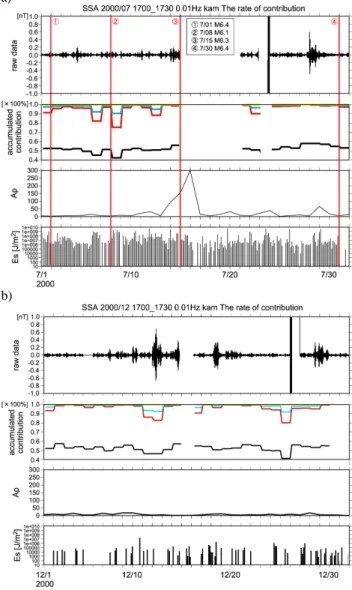
Figure 6 shows the results of SSA around 0.01 Hz band in the nighttime (17:00–17:30 UT (02:00–02:30 JST)) data ob-served at Kamo (KAM) station. Figures 6a and 6b show the result of SSA in July 2000 and that in December 2000, respectively. Top panel indicates the input data for SSA. (0.01 Hz band signal) and the upper middle shows the accu-mulated contribution. Black line indicates the contribution of the first principal component. Red, blue and yellow line in-dicate accumulated contribution to the second, the third and the fourth principal component. The lower middle is seismic activity around the Izu array station and the bottom is the variation of geomagnetic activity Ap. The signals at 0.01 Hz
(a)
Fig.6a
(b)
Fig.6b
Fig. 6. The results of SSA at Kamo station in July 2000 (a) and
in December 2000 (b). The variation of Apindex and Es index
(E/r2)which indicates the seismic energy felt at the observation
site (MCK) are also shown, where E and r are the energy of earth-quake and hypocentral distance during 5 min. The hatched areas indicate the day of earthquake with M>6.0.
band observed at Kamo consist of at most four components. Usually, they consist of at most three components.
Similar results have been obtained at the other two sta-tions, Seikoshi (SKS) and Mochikoshi (MCK). There seems no apparent relation with both the seismic and the geomag-netic activity. Therefore, the structure of the observed signal at three stations is very similar and generally less than three signal sources should be considered. It means that the PCA by using three station data observed at Izu peninsula in the frequency range of 0.01 Hz is valid even four-station data analysis is desirable.
5 Concluding remarks
The results show that the proposed principal component anal-ysis method with the use of closely distributed multiple ge-omagnetic station data is able to detect weak earthquake-related ULF geomagnetic changes or to enhance the pecu-liar characteristics of earthquake-related signals in a certain hypocentral distance. The results of Izu array, demonstrate the possibility of monitoring the crustal activity. The major findings are as follows. (1) It is important to apply principal component analysis and singular spectral analysis simultane-ously. SSA gives the structure of signals and the number of sensors for PCA is estimated. This makes the results con-vincing. (2) There is a significant advantage using PCA with differential data sets of filtered (0.01 Hz band) SKS-KAM and MCK-KAM in NS component for removing the most intense signal like global variation (solar-terrestrial interac-tion). This provides that the anomalous changes in the sec-ond principal component are appeared more sharply. And the contribution of the second principal component is 20–40%. It is large enough to prove mathematical accuracy of the sig-nal. Further application is required to accumulate events.
Acknowledgements. The authors are grateful to M. Taguri of
Chiba University for useful discussion. They also wish to express thanks to Japan Meteorological Agency, for providing earthquake catalogue. This work was partially supported by the JSPS Grants-in-Aid for Scientific Research #13650477.
Edited by: P. F. Biagi
Reviewied by: L. Telesca and another referee
References
Bernardi, A., Fraser-Smith, A. C., McGill, P. R., and Villard, O. G.: ULF magnetic field measurements near the epicenter of the Ms 7.1 Loma Prieta earthquake, Phys. Earth Planet. Inter., 68, 45–63, 1991.
Fraser-Smith, A. C., Bernardi,A., McGill,P. R., Ladd, M. E., Helli-well, R. A., and Villard, O. G.: Low-frequency magnetic field measurements near the epicenter of the Ms 7.1 Loma Prieta earthquakes, Geophys. Res. Lett., 17, 1465–1468, 1990. Golyandina, N., Nekrutkin, V., and Solntsev, V.: Caterpillar-SSA
Technique for Analysis of Time Series in Economics, http://vega. math.spbu.ru/caterpillar/, 2004.
Golyandina, N., Nekrutkin, V. and Zhigljavsky, A.: Analysis of Time Series Structure, Chapman and HALL/CRC, pp. 305, 2001. Hattori, K.: ULF geomagnetic changes associated with large
earth-quakes, Terrestrial, Atmos. Ocean. Sci., 15, 329–360, 2004. Hattori, K., Serita, A., Gotoh, K., Yoshino, C., Harada, M., Isezaki,
N., Hayakawa, M.: ULF geomagnetic anomaly associated with 2000 Izu islands earthquake swarm, Japan, Phys. Chem. Earth., 29, 425–436, 2004a.
Hattori, K., Takahashi, I., Yoshino, C., Isezaki, N., Iwasaki, H., Harada, M., Kawabata, K., Kopytenko, E., Kopytenko, Y., Malt-sev, P., Korepanov, V., Molchanov, O., Hayakawa, M., Noda, Y., Nagao, T., and Uyeda, S.: ULF geomagnetic field measure-ments in Japan and some recent results associated with Iwateken Nairiku Hokubu earthquake in 1998, Phys. Chem. Earth, 29, 481–494, 2004b.
Hayakawa, M. and Fujinawa, Y. (Eds.): Electromagnetic Phenom-ena Related to Earthquake Prediction, Terra Scientific Publishing Company (TERRAPUB), Tokyo, pp. 677, 1994.
Hayakawa, M. (Ed.): Atomospheric and Ionospheric Electromag-netic Phenomena Associated with Earthquakes, TERRAPUB, Tokyo, pp. 996, 1999.
Hayakawa, M. and Molchanov, O.: Seismo Electromagnetics
Lithosphere-Atomosphere-Ionosphere Coupling, TERRAPUB, Tokyo, pp. 477, 2002.
Ismaguilov, V., Kopytenko, Y., Hattori, K., and Hayakawa, M.: Variations of phase velocity and gradient values of ULF geomag-netic disturbances connected with the Izu strong earthquake, Nat. Hazards Earth Syst. Sci., 3, 211–215, 2003,