HAL Id: hal-00303215
https://hal.archives-ouvertes.fr/hal-00303215
Submitted on 17 Dec 2007HAL is a multi-disciplinary open access
archive for the deposit and dissemination of sci-entific research documents, whether they are pub-lished or not. The documents may come from teaching and research institutions in France or abroad, or from public or private research centers.
L’archive ouverte pluridisciplinaire HAL, est destinée au dépôt et à la diffusion de documents scientifiques de niveau recherche, publiés ou non, émanant des établissements d’enseignement et de recherche français ou étrangers, des laboratoires publics ou privés.
Organic composition of carbonaceous aerosols in an aged
prescribed fire plume
B. Yan, M. Zheng, Y. T. Hu, S. Lee, H. K. Kim, A. G. Russell
To cite this version:
B. Yan, M. Zheng, Y. T. Hu, S. Lee, H. K. Kim, et al.. Organic composition of carbonaceous aerosols in an aged prescribed fire plume. Atmospheric Chemistry and Physics Discussions, European Geosciences Union, 2007, 7 (6), pp.18015-18042. �hal-00303215�
ACPD
7, 18015–18042, 2007Carbonaceous aerosols in an aged prescribed fire plume
B. Yan et al. Title Page Abstract Introduction Conclusions References Tables Figures ◭ ◮ ◭ ◮ Back Close
Full Screen / Esc
Printer-friendly Version
Interactive Discussion
EGU
Atmos. Chem. Phys. Discuss., 7, 18015–18042, 2007 www.atmos-chem-phys-discuss.net/7/18015/2007/ © Author(s) 2007. This work is licensed
under a Creative Commons License.
Atmospheric Chemistry and Physics Discussions
Organic composition of carbonaceous
aerosols in an aged prescribed fire plume
B. Yan1, M. Zheng1, Y. T. Hu2, S. Lee1, H. K. Kim2, and A. G. Russell2
1
School of Earth and Atmospheric Sciences, Georgia Institute of Technology, Atlanta, GA, USA
2
School of Civil and Environmental Engineering, Georgia Institute of Technology, Atlanta, GA, USA
Received: 13 November 2007 – Accepted: 24 November 2007 – Published: 17 December 2007
ACPD
7, 18015–18042, 2007Carbonaceous aerosols in an aged prescribed fire plume
B. Yan et al. Title Page Abstract Introduction Conclusions References Tables Figures ◭ ◮ ◭ ◮ Back Close
Full Screen / Esc
Printer-friendly Version
Interactive Discussion
EGU Abstract
Aged smoke from a prescribed fire (dominated by conifers) impacted Atlanta, GA on 28 February 2007 and dramatically increased hourly ambient concentrations of PM2.5
and organic carbon (OC) up to 140 and 72 µg m−3, respectively. It was estimated that
over 1 million residents were exposed to the smoky air lasting from the late afternoon
5
to midnight. To better understand the processes impacting the aging of fire plumes, a detailed chemical speciation of carbonaceous aerosols was conducted by gas chro-matography/mass spectrometry (GC/MS) analysis. Ambient concentrations of many organic species (levoglucosan, resin acids, retene, n-alkanes, n-alkanoic acids) asso-ciated with wood burning emission were significantly elevated on the event day.
Lev-10
oglucosan increased by a factor of 10, while hopanes, steranes, cholesterol and major polycyclic aromatic hydrocarbons (PAHs) did not show obvious increases. Strong odd over even carbon number predominance was found for n-alkanes versus even over odd predominance for n-alkanoic acids. Alteration of resin acids during transport from burning sites to monitors is suggested by the observations. Our study also suggests
15
that large quantities of biogenic volatile organic compounds (VOCs) and semivolatile organic compounds (SVOCs) were released both as products of combustion and un-burned vegetation heated by the fire. Higher leaf temperature can stimulate biogenic VOC and SVOC emissions, which enhanced formation of secondary organic aerosols (SOA) in the atmosphere. This is supported by elevated ambient concentrations of
20
secondary organic tracers (dicarboxylic acids, 2-methyltetrols, pinonic acid and pinic acid). An approximate source profile was built for the aged fire plume to help better understand evolution of wood smoke emission and can be used for source apportion-ment.
ACPD
7, 18015–18042, 2007Carbonaceous aerosols in an aged prescribed fire plume
B. Yan et al. Title Page Abstract Introduction Conclusions References Tables Figures ◭ ◮ ◭ ◮ Back Close
Full Screen / Esc
Printer-friendly Version
Interactive Discussion
EGU
1 Introduction
Wildland fire (wild fire and prescribed burning) is estimated to contribute about 20% of total fine particulate matter (PM2.5) emissions in the United States (EPA, 2000). In
2006, a total of 96 385 wildland fires were reported to burn 39 958 square kilometers, 125% above the 10-year average (NIFC, 2007). Among these forests, 11 010 square
5
kilometers were treated with prescribed fires, which is 1 659 square kilometers above last year’s total and is the second highest since 1998 (NIFC, 2007). Such large and increasing emission contributions are of concern to air quality managers, particularly in areas near or above the applicable air quality standards. For example, the prescribed fires on 28 February 2007 in Georgia and later the Georgia-Florida wildfires lasting
10
from April through May severely impacted Atlanta, Georgia with thick wood smoke (Hu et al., 20071; Lee et al., 2007). During such events, hourly concentrations of PM2.5
increased by over 100 µg m−3.
Previous studies have shown that the major component of PM2.5from forest burning
events is organic carbon (OC), accounting for 30–70% of PM2.5mass (Nopmongcol et
15
al., 2007; Robinson et al., 2004; Ward et al., 2006). However, detailed data speciating OC in PM2.5 impacted by wildland fires is sparse, and even less data is available for
aged plumes. During the 28 February 2007 event, OC reached 72 µg m−3at 06:00 p.m. and contributed approximately 51% of the ambient PM2.5 in Atlanta, GA (Lee et al., 2007). This smoke event provides an opportunity to characterize OC in such
carbona-20
ceous aerosols, further understand processes impacting the aging of fire plumes, and estimate the composition of prescribed fire-derived PM2.5 for source apportionment studies.
Numerous organic compounds have been identified and quantified from
ambi-1
Hu, Y. T., Odman, M. T., Chang, M. E., Jackson, W., Lee, S., Edgerton, E. S., Baumann, K., and Russell, A. G.: Simulation of Air Quality Impacts from Prescribed Fire on an Urban Area: Analysis of the 28 February 2007, Environ. Sci. Technol., in review, 2007.
ACPD
7, 18015–18042, 2007Carbonaceous aerosols in an aged prescribed fire plume
B. Yan et al. Title Page Abstract Introduction Conclusions References Tables Figures ◭ ◮ ◭ ◮ Back Close
Full Screen / Esc
Printer-friendly Version
Interactive Discussion
EGU
ent PM2.5 samples including n-alkanes, hopanes, steranes, alkanoic acids,
alkane-dioic acids, PAHs, resin acids, and others (syringols, levoglucosan, cholesterol, 2-methyltetrols, etc.). Some compounds are reasonably unique tracers for certain sources and are widely used to track specific sources of carbonaceous aerosols. Sim-ilar sets of organic species have also been measured for source emissions. Together,
5
they can be used to quantify source impacts on ambient PM2.5.
Source impacts from biomass burning are usually traced through a few organic trac-ers including levoglucosan, resin acids, syringols and retene. As a pyrolysis product of cellulose in wood biopolymers, levoglucosan has been considered a particularly useful molecular marker of biomass burning (Simoneit et al., 1999). With its large
emis-10
sion abundance and reasonable thermal stability in the atmosphere, levoglucosan is frequently used to assess air quality impacts from biomass burning (Fraser and Lak-shmanan, 2000; Schauer and Cass, 2000). Resin acids are thermal alteration prod-ucts of coniferous wood resins and emitted exclusively from softwood burning (various pines, firs, etc.) (Rogge et al., 1998; Simoneit et al., 1993; Standley and Simoneit,
15
1994). In contrast, hardwood combustion produces much higher quantities of syringols (Hawthorne et al., 1988; Hawthorne et al., 1989). Although PAHs are emitted from multiple combustion processes of fuels (biomass, natural gas, diesel and gasoline) and ubiquitous in the atmosphere, retene, a thermal alteration of abietane compounds (resin diterpenoids), is considered as an organic tracer specific for coniferous wood
20
burning (Ramdahl, 1983).
Other primary sources can be also linked to some specific organic tracers. Hopanes and steranes are emitted from both gasoline-powered vehicle and diesel-powered vehi-cle (Simoneit, 1985; Zielinska et al., 2004). They have been widely used as molecular markers of vehicular emissions in source apportionment of PM2.5 and OC (Fraser et
25
al., 2003b; Schauer et al., 1996; Zheng et al., 2002, 2006, 2007). Cholesterol, found in animal fats and oils, is thought as an excellent molecular marker of meat cook-ing emission (Rogge et al., 1991). Vegetative detritus emissions are characterized by high-molecular weight n-alkanes with pronounced odd over even carbon number
ACPD
7, 18015–18042, 2007Carbonaceous aerosols in an aged prescribed fire plume
B. Yan et al. Title Page Abstract Introduction Conclusions References Tables Figures ◭ ◮ ◭ ◮ Back Close
Full Screen / Esc
Printer-friendly Version
Interactive Discussion
EGU
predominance (Rogge et al., 1993a).
In addition to primary components of PM2.5, secondary organic aerosol (SOA) for-mation can result from gaseous emissions of isoprenoids (isoprene and monoter-pene)(Claeys et al., 2004a; Kavouras et al., 1998). A few biogenic SOA species have been identified and quantified including 2-methyltetrols (oxidation products of
iso-5
prene), pinonic acid and pinic acid (oxidation products of monoterpene) (Claeys et al., 2004a, b; Yu et al., 1999a, b). Although dicarboxylic acids (alkanedioic acids and dicar-boxylic aromatic acids) can be emitted from various primary sources (mobile emission, meat cooking, etc.), previous studies suggested that atmospheric photochemical for-mation is probably the main source of these dicarboxylic acids (Fine et al., 2004b;
10
Fraser et al., 2003a; Schauer et al., 2002).
Here, we collected PM2.5 filter samples before, during and after the 28 February
2007 prescribed fire episode impacting Atlanta, GA and analyzed organic composition of carbonaceous aerosols using GC/MS. We further capitalize on the quantified organic tracers to better understand the evolution of wood smoke from wildland fires.
15
2 Method description
2.1 Ambient sampling
Daily PM2.5 samples were collected on 47 mm quartz fiber filters with particulate
com-position monitors (PCM) at the Assessment of Spatial Aerosol Comcom-position in Atlanta (ASACA) sites (Butler et al., 2003). These sites are located in the Atlanta metro area
20
about 80 km downwind from the 28 February 2007 prescribed fires and were impacted directly by the smoke plume. The 24-h daily samples were analyzed for organic car-bon/elemental carbon (OC/EC), metals and ions using thermal optical transmittance (TOT), X-ray fluorescence (XRF) and ion chromatography (IC), respectively. Details of ambient sampling, chemical measurements and particle compositions are described
25
ACPD
7, 18015–18042, 2007Carbonaceous aerosols in an aged prescribed fire plume
B. Yan et al. Title Page Abstract Introduction Conclusions References Tables Figures ◭ ◮ ◭ ◮ Back Close
Full Screen / Esc
Printer-friendly Version
Interactive Discussion
EGU
2.2 Organic speciation
Due to the limitation of low air volumes sampled, the OC mass on a single PCM fil-ter is usually not enough for organic tracer analysis. Therefore, three composite PCM samples (named “Before Fire”, “Event” and “After Fire”) were prepared as below. “Be-fore Fire” was composed of 6 PCM filters from three ASACA sites for the two days
5
before the smoke day. “Event” was composed of 3 PCM filters collected at the same sites on 28 February , the day most directly impacted. “After Fire” was composed of 7 PCM filters from the same sites within the three days after the smoke day. The three composite samples along with a composite field blank were analyzed for or-ganic compounds in PM2.5 using a standardized method described elsewhere (Nolte
10
et al., 2002; Zheng et al., 2002, 2006). Briefly, each filter composite was spiked with deuterated internal standard (IS) mixtures and then successively extracted using hex-ane and benzene/isopropanol (2:1, v/v). After filtering, extracts were concentrated with rotary evaporation followed by blowdown under pure nitrogen. Half of each concen-trated extract was then derivatized with diazomethane to convert organic acids to their
15
methyl esters. These methylated extracts were analyzed by GC/MS along with authen-tic standards. To quantify a few polar organic compounds (levoglucosan, cholesterol, 2-methyltetrols), underivatized remains of concentrated extracts were silylated with BSTFA (N, O-bis(trimethylsilyl)acetamide) to convert polar compounds to trimethylsilyl (TMS) derivatives. After one hour reaction under 70◦C, these silylated extracts were
20
analyzed using GC/MS along with authentic standards.
3 Results and discussion
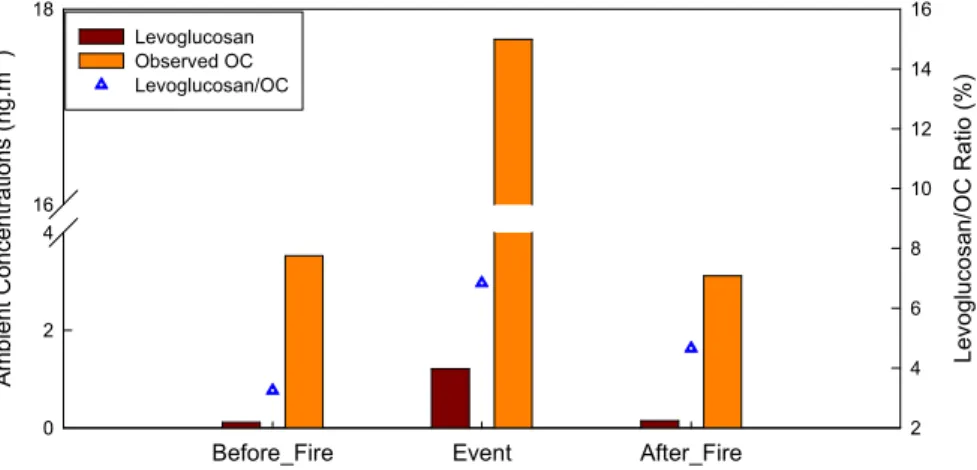
Our results show that the observed 24-h average OC concentration jumped from 3.5 to 17.7 µg m−3 on the event day, accounting for more than 60% (when converted to organic matter by a factor of 1.4) of the total 24-h average PM2.5 mass of 37 µg m−3.
25
ACPD
7, 18015–18042, 2007Carbonaceous aerosols in an aged prescribed fire plume
B. Yan et al. Title Page Abstract Introduction Conclusions References Tables Figures ◭ ◮ ◭ ◮ Back Close
Full Screen / Esc
Printer-friendly Version
Interactive Discussion
EGU
organic tracers.
3.1 Organic tracers of biomass burning
During the smoke, large increases were observed for biomass burning tracers (levoglu-cosan, resin acids, retene, etc.). Levoglucosan was detected in all ambient samples as the most abundant organic compound (Fig. 1). Before and after the smoke event,
5
the observed levoglucosan concentrations were 114 and 145 ng m−3, respectively. On
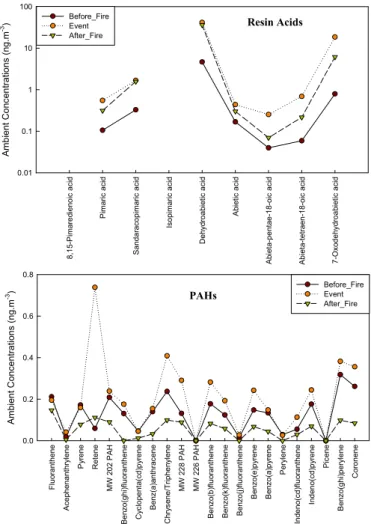
the event day, the levoglucosan concentration increased dramatically to 1210 ng m−3 and contributed 7% of the total OC, suggesting that the wood burning emission im-pact was 10 times higher on the event day than the non-smoke days. Along with levoglucosan, concentrations of resin acids also increased, especially dehydroabietic
10
acid and 7-oxodehydroabietic acid, increasing to 42 and 19 ng m−3, approximately 9 and 23 times higher respectively than the levels before the burning day. Unlike lev-oglucosan, their ambient concentrations remained elevated after the fires (Fig. 2). To elucidate the processes occurring during transport, comparisons between wood burn-ing source emissions and ambient data are conducted here. Ratios of major resin
15
acids to levoglucosan were calculated and compared for both ambient data and a few source emissions from prominent softwood species in the southern United States (Table 1). In the softwood source emissions, abietic acid and dehydroabietic acid gen-erally account for the majority of resin acids, about 58% and 32% respectively on av-erage, while oxodehydroabietic acid is minor. However, dehydroabietic acid and
7-20
oxodehydroabietic acid constituted a major fraction of the observed resin acids, about 65% and 29% respectively, in the ambient sample impacted by the fires. This compari-son provides evidence that dehydroabietic acid and 7-oxodehydroabietic acid are being formed from other resin acids (i.e. diterpenoids) during the 3–4 h (around 80 km travel distance) transport from the burning sites to the monitors. Note that further alterations
25
of dehydroabietic acid and 7-oxodehydroabietic acid exist, leading to their ratios to lev-oglucosan being variable over time during transport. Previous studies have also pro-posed that dehydroabietic acid and 7-oxodehydroabietic acid can be formed through
ACPD
7, 18015–18042, 2007Carbonaceous aerosols in an aged prescribed fire plume
B. Yan et al. Title Page Abstract Introduction Conclusions References Tables Figures ◭ ◮ ◭ ◮ Back Close
Full Screen / Esc
Printer-friendly Version
Interactive Discussion
EGU
oxidation processes of other resin acids (i.e. abietic acids), resulting in accumulated concentrations in the atmosphere (Oros and Simoneit, 2001; Rogge et al., 1993b). Al-though most PAHs did not show significant elevation in ambient concentrations during the event day, retene, a potential softwood burning tracer, increased by around 12 and 7 times, respectively compared to before and after the fire, and predominated among
5
all PAHs (Fig. 2).
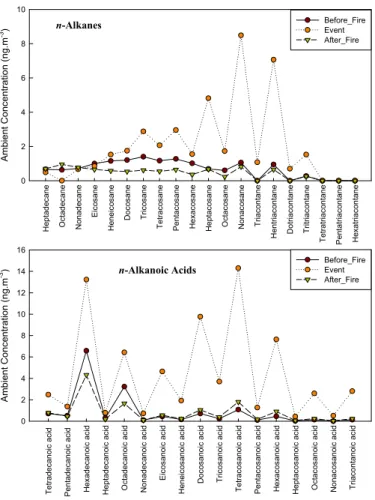
n-alkanes and n-alkanoic acids identified in this study ranged from C17 to C36 and
from C14 to C30, respectively (Fig. 3). Generally, n-alkanes are associated with plant wax and fossil fuel contributions, depending on carbon numbers. To approximately compare source impacts from plant wax versus fossil fuel combustion, the carbon
10
preference index (CPI) measuring carbon number predominance in homologous com-pound series is calculated (Mazurek and Simoneit, 1984; Oros et al., 2006). In the samples before and after the fire, n-alkanes only show a slight odd carbon number predominance with CPIs of 1.4 and 1.7, respectively. However, n-alkanes exhibited dis-tinctly strong odd carbon number predominance (CPI=3.1, carbon number maximum
15
Cmax=29) on the event day, reflecting a major contribution from plant waxes. Likewise,
n-alkanoic acids had a strong even carbon number predominance on the event day (CPI=5.7, Cmax=24). The concentration of even-over-odd carbon number series on the
event day was 50 ng m−3, much larger than those before and after the event (12 and 10 ng m−3, respectively). Thus, a dominant contribution from plant waxes is suggested.
20
These compounds are considered natural products of epicuticular waxes and internal lipid substances in leaf surfaces and emitted as vegetative detritus or through direct thermal volatilization (Rogge et al., 1993a; Simoneit, 2002). Higher leaf temperatures presumably lead to volatilization of these high-molecular weight organic compounds, which can then condense into the particle phase in the atmosphere. This result
indi-25
cates that such waxes are not unique tracers for vegetative detritus when wildland fires also significantly impact air quality.
ACPD
7, 18015–18042, 2007Carbonaceous aerosols in an aged prescribed fire plume
B. Yan et al. Title Page Abstract Introduction Conclusions References Tables Figures ◭ ◮ ◭ ◮ Back Close
Full Screen / Esc
Printer-friendly Version
Interactive Discussion
EGU
3.2 Other primary organic tracers
A few non-biomass organic molecular markers were also analyzed as indicators of other major primary sources. Vehicular engine exhaust and meat cooking are the two other major sources of primary organic carbon in urban areas. The before, during and after concentrations of hopanes and steranes did not show significant variation, i.e. 1.7,
5
1.7 and 1.0 ng m−3, indicating relatively consistent source contributions from vehicular emissions in the Atlanta area (Fig. 4). Cholesterol, an organic tracer of meat cooking, did not exhibit major variation as well (Fig. 5). Thus, it is clear that vehicular sources and meat cooking emissions are not responsible for the large increase in OC, which accounts for 81% of the total OC, on the event day, and that the greatly increased
10
carbonaceous aerosol concentrations during the smoke episode are from prescribed fires. The source apportionment results calculated using organic molecular marker-based chemical mass balance (CMB-MM) model also indicate significant increases of prescribed burning emissions on the event day, but not for other major primary sources (i.e. vehicular source and meat cooking) (Lee et al., 2007). In addition, about 43% of
15
the total observed OC can not be explained by primary source contributions, suggest-ing that secondary organic aerosol (SOA) might be a main contributor to the increased OC.
3.3 Secondary organic tracers
Our results for secondary organic tracers indicate that additional biogenic SOA were
20
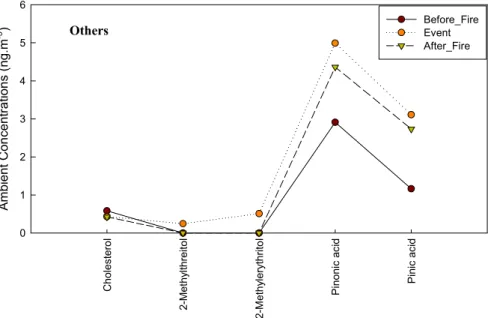
formed during the 28 February 2007 fire episode. 2-methyltetrols, secondary organic products of isoprene, were detected only on the smoke plume day with a concentra-tion of 0.8 ng m−3 (Fig. 5). Pinonic acid and pinic acid, photo-oxidation products of
monoterpenes, increased from 2.9 and 1.2 ng m−3 to 5.0 and 3.1 ng m−3, respectively, from the day prior to the fire through the smoke day (Fig. 5). Additionally, elevated
25
dicarboxylic acids (alkanedioic acids and dicarboxylic aromatic acids) provided sup-portive evidence of increased SOA formation in the atmosphere. They are further
ACPD
7, 18015–18042, 2007Carbonaceous aerosols in an aged prescribed fire plume
B. Yan et al. Title Page Abstract Introduction Conclusions References Tables Figures ◭ ◮ ◭ ◮ Back Close
Full Screen / Esc
Printer-friendly Version
Interactive Discussion
EGU
considered here products of biogenic emissions enhanced by the fire since signifi-cant increases were not found in anthropogenic emissions (i.e. vehicular source and meat cooking). The sums of dicarboxylic acids were 7.5, 51, 8.4 ng m−3 before, during and after the event, respectively. There are three possible hypotheses relating to the large increases in these dicarboxylic acids. The most direct one is that precursors of
5
these compounds are associated with prescribed fire emissions. As stated previously, emissions of biogenic VOC and SVOC (isoprenes, terpenes, sesquiterpenes, alcohols, esters, carbonyls, acids, etc.) would be enhanced by either wood combustion process or increasing leaf temperature. Emissions of isoprenoids (isoprene and monoterpene) have been observed to be higher during forest fires due to increased temperatures
10
(Alessio et al., 2004). A previous study also suggests that leaf temperatures rising from 25 to 35◦C would increase biogenic VOC and SVOC emissions by 4 and 1.5 times from isoprene-emitting deciduous trees and terpene-emitting conifers, respec-tively (Lamb et al., 1987). The second hypothesis is that the dramatic increase in OC mass can enhance formation of SOA due to increased partitioning of these diacids to
15
the particle phase. However, unless there is a significant chemical affinity between OC and the compounds, such a shift is not expected to be so large (less than 10% of enhancement in SOA) (Nopmongcol et al., 2007; Odum et al., 1996). The third hy-pothesis is that enhanced photo-oxidation occurred. The observed increase of ozone in the plume is indicative that this effect might exist, but would be limited since ozone
20
increased about 50% (from around 60 to 90 ppb), significantly less than the increase in dicarboxylic acids (8 times higher). Therefore, among the three hypotheses above, the evidence strongly supports that biomass burning is a major contributor to precursors of dicarboxylic acids. Results of air quality modeling and measurement of water soluble organic carbon (WSOC) provide further supporting evidence (Hu et al., 20071; Lee et
25
ACPD
7, 18015–18042, 2007Carbonaceous aerosols in an aged prescribed fire plume
B. Yan et al. Title Page Abstract Introduction Conclusions References Tables Figures ◭ ◮ ◭ ◮ Back Close
Full Screen / Esc
Printer-friendly Version
Interactive Discussion
EGU
3.4 Source profiles for an aged plume
Capturing the fire event provides information to assess the source composition pro-files of an aged prescribed fire plume. Impacted by the fire plume, OC increased by 14.2 µg m−3, accounting for 81% of total observed OC on the event day while PM2.5
in-creased by 23.9 µg m−3, accounting for 64% of total observed PM2.5. Organic markers
5
of other major primary emissions (vehicular source and meat cooking) did not show significant variation in Atlanta, GA during the episode. Thus, the large increases in OC, PM2.5and associated chemical species on the event day are considered a direct
contribution from prescribed fire emissions. Here, two approximate source composition profiles were developed for the aged biomass burning plume by considering differences
10
between the before event day (non-fire event impacted) and the event day, designated “aged plume profile” and “primary plume profile”. “aged plume profile” is constituted by fractions of individual chemical species (increased concentrations) in the total in-creased (fire-caused total) PM2.5 mass, i.e. 23.9 µg m−3, on the event day (Table 2).
This profile contains chemical compositions of the aged plume, but is not the primary
15
PM2.5 source profile due to large quantities of SOA in aerosol from the fire emissions.
“primary plume profile” is then calculated using fractions of individual chemical species (increased concentrations) in the fire-caused primary PM2.5mass where the estimated fire-caused secondary organic carbon (SOC) was subtracted from the fire-caused total PM2.5 mass on the event day (Table 2). The fire-caused SOC on the event was
esti-20
mated based on the CMB-MM modeling results and measured EC/OC ratios. Briefly, the CMB-MM apportionment results indicate that prescribed fires contributed approx-imately 1.1 and 8.7 µg m−3 to the total primary OC before and on the event day, re-spectively (Lee et al., 2007). The difference, 7.6 µg m−3, is attributed to the plumes. Results here find that the total, primary plus secondary, impact of the plumes on OC is
25
14.2 µg m−3, suggesting that 6.6 µg m−3(47% of the fire-caused total OC) comes from enhanced SOC. A comparable SOC fraction in the fire-caused total OC was also esti-mated using the EC/OC ratio method. In the aged plume, the fire-caused EC/OC ratio
ACPD
7, 18015–18042, 2007Carbonaceous aerosols in an aged prescribed fire plume
B. Yan et al. Title Page Abstract Introduction Conclusions References Tables Figures ◭ ◮ ◭ ◮ Back Close
Full Screen / Esc
Printer-friendly Version
Interactive Discussion
EGU
is 0.039 while a value of 0.065 has been measured for prescribed burning emissions in Georgia (Lee et al., 2005). The lower EC/OC ratio suggests SOA formation in the aged plume. Using those ratios, SOC is calculated to account for 40% of the fire-caused total OC. Averaging the two, 44% of fire-caused total OC is taken as SOC during the event, and the fire-caused primary OC (POCf c) is then estimated by:
5
POCf c=OC (fire − caused) × (1 − fSOC)= [OC (event) − OC (before − event)] × (1 − fSOC) , (1)
where fsoc is the estimated SOC fraction in the fire-caused total OC. Similarly, the
amount of fire caused primary PM2.5(PPMf c) is calculated as:
PPMf c= [PM (event) − PM (before − event)] − OC (fire − caused) ×fSOC. (2)
Finally, factions of individual species (fi) in fire caused primary PM2.5are found as:
10
fi =Ci(event) − Ci(before − event)
PPMf c (3)
where Ci is the ambient concentration of individual chemical species in PM2.5 that are
viewed as being dominated by primary emissions. In addition, an overall uncertainty of each chemical species in the two plume source profiles was calculated by propagating uncertainties associated with the observed OC, estimated SOC fraction and measured
15
chemical species (i.e. organic compounds, EC, ions and trace metals).
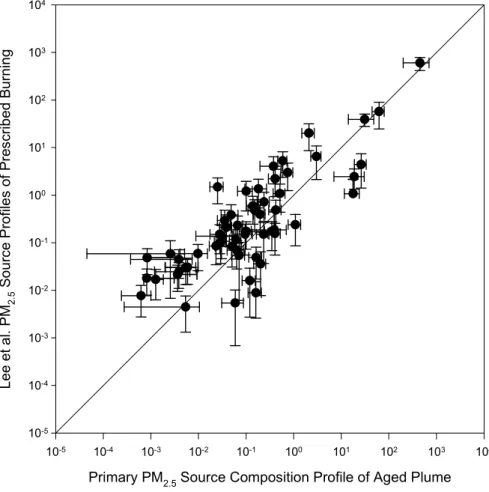
Our study indicates that the “primary plume profile” derived from the fire event is comparable with the prescribed burning emission profile measured by Lee et al. (2005) for some organic compounds, but significantly different for others (Table 2 and Fig. 6). In the aged fire plume, levoglucosan accounts for 14% of primary OC, comparable to
20
9.5% in the profile of Lee et al. (2005). Most n-alkanes also show comparable levels for the two source profiles. Hopanes and steranes were not significant in either set. The ratio of water-soluble potassium (K+)/OC in the “primary plume profile” is 0.0067, lower than the values in Lee et al. (0.011) and in Fine et al. (0.012 on average), but compara-ble to the average ratio of 0.0058 from foliar fuel combustion (Fine et al., 2004a; Hays et
ACPD
7, 18015–18042, 2007Carbonaceous aerosols in an aged prescribed fire plume
B. Yan et al. Title Page Abstract Introduction Conclusions References Tables Figures ◭ ◮ ◭ ◮ Back Close
Full Screen / Esc
Printer-friendly Version
Interactive Discussion
EGU
al., 2002; Lee et al., 2005). However, significant differences were found for the fractions of PAHs, resin acids, n-alkanoic acid and dicarboxylic acids, suggesting aging of fire smoke after a 3–4 h travel distance. Lee et al. (2005) measured higher abundances for many PAHs and resin acids, implying direct combustion is the main contributor of these compounds and significant chemical alteration occurs during transport, especially for
5
resin acids. In contrast, the aged plume has distinctly higher dicarboxylic acids (alka-nedioic acids and dicarboxylic aromatic acids) fractions. Enhanced SOA formation in the atmosphere from the fire is suggested by these secondary indicators. The profile comparison between prescribed fire source emission and aged plume is useful to un-derstand evolution of wood smoke during transport and to assess the organic species
10
applied in CMB-MM modeling. Impacts from aging process of smoke plume should be considered in source apportionment methodology using CMB model, i.e. selection of fitting species.
4 Conclusions
Large increases in PM2.5and OC in Atlanta caused by an aged prescribed fire plume
15
through direct burning emissions and formation of secondary organic aerosols was captured by a system of monitors. Organic tracers of biomass burning, levoglu-cosan, resin acids and retene, exhibited sharp increases in concentrations during the episode. Observed resin acids and retene indicated predominant softwood (conifers) burning. Increases in resin acids were accompanied by high levels of
dehydroabi-20
etic acids and 7-oxodehydroabietic acids, mainly formed during transport. Carbon number predominance for n-alkanes (odd over even) and n-alkanoic acids (even over odd) suggested that emissions from heat-exposed vegetation are important as one of major sources for increasing OC, especially secondary OC. Secondary organic tracers were observed with significantly higher ambient concentrations, providing
fur-25
ther support for biogenic SOA formation. These data allows estimating source pro-files for aged fire plumes, which can be used for improving source apportionment
ACPD
7, 18015–18042, 2007Carbonaceous aerosols in an aged prescribed fire plume
B. Yan et al. Title Page Abstract Introduction Conclusions References Tables Figures ◭ ◮ ◭ ◮ Back Close
Full Screen / Esc
Printer-friendly Version
Interactive Discussion
EGU
of wood burning by CMB modelinghttp://www.atmos-chem-phys-discuss.net/7/18015/
2007/acpd-7-18015-2007-supplement.pdf.
Acknowledgements. This work was funded by the U.S. Environmental Protection Agency STAR
grants (R832159, R828976 and R831076). We would like to thank Georgia Power (Southern Company) for their support of work in Laboratory for Atmospheric Modeling, Diagnostics, and
5
Analysis (LAMDA) at Georgia Institute of Technology in this study area. The authors also acknowledge the helpful forest information provided by D. Tian.
References
Alessio, G. A., De Lillis, M., Fanelli, M., Pinelli, P., and Loreto, F.: Direct and indirect impacts of fire on isoprenoid emissions from Mediterranean vegetation, Funct. Ecol., 18, 357–364,
10
2004.
Baumann, K., Ift, F., Zhao, J. Z., and Chameides, W. L.: Discrete measurements of reactive gases and fine particle mass and composition during the 1999 Atlanta Supersite Experiment, J. Geophys. Res.-Atmos., 108, 8416, doi:10.1029/2001jd001210, 2003.
Butler, A. J., Andrew, M. S., and Russell, A. G.: Daily sampling of PM2.5in Atlanta: results of the
15
first year of the assessment of spatial aerosol composition in Atlanta study, J. Geophys. Res.-Atmos., 108, 8415, doi:10.1029/2002jd002234, 2003.
Claeys, M., Graham, B., Vas, G., Wang, W., Vermeylen, R., Pashynska, V., Cafmeyer, J., Guyon, P., Andreae, M. O., Artaxo, P., and Maenhaut, W.: Formation of secondary organic aerosols through photooxidation of isoprene, Science, 303, 1173–1176, 2004a.
20
Claeys, M., Wang, W., Ion, A. C., Kourtchev, I., Gelencser, A., and Maenhaut, W.: Formation of secondary organic aerosols from isoprene and its gas-phase oxidation products through reaction with hydrogen peroxide, Atmos. Environ., 38, 4093–4098, doi:10.1016/j.atmosenv.2004.06.001, 2004b.
EPA, U. S.: National Air Pollutant Emission Trends 1900–1998, EPA 454/R-400–002, Office
25
Washington, DC, 2000.
Fine, P. M., Cass, G. R., and Simoneit, B. R. T.: Chemical characterization of fine particle emissions from fireplace combustion of woods grown in the northeastern United States, Environ. Sci. Technol., 35, 2665–2675, 2001.
ACPD
7, 18015–18042, 2007Carbonaceous aerosols in an aged prescribed fire plume
B. Yan et al. Title Page Abstract Introduction Conclusions References Tables Figures ◭ ◮ ◭ ◮ Back Close
Full Screen / Esc
Printer-friendly Version
Interactive Discussion
EGU
Fine, P. M., Cass, G. R., and Simoneit, B. R. T.: Chemical characterization of fine particle emissions from the fireplace combustion of woods grown in the southern United States, Environ. Sci. Technol., 36, 1442–1451, 2002.
Fine, P. M., Cass, G. R., and Simoneit, B. R. T.: Chemical characterization of fine particle emissions from the wood stove combustion of prevalent United States tree species, Environ.
5
Eng. Sci., 21, 705–721, 2004a.
Fine, P. M., Chakrabarti, B., Krudysz, M., Schauer, J. J., and Sioutas, C.: Diurnal variations of individual organic compound constituents of ultrafine and accumulation mode particulate matter in the Los Angeles basin, Environ. Sci. Technol., 38, 1296–1304, 2004b.
Fraser, M. P. and Lakshmanan, K.: Using levoglucosan as a molecular marker for the
long-10
range transport of biomass combustion aerosols, Environ. Sci. Technol., 34, 4560–4564, 2000.
Fraser, M. P., Cass, G. R., and Simoneit, B. R. T.: Air quality model evaluation data for organics. 6. C-3-C-24 organic acids, Environ. Sci. Technol., 37, 446–453, 2003a.
Fraser, M. P., Yue, Z. W., and Buzcu, B.: Source apportionment of fine particulate matter in
15
Houston, TX, using organic molecular markers, Atmos. Environ., 37, 2117–2123, 2003b. Hawthorne, S. B., Miller, D. J., Barkley, R. M., and Krieger, M. S.: Identification of
Methoxy-lated Phenols as Candidate Tracers for Atmospheric Wood Smoke Pollution, Environ. Sci. Technol., 22, 1191–1196, 1988.
Hawthorne, S. B., Krieger, M. S., Miller, D. J., and Mathiason, M. B.: Collection and Quantitation
20
of Methoxylated Phenol Tracers for Atmospheric-Pollution from Residential Wood Stoves, Environ. Sci. Technol., 23, 470–475, 1989.
Hays, M. D., Geron, C. D., Linna, K. J., Smith, N. D., and Schauer, J. J.: Speciation of gas-phase and fine particle emissions from burning of foliar fuels, Environ. Sci. Technol., 36, 2281–2295, 2002.
25
Kavouras, I. G., Mihalopoulos, N., and Stephanou, E. G.: Formation of atmospheric particles from organic acids produced by forests, Nature, 395, 683–686, 1998.
Lamb, B., Guenther, A., Gay, D., and Westberg, H.: A National Inventory of Biogenic Hydrocar-bon Emissions, Atmos. Environ., 21, 1695–1705, 1987.
Lee, S., Baumann, K., Schauer, J. J., Sheesley, R. J., Naeher, L. P., Meinardi, S., Blake,
30
D. R., Edgerton, E. S., Russell, A. G., and Clements, M.: Gaseous and particulate emissions from prescribed burning in Georgia, Environ. Sci. Technol., 39, 9049–9056, doi:10.1021/Es0515831, 2005.
ACPD
7, 18015–18042, 2007Carbonaceous aerosols in an aged prescribed fire plume
B. Yan et al. Title Page Abstract Introduction Conclusions References Tables Figures ◭ ◮ ◭ ◮ Back Close
Full Screen / Esc
Printer-friendly Version
Interactive Discussion
EGU
Lee, S., Kim, H. K., Yan, B., Cobb, E., Hennigan, C., Nichols, S., Chamber, M., Edgerton, E. S., Jansen, J. J., Hu, Y. T., Zheng, M., Weber, R. J., and Russell, A. G.: Diagnosis of Aged Prescribed Fire Plumes Hitting an Urban Area: Implications to Air Quality Modeling, Environ. Sci. Technol., in press, 2007.
NIFC (National Interagency Fire Center): fire Information – wildland fire statistics, available at:
5
http://www.nifc.gov/fire info/fire stats.htm, access: August, 2007.
Nolte, C. G., Schauer, J. J., Cass, G. R., and Simoneit, B. R. T.: Trimethylsilyl derivatives of organic compounds in source samples and in atmospheric fine particulate matter, Environ. Sci. Technol., 36, 4273–4281, 2002.
Nopmongcol, U., Khamwichit, W., Fraser, M. P., and Allen, D. T.: Estimates of heterogeneous
10
formation of secondary organic aerosol during a wood smoke episode in Houston, Texas, Atmos. Environ., 41, 3057–3070, 2007.
Odum, J. R., Hoffmann, T., Bowman, F., Collins, D., Flagan, R. C., and Seinfeld, J. H.: Gas/particle partitioning and secondary organic aerosol yields, Environ. Sci. Technol., 30, 2580–2585, 1996.
15
Oros, D. R., and Simoneit, B. R. T.: Identification and emission factors of molecular tracers in organic aerosols from biomass burning Part 1. Temperate climate conifers, Appl. Geochem., 16, 1513–1544, 2001.
Oros, D. R., Bin Abas, M. R., Omar, N. Y. M. J., Rahman, N. A., and Simoneit, B. R. T.: Identification and emission factors of molecular tracers in organic aerosols from biomass
20
burning: Part 3. Grasses, Appl. Geochem., 21, 919–940, 2006.
Ramdahl, T.: Retene – a Molecular Marker of Wood Combustion in Ambient Air, Nature, 306, 580–583, 1983.
Robinson, M. S., Chavez, J., Velazquez, S., and Jayanty, R. K. M.: Chemical speciation of PM2.5 fires of the coconino national collected during prescribed forest near Flagstaff, Arizona, J. Air
25
Waste Manage., 54, 1112–1123, 2004.
Rogge, W. F., Hildemann, L. M., Mazurek, M. A., Cass, G. R., and Simonelt, B. R. T.: Sources of Fine Organic Aerosol .1. Charbroilers and Meat Cooking Operations, Environ. Sci. Technol., 25, 1112–1125, 1991.
Rogge, W. F., Hildemann, L. M., Mazurek, M. A., Cass, G. R., and Simoneit, B. R. T.: Sources of
30
Fine Organic Aerosol .4. Particulate Abrasion Products from Leaf Surfaces of Urban Plants, Environ. Sci. Technol., 27, 2700–2711, 1993a.
Quan-ACPD
7, 18015–18042, 2007Carbonaceous aerosols in an aged prescribed fire plume
B. Yan et al. Title Page Abstract Introduction Conclusions References Tables Figures ◭ ◮ ◭ ◮ Back Close
Full Screen / Esc
Printer-friendly Version
Interactive Discussion
EGU
tification of Urban Organic Aerosols at a Molecular-Level - Identification, Abundance and Seasonal-Variation, Atmos. Environ. A-Gen., 27, 1309–1330, 1993b.
Rogge, W. F., Hildemann, L. M., Mazurek, M. A., Cass, G. R., and Simoneit, B. R. T.: Sources of fine organic aerosol. 9. Pine, oak and synthetic log combustion in residential fireplaces, Environ. Sci. Technol., 32, 13–22, 1998.
5
Schauer, J. J., Rogge, W. F., Hildemann, L. M., Mazurek, M. A., and Cass, G. R.: Source apportionment of airborne particulate matter using organic compounds as tracers, Atmos. Environ., 30, 3837–3855, 1996.
Schauer, J. J. and Cass, G. R.: Source apportionment of wintertime gas-phase and particle-phase air pollutants using organic compounds as tracers, Environ. Sci. Technol., 34, 1821–
10
1832, 2000.
Schauer, J. J., Fraser, M. P., Cass, G. R., and Simoneit, B. R. T.: Source reconciliation of atmospheric gas-phase and particle-phase pollutants during a severe photochemical smog episode, Environ. Sci. Technol., 36, 3806–3814, 2002.
Simoneit, B. R. T.: Application of Molecular Marker Analysis to Vehicular Exhaust for Source
15
Reconciliations, Int J. Environ. An. Ch., 22, 203–233, 1985.
Simoneit, B. R. T., Rogge, W. F., Mazurek, M. A., Standley, L. J., Hildemann, L. M., and Cass, G. R.: Lignin Pyrolysis Products, Lignans, and Resin Acids as Specific Tracers of Plant Classes in Emissions from Biomass Combustion, Environ. Sci. Technol., 27, 2533–2541, 1993. Simoneit, B. R. T., Schauer, J. J., Nolte, C. G., Oros, D. R., Elias, V. O., Fraser, M. P., Rogge, W.
20
F., and Cass, G. R.: Levoglucosan, a tracer for cellulose in biomass burning and atmospheric particles, Atmos. Environ., 33, 173–182, 1999.
Simoneit, B. R. T.: Biomass burning - A review of organic tracers for smoke from incomplete combustion, Appl. Geochem., 17, 129–162, 2002.
Standley, L. J. and Simoneit, B. R. T.: Resin Diterpenoids as Tracers for Biomass Combustion
25
Aerosols, J. Atmos. Chem., 18, 1–15, 1994.
Ward, T. J., Hamilton, R. F., Dixon, R. W., Paulsen, M., and Simpson, C. D.: Characterization and evaluation of smoke tracers in PM: Results from the 2003 Montana wildfire season, Atmos. Environ., 40, 7005–7017, 2006.
Yu, J. Z., Cocker, D. R., Griffin, R. J., Flagan, R. C., and Seinfeld, J. H.: Gas-phase ozone
30
oxidation of monoterpenes: Gaseous and particulate products, J. Atmos. Chem., 34, 207– 258, 1999a.
Obser-ACPD
7, 18015–18042, 2007Carbonaceous aerosols in an aged prescribed fire plume
B. Yan et al. Title Page Abstract Introduction Conclusions References Tables Figures ◭ ◮ ◭ ◮ Back Close
Full Screen / Esc
Printer-friendly Version
Interactive Discussion
EGU
vation of gaseous and particulate products of monoterpene oxidation in forest atmospheres, Geophys. Res. Lett., 26, 1145–1148, 1999b.
Zheng, M., Cass, G. R., Schauer, J. J., and Edgerton, E. S.: Source apportionment of PM2.5 in the southeastern United States using solvent-extractable organic compounds as tracers, Environ. Sci. Technol., 36, 2361–2371, 2002.
5
Zheng, M., Ke, L., Edgerton, E. S., Schauer, J. J., Dong, M. Y., and Russell, A. G.: Spatial distri-bution of carbonaceous aerosol in the southeastern United States using molecular markers and carbon isotope data, J. Geophys. Res.-Atmos., 111, doi:10.1029/2005JD006777 2006. Zheng, M., Cass, G. R., Ke, L., Wang, F., Schauer, J. J., Edgerton, E. S., and Russell, A. G.:
Source apportionment of daily fine particulate matter at Jefferson street, Atlanta, GA, during
10
summer and winter, J. Air Waste Manage., 57, 228–242, 2007.
Zielinska, B., Sagebiel, J., McDonald, J. D., Whitney, K., and Lawson, D. R.: Emission rates and comparative chemical composition from selected in-use diesel and gasoline-fueled vehicles, J. Air Waste Manage., 54, 1138–1150, 2004.
ACPD
7, 18015–18042, 2007Carbonaceous aerosols in an aged prescribed fire plume
B. Yan et al. Title Page Abstract Introduction Conclusions References Tables Figures ◭ ◮ ◭ ◮ Back Close
Full Screen / Esc
Printer-friendly Version
Interactive Discussion
EGU
Table 1. Ratios of major resin acids to levoglucosan in source emissions and ambient samples.
Compounds Softwood Emissions Ambient Samples
Loblolly Pinea Slash Pinea White pineb
Hemlockb Balsam firb Before Fire Smoke After Fire
Pimaric acid 0.069 0.029 0.008 0.001 0.001 0.001 0.000 0.002 Sandaracopimaric acid 0.013 0.011 0.026 0.002 0.001 0.003 0.001 0.011 Dehydroabietic acid 0.339 0.141 0.149 0.017 0.028 0.041 0.034 0.248 Abietic acid 0.801 0.056 0.391 0.021 0.240 0.001 0.000 0.002 Abieta-6,8,11,13,15-pentae-18-oic acid 0.007 0.003 0.005 0.000 0.002 0.000 0.000 0.000 Abieta-8,11,13,15-tetraen-18-oic acid 0.021 0.000 0.010 0.001 0.003 0.001 0.001 0.001 7-Oxodehydroabietic acid 0.009 0.004 0.005 0.001 0.000 0.007 0.015 0.042 a
Softwood species tested by Fine et al. (Fine et al., 2002);
b
ACPD
7, 18015–18042, 2007Carbonaceous aerosols in an aged prescribed fire plume
B. Yan et al. Title Page Abstract Introduction Conclusions References Tables Figures ◭ ◮ ◭ ◮ Back Close
Full Screen / Esc
Printer-friendly Version
Interactive Discussion
EGU
Table 2. Source composition profiles from the aged plume on the event and the previous prescribed burning emission (ng/µg PM2.5).
Compound Aged Plumea PPM
f cb Lee et al.c Compound Aged Plumea PPMf cb Lee et al.c
Fractiond
±stde Fraction±std Fraction±std Fraction±std Fraction±std Fraction±std
n-alkanes Tetracosane 0.0375±0.0208 0.0508±0.0284 0.0836±0.0528 Triacontane 0.0451±0.0116 0.0610±0.0164 0.1168±0.0715 Pentacosane 0.0706±0.0294 0.0956±0.0404 0.1506±0.0954 Hentriacontane 0.2561±0.0731 0.3467±0.1020 0.1737±0.1054 Hexacosane 0.0225±0.0159 0.0305±0.0217 0.1374±0.0913 Dotriacontane 0.0292±0.0075 0.0395±0.0106 0.0000± 0.0001 Heptacosane 0.1728±0.0497 0.2339±0.0693 0.1505±0.1137 Tritriacontane 0.0527±0.0156 0.0713±0.0217 0.0542±0.0480 Octacosane 0.0470±0.0171 0.0637±0.0236 0.0695±0.0416 Tetratriacontane 0.0000±0.0001 0.0000±0.0001 0.0000±0.0001 Nonacosane 0.3115±0.0881 0.4217±0.1231 0.4860±0.2950 Branch-alkanes iso-Nonacosane 0.0000±0.0001 0.0000±0.0001 0.0000±0.0001 iso-Hentriacontane 0.0000±0.0001 0.0000±0.0001 0.0000±0.0001 anteiso-Triacontane 0.0000±0.0001 0.0000±0.0001 0.0000±0.0001 Hopanes 17α(H)-21β(H)-29-Norhopane 0.0022±0.0051 0.0029±0.0069 0.0000±0.0001 22R,17α(H),21β(H)-Homohopane 0.0018±0.0021 0.0025±0.0029 0.0000±0.0001 17α(H)-21β(H)-Hopane 0.0016±0.0047 0.0021±0.0064 0.0000±0.0001 22S,17α(H),21β(H)-Bishomohopane 0.0009±0.0013 0.0012±0.0017 0.0000±0.0001 22,29,30-Trisnorneohopane 0.0022±0.0020 0.0029±0.0028 0.0000±0.0001 22R,17α(H),21β(H)-Bishomohopane 0.0000±0.0001 0.0000±0.0001 0.0000±0.0001 22,29,30-Trisnorhopane 0.0000±0.0001 0.0000±0.0001 0.0000±0.0001 22S,17α(H),21β(H)-Trishomohopane 0.0000±0.0001 0.0000±0.0001 0.0000 ±0.0001 22S,17α(H),21β(H)-Homohopane 0.0028±0.0028 0.0038±0.0038 0.0000±0.0001 22R,17α(H),21β(H)-Trishomohopane 0.0000±0.0001 0.0000±0.0001 0.0000±0.0001 Steranes 20S,R-5α(H),14β(H),17β(H)-Cholestanes 0.0000±0.0001 0.0000±0.0001 0.0000±0.0001 20S,R-5α(H),14β(H),17β(H)-Ergostanes 0.0000±0.0001 0.0000±0.0001 0.0000±0.0001 20R-5α(H),14α(H),17α(H)-Cholestane 0.0000±0.0001 0.0000±0.0001 0.0000±0.0001 20S,R-5α(H),14β(H),17β(H)-Sitostanes 0.0000±0.0001 0.0000±0.0001 0.0000 ±0.0001 PAHs Fluoranthene 0.0000±0.0001 0.0000±0.0001 0.0539±0.0310 Benzo(j)fluoranthene 0.0004±0.0002 0.0006±0.0003 0.0077±0.0049 Acephenanthrylene 0.0009±0.0004 0.0012±0.0005 0.0168±0.0105 Benzo(e)pyrene 0.0039±0.0024 0.0053±0.0033 0.0300±0.0168 Pyrene 0.0000±0.0001 0.0000±0.0001 0.0643±0.0363 Benzo(a)pyrene 0.0006±0.0016 0.0008±0.0022 0.0179±0.0100 Retene 0.0284±0.0077 0.0385±0.0108 0.2102±0.1267 Perylene 0.0000±0.0001 0.0000±0.0001 0.0023±0.0015 Benzo(ghi)fluoranthene 0.0018±0.0018 0.0025±0.0025 0.0585±0.0517 Indeno(1,2,3-cd)fluoranthene 0.0024±0.0011 0.0033±0.0015 0.0000±0.0001 Cyclopenta(cd)pyrene 0.0000±0.0001 0.0000±0.0001 0.1740±0.1058 Indeno(1,2,3-cd)pyrene 0.0028±0.0025 0.0038±0.0034 0.0444±0.0265 Benz(a)anthracene 0.0006±0.0017 0.0008±0.0023 0.0482±0.0268 Picene 0.0000±0.0001 0.0000±0.0001 0.0000±0.0001 Chrysene/Triphenylene 0.0071±0.0041 0.0097±0.0056 0.0589±0.0332 Benzo(ghi)perylene 0.0026±0.0041 0.0036±0.0056 0.0215±0.0120
ACPD
7, 18015–18042, 2007Carbonaceous aerosols in an aged prescribed fire plume
B. Yan et al. Title Page Abstract Introduction Conclusions References Tables Figures ◭ ◮ ◭ ◮ Back Close
Full Screen / Esc
Printer-friendly Version
Interactive Discussion
EGU
Table 2. (Continued.)
Compound Aged Plumea
PPMb
f c Lee et al.
c
Compound Aged Plumea
PPMb
f c Lee et al.
c
Fractiond
±stde Fraction ±std Fraction ±std Fraction ±std Fraction ±std Fraction ±std
PAHs
Benzo(b)fluoranthene 0.0043±0.0028 0.0059±0.0039 0.0304±0.0170 Coronene 0.0039±0.0037 0.0053±0.0051 0.0044±0.0031 Benzo(k)fluoranthene 0.0028±0.0019 0.0038±0.0026 0.0245±0.0136
Resin Acids
8,15-Pimaredienoic acid 0.0000±0.0001 0.0000±0.0001 0.0000±0.0001 Abietic acid 0.0112±0.0043 0.0152±0.0059 0.0000±0.0001 Pimaric acid 0.0185±0.0055 0.0251±0.0077 1.4856±0.8256 Abieta-6,8,11,13,15-pentae-18-oic acid 0.0088±0.0025 0.0120 ± 0.0036 0.0000±0.0001 Sandaracopimaric acid 0.0558±0.0169 0.0756±0.0235 0.0000±0.0001 Abieta-8,11,13,15-tetraen-18-oic acid 0.0263±0.0072 0.0356±0.0101 0.0000±0.0001 Isopimaric acid 0.0000±0.0001 0.0000±0.0001 1.7830±0.9994 7-Oxodehydroabietic acid 0.7430±0.1978 1.0058±0.2773 0.0000±0.0001 Dehydroabietic acid 1.5456±0.4331 2.0923±0.6051 20.073±11.450
Aromatic Acids
1,2-Benzenedicarboxylic acid 0.1185±0.0359 0.1604±0.0499 0.0088±0.0062 1,3-Benzenedicarboxylic acid 0.0286±0.0112 0.0387±0.0154 0.0000±0.0001 1,4-Benzenedicarboxylic acid 0.0436±0.0207 0.0591±0.0284 0.0054±0.0047
Alkanoic Acids
Tetradecanoic acid 0.0741±0.0248 0.1004±0.0343 1.2089±0.7432 Tricosanoic acid 0.1450±0.0392 0.1963±0.0548 0.3941±0.2273 Pentadecanoic acid 0.0359±0.0135 0.0486±0.0187 0.3838±0.2446 Tetracosanoic acid 0.5537±0.1509 0.7496±0.2112 2.9835±1.7399 Hexadecanoic acid 0.2784±0.1320 0.3769±0.1808 4.0548±2.3375 Pentacosanoic acid 0.0488±0.0133 0.0660±0.0186 0.2308±0.1332 Heptadecanoic acid 0.0207±0.0077 0.0280±0.0106 0.1494±0.0907 Hexacosanoic acid 0.3011±0.0811 0.4077±0.1136 2.2120±1.2819 Octadecanoic acid 0.1343±0.0642 0.1818±0.0879 1.3508±0.8111 Heptacosanoic acid 0.0172±0.0046 0.0233±0.0064 0.0850±0.0506 Nonadecanoic acid 0.0262±0.0075 0.0355±0.0105 0.2941±0.1870 Octacosanoic acid 0.1031±0.0276 0.1395±0.0387 0.5953±0.3501 Eicosanoic acid 0.1761±0.0487 0.2383±0.0681 0.7198±0.4371 Nonacosanoic acid 0.0216±0.0056 0.0292±0.0078 0.1014±0.0647 Heneicosanoic acid 0.0740±0.0202 0.1002±0.0283 0.1739±0.1009 Triacontanoic acid 0.1119±0.0299 0.1516±0.0419 0.4837±0.3137 Docosanoic acid 0.3794±0.1031 0.5136±0.1444 1.0757±0.6382
Alkenoic Acids
9-Hexadecenoic acid 0.0000±0.0001 0.0000±0.0001 0.3058±0.2272 9-Octadecenoic acid 0.0000±0.0001 0.0000±0.0001 1.4690±0.8808 9,12-Octadecanedienoic acid 0.0000±0.0001 0.0000±0.0001 1.3574±0.9208
Alkanedioic Acids
Propanedioic acid 0.0000±0.0001 0.0000±0.0001 0.0000±0.0001 Hexanedioic acid 0.0882±0.0264 0.1195±0.0367 0.0159±0.0132 Methylpropanedioic acid 0.0000±0.0001 0.0000±0.0001 0.0000±0.0001 Heptanedioic acid 0.0000±0.0001 0.0000±0.0001 0.0180±0.0159 Butanedioic acid 0.8009±0.2267 1.0842±0.3165 0.2388±0.1533 Octanedioic acid 0.1487±0.0409 0.2013±0.0572 0.0358±0.0280
ACPD
7, 18015–18042, 2007Carbonaceous aerosols in an aged prescribed fire plume
B. Yan et al. Title Page Abstract Introduction Conclusions References Tables Figures ◭ ◮ ◭ ◮ Back Close
Full Screen / Esc
Printer-friendly Version
Interactive Discussion
EGU
Table 2. (Continued).
Compound Aged Plumea
PPMb
f c Lee et al.
c
Compound Aged Plumea
PPMb
f c Lee et al.
c
Fractiond
±stde Fraction±std Fraction±std Fraction±std Fraction±std Fraction±std
Alkanedioic Acids
Methylbutanedioic acid 0.1716±0.0470 0.2323±0.0658 0.0000±0.0001 Nonanedioic acid 0.2986±0.0835 0.4043±0.1167 0.1558±0.1006
Pentanedioic acid 0.1198±0.0347 0.1622±0.0484 0.0489±0.0317 Others
Nonanal 0.0125±0.0088 0.0170±0.0120 0.0000±0.0001 Benz(de)anthracen-7-one 0.0036±0.0023 0.0049±0.0032 0.0000±0.0001
Sinapyl aldehyde 0.0000±0.0001 0.0000±0.0001 0.0000±0.0001 3,5-Dimethoxy-4-hydroxyacetophenone 0.0275±0.0071 0.0372±0.0100 0.0000±0.0001
Acetonylsyringol 0.0581±0.0181 0.0786±0.0252 0.0000±0.0001 Levoglucosan 45.911±12.692 62.151±17.746 57.087±32.377
Coniferyl aldehyde 0.0000±0.0001 0.0000±0.0001 0.0000±0.0001 Cholesterol 0.0000±0.0001 0.0000±0.0001 0.0000±0.0001
Propionylsyringol 0.0000±0.0001 0.0000±0.0001 0.0000±0.0001 OC 593.85±180.15 450.19±250.55 602.50±185.20 Cl− 0.4355±0.0898 0.5895±0.1287 5.2700±2.8900 EC 22.962±12.421 31.085±16.961 39.200±11.300 NH+ 4 13.119±4.4281 17.760±6.1272 1.0700±1.0800 Al 0.0000±0.0001 0.0000±0.0001 0.2290±0.4260 NO− 3 19.310±5.1844 26.141±7.2624 4.4000±2.9900 Si 0.2889±0.2276 0.3911±0.3094 0.1860±0.2580 SO2− 4 13.800±8.5722 18.682±11.680 2.4500±1.1200 K+ 2.2261±0.5044 3.0135±0.7159 6.4900±4.3500 a
source composition profiles where individual chemical species are normalized to the fire-caused total PM2.5mass on the event day;
b
source composition profiles where individual chemical species are normalized to the fire-caused primary PM2.5mass estimated on the event day;
c
source composition profiles from the prescribed burning emission in Georgia (Lee et al., 2005);
d
fraction of chemical species in the associated PM2.5mass (ng/µg PM2.5);
e
ACPD
7, 18015–18042, 2007Carbonaceous aerosols in an aged prescribed fire plume
B. Yan et al. Title Page Abstract Introduction Conclusions References Tables Figures ◭ ◮ ◭ ◮ Back Close
Full Screen / Esc
Printer-friendly Version Interactive Discussion EGU 1 ! "# $% & ' ! "# % ( % ! "# $%
Fig. 1. 24-h average ambient concentrations of OC and levoglucosan observed before, during and after the event day at Atlanta area, GA.
ACPD
7, 18015–18042, 2007Carbonaceous aerosols in an aged prescribed fire plume
B. Yan et al. Title Page Abstract Introduction Conclusions References Tables Figures ◭ ◮ ◭ ◮ Back Close
Full Screen / Esc
Printer-friendly Version Interactive Discussion EGU 2 4 6 8 0 2 4 6 8 0 2 4 6 8 0 2 4 6 8 0 ) * + ( ( + ( , ( -( . -( / 0 1 ( ( ( -( ( 2 % 3 ( 0 1 ( ( "# 0 -0 0 1 " + 1 & 4 5 + 6 7 0 "# 0 1 " -( -1 7 0 0 1 $8 -0 1 " 4 5 + 6 4 5 + 6 7 "# 0 7 9 "# 0 7 : "# 0 7 -1 7 -1 + 1 " . ( ( "# 0 . ( ( -1 + 7 0 -1 " %
Fig. 2. 24-h average concentrations of resin acids and PAHs observed before, during and after the event day at Atlanta area, GA.
ACPD
7, 18015–18042, 2007Carbonaceous aerosols in an aged prescribed fire plume
B. Yan et al. Title Page Abstract Introduction Conclusions References Tables Figures ◭ ◮ ◭ ◮ Back Close
Full Screen / Esc
Printer-friendly Version Interactive Discussion EGU 16 18 6 -( % ( ; ( 6 / 8 8 + 6 3 6 -% ; 8 6 / 8 8 + 6 3 8 ( ( + ( ( 6 3 ( ( 6 -( ( % ( ( ; ( ( ( 6 ( / ( 8 ( 8 ( + ( 6 3 ( 6 -( % ( ; ( 8 ( , -,
-Fig. 3. 24-h average concentrations of n-alkanes and n-alkanoic acids observed before, during and after the event day at Atlanta area, GA.
ACPD
7, 18015–18042, 2007Carbonaceous aerosols in an aged prescribed fire plume
B. Yan et al. Title Page Abstract Introduction Conclusions References Tables Figures ◭ ◮ ◭ ◮ Back Close
Full Screen / Esc
Printer-friendly Version Interactive Discussion EGU 2 4 6 8 0 2 4 6 8 0 2 4 6 8 0 2
Figure 4. 241hr average concentrations of alkanedioic acids, hopanes and steranes observed 4 + -( ( 4 0 1 " -( ( # ( ( 4 0 1 " # ( ( + ( ( 6 3 ( ( 6 -( ( % ( ( ; ( ( 2 6 6 < ; 0 -2 6 6 6 -) < ) 8 0 -) < ) 8 0 -& = , ) 0 " & ) 0 " & = , ) & = , ) , ,6 -& 6 -, 6 -& 6 -, 6 -& 6 -* -!
Fig. 4. 24-h average concentrations of alkanedioic acids, hopanes and steranes observed before, during and after the event day at Atlanta area, GA.
ACPD
7, 18015–18042, 2007Carbonaceous aerosols in an aged prescribed fire plume
B. Yan et al. Title Page Abstract Introduction Conclusions References Tables Figures ◭ ◮ ◭ ◮ Back Close
Full Screen / Esc
Printer-friendly Version Interactive Discussion EGU 0 " " 4 0 1 " 0 " 4 0 1 " 1 0 " + ( + ( *
Fig. 5. 24-h average concentrations of other compounds (cholesterol, 2-methyltetrols, pinonic acid and pinic acid) observed before, during and after the event day at Atlanta area, GA.
ACPD
7, 18015–18042, 2007Carbonaceous aerosols in an aged prescribed fire plume
B. Yan et al. Title Page Abstract Introduction Conclusions References Tables Figures ◭ ◮ ◭ ◮ Back Close
Full Screen / Esc
Printer-friendly Version Interactive Discussion EGU 2 4 6 8 10 12 14 16 18 20 22 24 26 28 30 32 + 1 +4 *, # - + " ( +"# * ! " + 4 * , # + " + ( # *
Fig. 6. Comparison between source composition profiles developed from the aged biomass burning plume on the event and the prescribed burning emission measured by Lee et al. (2005). The profiles are composed of individual species fractions, normalized to primary PM2.5 mass. A log-log scale is used.