HAL Id: hal-01867275
https://hal.sorbonne-universite.fr/hal-01867275
Submitted on 4 Sep 2018HAL is a multi-disciplinary open access
archive for the deposit and dissemination of sci-entific research documents, whether they are pub-lished or not. The documents may come from
L’archive ouverte pluridisciplinaire HAL, est destinée au dépôt et à la diffusion de documents scientifiques de niveau recherche, publiés ou non, émanant des établissements d’enseignement et de
Properties of molten CaCO3 at high pressure
Jessica Hudspeth, Chrystèle Sanloup, Yoshio Kono
To cite this version:
Jessica Hudspeth, Chrystèle Sanloup, Yoshio Kono. Properties of molten CaCO3 at high pres-sure. Geochemical Perspectives Letters, European Assoication of Geochemistry, 2018, pp.17 - 21. �10.7185/geochemlet.1813�. �hal-01867275�
Properties of molten CaCO
3at high pressure
Jessica Hudspeth1, Chryst`ele Sanloup1,∗, Yoshio Kono21Sorbonne Universit´e, CNRS-INSU, Institut des Sciences de la Terre de Paris,
75005 Paris, France.
2HPCAT, Geophysical Laboratory, Carnegie Institution of Washington, USA. ∗
corresponding author (chrystele.sanloup@upmc.fr)
Abstract
We report here the structure of molten CaCO3 studied by in situ X-ray
diffrac-tion using a Paris-Edinburgh press up to 8.7 GPa. Variadiffrac-tions are observed in the medium range order with shrinkage of the intermolecular contributions, reflect-ing higher packreflect-ing efficiency of the carbonate molecules. Density of the melt is obtained from the radial distribution functions, assuming a constant coordination number of 3 for the C-O contribution. Bulk modulus values increase by a factor of 2 over the experimental pressure-temperature range, reaching a value similar to that of underlying crystalline phases at the highest pressure investigated. Those are the first direct density measurements of compressed CaCO3 melt; they agree
well with recent ab initio predictions (Li et al., 2017), which implies that the re-ported flattening of the melting curve followed by a slightly negative curve above 8 GPa cannot be due to crystal-melt density inversion. Instead, the enthalpy of fusion is likely responsible, and we note the peculiar high diffusivity of oxygen in crystalline calcite-V in this regard, with further implications for the mobility of carbonate melts at depth.
Introduction
The geological importance of carbonate melts is linked to their low melting points compared to silicates, and hence their key role in triggering melting at depth (Jones et al., 2013). As such, the properties of carbonate melts are key in processes ranging from incipient melting at the oceanic lithosphere-asthenosphere boundary and lubrication of tectonic plates (Gaillard et al., 2008), to pervasive metasomatism of the continental lithospheric roots (Foley, 2008).
Experimental measurements of the physical properties of molten carbonates under high pressures (P ) are very scarce however. This contrasts with the ad-vances in knowledge on silicate melts under P over the last decade, as reviewed in Kono and Sanloup (2018), and is due to the extreme difficulty in confining such
low-viscosity melts for long durations. Structural data at ambient P have been col-lected on Li2CO3, K2CO3, LiKCO3melts using neutron diffraction (Kohara et al.,
1998), and Na2CO3 using X-ray diffraction (Wilding et al., 2016). The effect of
P on melt compaction, i.e. the bulk modulus, has been assessed for alkali carbon-ate melts by combining ambient P density and acoustic velocity measurements (Liu and Lange, 2003), and from the melting curve for K2CO3 (Liu et al., 2007).
In situ high P density measurements are restricted to two P points for molten K2Ca(CO3)2 (2.75 g·cm−3 at 2.5 GPa-950◦C, 2.58 g·cm−3 at 2.5 GPa-1150◦C,
and 2.80 g·cm−3 at 4 GPa-1050◦C) using the falling sphere technique (Dobson et al., 1996). These first in situ density measurements were complemented by a study of the viscosity of K2Ca(CO3)2and K2Mg(CO3)2melts up to 5.5 GPa
(Dob-son et al., 1996). Such viscosity measurements were very challenging at the time, i.e.before the advent of high speed cameras required to accurately capture rapidly falling spheres. The ultralow viscosity, i.e. two orders of magnitude lower than for molten basalt at 1900 K, was nonetheless confirmed for calcite and dolomite melts (Kono et al., 2014), with no P effect observed up to 6.2 GPa. This latter study also reported the structure of CaCO3melts but information was restricted to
distances greater than 2 ˚A, excluding the C-O bond.
In contrast, there are several reported melting curve measurements, as these do not require long experiments and sample integrity can be preserved. Of partic-ular interest is the report of a flattening of the CaCO3 melting curve at ∼ 8 GPa
followed by a slightly negative slope up to the calcite-aragonite-melt triple point at 13 GPa (Li et al., 2017). This evolution is unique amongst carbonates, with stronger and positive slopes reported for Na2CO3 and MgCO3 (Li et al., 2017).
The flattening of the CaCO3 melting curve was attributed to a density crossover
between solid and liquid CaCO3. However, such crossover is only predicted
the-oretically near 17 GPa, and this discrepancy was attributed to approximations in the ab initio calculations, highlighting the need for further experimental measure-ments of melt density.
We report here structural and density data on molten CaCO3from in situ X-ray
diffraction up to 8.7 GPa and 2073 K, an experimental P -T range that corresponds to upper mantle conditions. Attempt to collect data on molten Na2CO3, K2CO3,
and carbonate mixtures failed, and consequently no results are reported here for these compositions. This might indicate that these compositions have even lower viscosities than pure CaCO3 melt, resulting in escape of the molten carbonates
Structural data
In situenergy-dispersive X-ray diffraction data were collected under high P -T conditions (Table S-1) using a Paris-Edinburgh press. The structure factor, S(q), was derived from the X-ray diffraction patterns (SI). The g(r) radial distribution function, a measure of the probability of finding an atom as a function of the radial distance r, was obtained by Fourier Transform of the spline smoothened S(q).
g(r) − 1 = 1 2π2rn 0 ∞ Z 0 q[S(q) − 1] sin(qr)dq, (1)
where n0 = ρNMA is the atomic density in atoms per ˚A3, NA is Avogadro’s
con-stant, M =100.1 g/mol is the mean atomic molar mass of calcite, and ρ its mass density (see below). The first peak in g(r) is the C-O intramolecular contribution, which is not expected to change significantly over this P -T range. The second peak in g(r) corresponds to the sum of the O-O and Ca-O first neighbour contri-butions at ∼ 2.3 ˚A, and the third peak to the sum of the second Ca-O and first Ca-Ca contributions (∼ 4.0 ˚A). The most pronounced changes in g(r) (Fig.1b) with P are at 3 ˚A, with an increase of intensity related to the inter-molecular O-O distance, and the growth of a shoulder around 3.45-3.5 ˚A related to the Ca-Ca inter-molecular contribution. These observations are consistent with the shrink-age of interatomic distance, most pronounced for Ca-Ca (from 4 ˚A at ambient P ), and increase in intensity predicted for both contributions by molecular dy-namics (MD) calculations (Vuilleumier et al., 2014), as a result of inter-molecular packing upon compression. In contrast, intra-molecular distances do not change significantly. The inter-molecular packing also explains the observed shift of the first sharp diffraction peak in S(q)(Fig.1a). Concomitantly, MD simulations indi-cate a gradual increase of the number of carbonate ions around Ca from 6 as in calcite to 9 as in aragonite. It is not possible to estimate the Ca-C coordination number from the present data due to the prominence of the major contributions of neighbouring Ca-O and Ca-Ca. However, correspondance between Vuilleu-mier et al. (2014) MD simulations and our results supports their conclusions, i.e. the P -evolution of the liquid structure smoothes out the abrupt changes occurring across the underlying crystalline calcite V-aragonite transition.
Density evolution
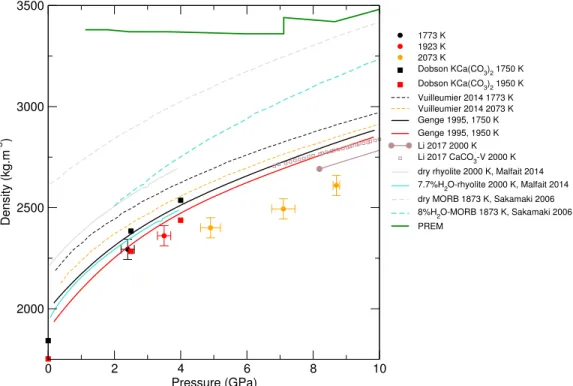
The density of CaCO3melts (Fig.2) is calculated from the area below the C-O
2 4 6 8 10 12 14 q (Å-1) 0.0 0.5 1.0 1.5 S(q) 0 1 2 3 4 5 6 7 8 r (Å) 0 0.5 1 1.5 2 2.5 g(r) Vuilleumier MD 0.5 GPa-1623 K 2.4 GPa-1773 K 3.5 GPa-1923 K 4.7 GPa-2073 K 7.4 GPa-2073 K 8.7 GPa-2073 K a b O-O C-O Ca-O
Figure 1: (a) Structure factors, S(q), of molten CaCO3; curves are stacked to
bet-ter see the evolution with increased P -T conditions (given on the right panel); the main change affecting S(q) (Fig.1a) is the shift of the first sharp diffraction peak (FSDP) towards higher reciprocal distances, up to 2.28 ˚A−1at 8.7 GPa which cor-responds in the real space to a characteristic mid-range order distance, 2π/qF SDP,
of 2.76 ˚A. (b) Corresponding radial distribution functions (plain curves), g(r), compared to MD simulations (dashed curve, Vuilleumier et al. (2014)).
0 2 4 6 8 10 Pressure (GPa) 2000 2500 3000 3500 Density (kg.m -3 ) 1773 K 1923 K 2073 K Dobson KCa(CO 3)2 1750 K Dobson KCa(CO3)2 1950 K Vuilleumier 2014 1773 K Vuilleumier 2014 2073 K Genge 1995, 1750 K Genge 1995, 1950 K Li 2017 2000 K Li 2017 CaCO 3-V 2000 K dry rhyolite 2000 K, Malfait 2014 7.7%H2O-rhyolite 2000 K, Malfait 2014 dry MORB 1873 K, Sakamaki 2006 8%H
2O-MORB 1873 K, Sakamaki 2006 PREM
Figure 2: Density of molten CaCO3from experiments (circles: this work, squares:
Dobson et al. (1996)) and theoretical calculations (Genge et al., 1995; Vuilleu-mier et al., 2014; Li et al., 2017), compared to the seismological PREM model (Dziewonski and Anderson, 1981), crystalline calcite V (Li et al., 2017), molten hydrous and dry rhyolite (Malfait et al., 2014), molten hydrous and dry basalt (Sakamaki et al., 2006).
three O in the studied P -T range, but C becomes tetrahedrally coordinated above 50 GPa in crystalline MgCO3 (Oganov et al., 2008) and above 76 GPa in
crys-talline CaCO3 (Pickard and Needs, 2015). How this 3-fold to 4-fold transition
translates at very high P in the molten state remains to be investigated. The cal-culated density values are consistant with MD simulations by Genge et al. (1995), although the mismatch with more recent simulations (Vuilleumier et al., 2014) is larger, but seems to be in agreement with ab initio calculations from Li et al. (2017).
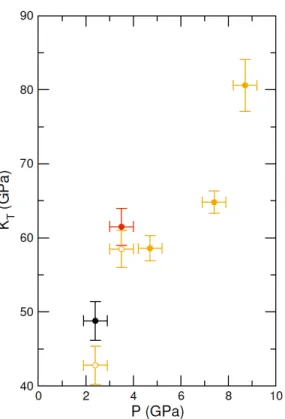
It is difficult to determine the isothermal bulk modulus, KT, by fitting an
equa-tion of state to only three data points on the 2073 K isotherm. An alternative method to assess KT (Egelstaff, 1994) is by extrapolating S(q) to q = 0 ˚A−1
(Fig.S-2 and SI) as lim q→0S(q) = nT kB KT , (2)
where kB is Boltzmann’s constant. This method has been previously
bench-marked for molten fayalite using the same experimental set-up (Sanloup et al., 2013). Resulting KT values are provided on Fig.3, along with a correction of the
two lowest P points to the 2073 K isotherm using dKT/dT = 0.02 K−1 from
Genge et al. (1995). At 8.7 GPa, the bulk modulus (80.6±3.5 GPa) is identical to that of crystalline aragonite (79.5-81.3 GPa) using KT,0, K0 and dKT/dT
val-ues provided in Litasov et al., 2017), and although no high T data are available for calcite V, KT ,0, K0 for aragonite is similar to that of calcite I (Redfern and
Angel, 1999). Compared to silicate melts (Fig.2), molten CaCO3 is less
com-pressible than basalt (Sakamaki et al., 2006) especially at high P , but is only approximately 5% less dense than hydrous rhyolite (Malfait et al., 2014), with a similar P -evolution (although the latter has only been investigated up to 4 GPa).
Discussion
Our results confirm the liquid density of CaCO3 estimated from ab initio
cal-culations (Li et al., 2017). There is no experimental data on the thermal equation of state of calcite V due to its very limited T -stability field (<200 K) and strong recrystallization processes at high T (Suito et al., 2001), but the good agreement between experimental and theoretical estimates of liquid density lends support to theoretical calcite-V equation of state (Li et al., 2017). Density crossover between solid and liquid phases may hence only occur at 17 GPa as predicted (Li et al., 2017). The reason for the flattening of melting curve around 8 GPa, followed by a slightly negative slope up to the calcite V-aragonite-liquid triple point, may consequently be related to changes in the fusion enthalpy rather than a density crossover. Calcite V has a very peculiar molecular structure, with the oxygen sub-lattice being molten and the oxygen atoms diffusing along an undulated circular orbit (Ishizawa et al., 2013). Such high diffusion of oxygen in crystalline CaCO3
phases is unique to calcite, and in particular, it does not occur in aragonite. Al-though it is not possible to probe this by X-ray diffraction, it is expected that the change of oxygen mobility also occurs in the molten state from calcite-like at low P to aragonite-like at high P . It appears this does not affect the viscosity of the melt vs P (Kono et al., 2014), as the latter is controlled by the diffusivity of the cations. Due to the gradual nature of the structural changes in the molten state, this highly diffusive state will decrease in the melt at lower P than it does in the
crys-Figure 3: Bulk modulus of molten CaCO3as a function of P (black: 1773 K, red:
1923 K, orange: 2073 K, orange empty circles: 1773 K and 1923 K data corrected for T =2073 K).
talline state. Enhanced diffusive motion of oxygen in calcite V is consequently expected to cause a large enthalpy decrease upon melting into an aragonite-like high P liquid. Similarly, a strong increase of the melting enthalpy ∆H (i.e. T ∆S) of water has been measured above 15 GPa and up to the ice VII-superionic ice X transition, associated with enhanced diffusion of H atoms in the liquid (Goncharov et al., 2009).
The unique feature of the melting curve of CaCO3 amongst carbonates
there-fore seems related to the particularity of calcite V. The existence of a P -range with negative melting curve related to variation in fusion enthalpy implies that adding heat to the system will freeze it. Corresponding geodynamical settings could be slab-derived melts entrained in upward plumes rising from the transition zone, as proposed for the generation of deep diamonds (Bulanova et al., 2010). Deep car-bonate melts cannot indeed derive from melting in the peridotite+CO2system but
from subducted carbonaceous sediments or from metasomatised eclogites (Ham-mouda and Keshav, 2015), keeping in mind that carbonatitic melts produced above 15 GPa get Mg-enriched while Ca-rich melts (Ca#=0.68-0.70) are reported in the 8-14 GPa range (Thomson et al., 2016), coincidental to the negative CaCO3
melt-ing slope. The nature of deep diamond inclusions also points to the presence of Ca-rich protoliths or calcic melts at depths exceeding 300-350 km (Korsakov and Hermann, 2006; Bulanova et al., 2010). Freezing of melts entrained in a plume might then explain the complex, broken and heavily deformed shapes of deep diamonds, indicating formation in a very viscous environment.
Density and structural data are yet to be collected on other carbonate melts, including alkali compositions, in order to assess the properties of all natural com-positions. This will require using faster density/structural probes, due to the chal-lenge of confining such inviscid and highly reactive melts under pressure.
Acknowledgments. We acknowledge funding from the European Community’s Seventh Framework Programme (FP7/2007-2013) under grant agreements no. 312284 and 259649 (European Research Council starting grant to C.S.). High-pressure experiments were performed at HPCAT (Sector 16), Advanced Photon Source (APS), Argonne National Laboratory. HPCAT operation is supported by DOE-NNSA under Award No. DE-NA0001974, with partial instrumentation funding by NSF. The Advanced Photon Source is a U.S. Department of Energy (DOE) Office of Science User Facility operated for the DOE Office of Science by Argonne National Laboratory under Contract No. DE-AC02-06CH11357.
Y. K. acknowledges the support of DOE-BES/DMSE under Award DE-FG02-99ER45775 and support by the National Science Foundation under Award No. EAR-1722495. We acknowledge O. Boudouma for help with SEM analysis, and C. Kenney-Benson for providing cell-assembly parts. We thank an anonymous reviewer and T. Hammouda for thoughtful reviews of the manuscript.
References
Bulanova, G. P., Walter, M. J., Smith, C. B., Kohn, S. C., Armstrong, L. S., Blundy, J., and Gobbo, L. (2010). Mineral inclusions in sublithospheric dia-monds from Collier 4 kimberlite pipe, Juina, Brazil: subducted protoliths, car-bonated melts and primary kimberlite magmatism. Contrib. Mineral. Petrol., 160:489–510.
Dobson, D. P., Jones, A. P., Rabe, R., Sekine, T., Kurita, K., Taniguchi, T., Kondo, T., Kato, T., Shimomura, O., and Urakawa, S. (1996). In-situ measurement of viscosity and density of carbonate melts at high pressure. Earth Planet. Sci. Lett., 143:207–215.
Dziewonski, A. M. and Anderson, D. L. (1981). Preliminary reference Earth model. Phys. Earth Planet. Int., 25:297–356.
Egelstaff, P. A. (1994). An Introduction to the Liquid State. Oxford University Press, Oxford.
Foley, S. F. (2008). Rejuvenation and erosion of the cratonic lithosphere. Nature Geosci., 1:503–510.
Gaillard, F., Malki, M., Iacono-Marziano, G., Pichavant, M., and Scaillet, B. (2008). Carbonatite melts and electrical conductivity in the asthenosphere. Sci-ence, 322:1363–1365.
Genge, M. J., l. G. David Price, and Jones, A. P. (1995). Molecular dynamics simulations of CaCO3melts to mantle pressures and temperatures: implications
for carbonatite magmas. Earth Planet. Sci. Lett., 131:225–238.
Goncharov, A. F., Sanloup, C., Goldman, N., Crowhurst, J. C., Bastea, S., Howard, W. M., Fried, L. E., Guignot, N., Mezouar, M., and Meng, Y. (2009). Dissociative melting of ice VII at high pressure. J. Chem. Phys., 130:124514. Hammouda, T. and Keshav, S. (2015). Melting in the mantle in the presence of
carbon: Review of experiments and discussion on the origin of carbonatites. Chem. Geol., 418:171–188.
Ishizawa, N., Setoguchi, H., and Yanagisawa, K. (2013). Structural evolution of calcite at high temperatures: Phase V unveiled. Sci. Rep., 3:2832.
Jones, A. G., Genge, M., and Carmody, L. (2013). Carbonate melts and carbon-atites, volume 75, pages 289–322. Mineralogical Society of America.
Kohara, S., Badyal, Y. S., Kouray, N., Idemotoy, Y., Takahashi, S., Curtiss, L. A., and Saboungi, M.-L. (1998). The structure of molten alkali carbonates studied by neutron diffraction and ab initio calculations. J. Phys.: Condens. Matter, 10:3301–3308.
Kono, Y., Park, C., Kenney-Benson, C., Shen, G., and Wang, Y. (2014). To-ward comprehensive studies of liquids at high pressures and high temperatures: Combined structure, elastic wave velocity, and viscosity measurements in the Paris-Edinburgh cell. Phys. Earth Planet. Int., 228:269–280.
Kono, Y. and Sanloup, C. (2018). Magmas under Pressure: Advances in High-Pressure Experiments on Structure and Properties of Melts. Elsevier, Amster-dam, The Netherlands.
Korsakov, A. K. and Hermann, J. (2006). Silicate and carbonate melt inclusions associated with diamonds in deeply subducted carbonate rocks. Earth Planet. Sci. Lett., 241:104–118.
Li, Z., Li, J., Lange, R., Liu, J., and Militzer, B. (2017). Determination of calcium carbonate and sodium carbonate melting curves up to Earth’s transition zone pressures with implications for the deep carbon cycle. Earth Planet. Sci. Lett., 457:395–402.
Litasov, K. D., Shatskiy, A., Gavryushkin, P. N., Bekhtenova, A. E., Dorogoku-pets, P. I., Danilov, B. S., Higo, Y., Akilbekov, A. T., and Inerbaev, T. M. (2017). P-V-T equation of state of CaCO3aragonite to 29 GPa and 1673 K: In situ X-ray
diffraction study. Phys. Earth Planet. Int., 2654:82–91.
Liu, Q. and Lange, R. A. (2003). New density measurements on carbonate liq-uids and the partial molar volume of the CaCO3component. Contrib. Mineral.
Petrol., 146:370–381.
Liu, Q., Tenner, T. J., and Lange, R. A. (2007). Do carbonate liquids become denser than silicate liquids at pressure? Constraints from the fusion curve of K2CO3to 3.2 GPa. Contrib. Mineral. Petrol., 153:55–66.
Malfait, W. J., Seifert, R., Petitgirard, S., Perrillat, J.-P., Mezouar, M., Ota, T., Nakamura, E., Lerch, P., and Sanchez-Valle, C. (2014). Supervolcano eruptions
driven by melt buoyancy in large silicic magma chambers. Nat. Geoscience, 7:122–125.
Oganov, A. R., Ono, S., Ma, Y., Glass, C. W., and Garcia, A. (2008). Novel high-pressure structures of MgCO3, CaCO3 and CO2 and their role in Earth’s lower
mantle. Earth Planet. Sci. Lett., 273:38–47.
Pickard, C. J. and Needs, R. J. (2015). Structures and stability of calcium and magnesium carbonates at mantle pressures. Phys. Rev. B, 91:104101.
Redfern, S. A. T. and Angel, R. J. (1999). High-pressure behaviour and equation of state of calcite, CaCO3. Contrib. Mineral. Metrol., 134:102–106.
Sakamaki, T., Suzuki, A., and Ohtani, E. (2006). Stability of hydrous melt at the base of the Earth’s upper mantle. Nature, 439:192–194.
Sanloup, C., Drewitt, J. W. E., Cr´episson, C., Kono, Y., Park, C., McCammon, C., Hennet, L., Brassamin, S., and Bytchkov, A. (2013). Structure and density of molten fayalite at high pressure. Geochim. Cosmochim. Acta, 118:118–128. Suito, K., Namba, J., Horikawa, T., Taniguchi, Y., Sakurai, N., Kobayashi, M.,
Onodera, A., Shimomura, O., and Kikegawa, T. (2001). Phase relations of CaCO3at high pressure and high temperature. Am. Min., 86:997–1002.
Thomson, A. R., Walter, M. J., Kohn, S. C., and Brooker, R. A. (2016). Slab melting as a barrier to deep carbon subduction. Nature, 529:76–79.
Vuilleumier, R., Seitsonen, A., Sator, N., and Guillot, B. (2014). Structure, equa-tion of state and transport properties of molten calcium carbonate (CaCO3) by
atomistic simulations. Geochim. Cosmchim. Acta, 141:547–566.
Wilding, M. C., Wilson, M., Alderman, O. L. G., Benmore, C., Weber, J. K. R., Parise, J. B., Tamalonis, A., and Skinner, L. (2016). Low-dimensional network formation in molten sodium carbonate. Sci. Reports, 6:24415.