HAL Id: hal-02308402
https://hal.archives-ouvertes.fr/hal-02308402
Submitted on 15 May 2020HAL is a multi-disciplinary open access archive for the deposit and dissemination of sci-entific research documents, whether they are pub-lished or not. The documents may come from teaching and research institutions in France or abroad, or from public or private research centers.
L’archive ouverte pluridisciplinaire HAL, est destinée au dépôt et à la diffusion de documents scientifiques de niveau recherche, publiés ou non, émanant des établissements d’enseignement et de recherche français ou étrangers, des laboratoires publics ou privés.
Quantifying and modelling the impact of land
consolidation and field borders on soil redistribution in
agricultural landscapes (1954–2009)
Caroline Chartin, O. Evrard, Sébastien Salvador-Blanes, Florent Hinschberger,
Kristof van Oost, Irène Lefèvre, Joël Daroussin, Jean-Jacques Macaire
To cite this version:
Caroline Chartin, O. Evrard, Sébastien Salvador-Blanes, Florent Hinschberger, Kristof van Oost, et al.. Quantifying and modelling the impact of land consolidation and field borders on soil re-distribution in agricultural landscapes (1954–2009). CATENA, Elsevier, 2013, 110, pp.184-195. �10.1016/j.catena.2013.06.006�. �hal-02308402�
Quantifying and modelling the impact of land consolidation and field borders on soil
1
redistribution in agricultural landscapes (1954 – 2009)
2
Caroline Chartin1,2, Olivier Evrard2*, Sébastien Salvador-Blanes1, Florent Hinschberger1, 3
Kristof Van Oost3, Irène Lefèvre2, Joël Daroussin4, Jean-Jacques Macaire1 4
1 EA 6293 GéHCo (Géo-Hydrosystèmes Continentaux), EA 6293, Université François-Rabelais de Tours, 5
Faculté des Sciences et Techniques, Parc de Grandmont, 37200 Tours (France)
6
2
LSCE (Laboratoire des Sciences du Climat et de l’Environnement), UMR 8212(CEA-CNRS-UVSQ) 7
Avenue de la Terrasse, 91198 Gif-sur-Yvette (France) 8
3
TECLIM – Earth & Life Institute, Université catholique de Louvain, Place Louis Pasteur, 1348 9
Louvain-la-Neuve (Belgium) 10
4
INRA – Unité de Science du Sol, 2163 avenue de la Pomme de Pin, CS 40001 Ardon, 45075 Orléans 11
Cedex 2, France 12
13
*
Corresponding author. Tel.: +33 1 69 82 35 41; fax: +33 1 69 82 35 68.
14
E-mail address: [email protected] (C.Chartin) 15
Present address: LSCE (Laboratoire des Sciences du Climat et de l’Environnement), UMR 8212 16
(CEA-CNRS-UVSQ) Avenue de la Terrasse, 91198 Gif-sur-Yvette (France) 17
18
Abstract
19
Soil erosion rates in cultivated areas have intensified during the last decades leading to 20
both on and off-site problems for farmers and rural communities. Furthermore, soil 21
redistribution processes play an important role in sediment and carbon storage within, and 22
exports from, cultivated catchments. This study focuses on the impact of land consolidation 23
and changes in landscape structure on medium term soil erosion and landscape morphology 24
within a 3.7-ha field in France. The area was consolidated in 1967 and we used the 137 Cs-25
technique to quantify soil erosion for the period (1954-2009). We measured the 137Cs 26
*revised manuscript
inventories of 68 soil cores sampled along transects covering the entire area and especially 27
specific linear landforms located along both present and past field borders (i.e., lynchets and 28
undulations landforms, respectively). These results were then confronted with the outputs of a 29
spatially-distributed 137Cs conversion model that simulates and discriminates soil 30
redistribution induced by water and tillage erosion processes. Our results showed that tillage 31
processes dominated the soil redistribution in our study area for the last 55 years and 32
generated about 95% (i.e., 4.50 Mg.ha-1.yr-1) of the total gross erosion in the field. 33
Furthermore, we demonstrated that soil redistribution was largely affected by the presence of 34
current and also former field borders, where hotspots areas of erosion and deposition (> 20 35
Mg.ha-1.yr-1) were concentrated. Land consolidation contributed to the acceleration of soil 36
erosion through the conversion of depositional areas into sediment generating areas. Although 37
the conversion model was able to reproduce the general tendencies observed in the patterns of 38
137
Cs inventories, the model performance was relatively poor with a r² of 0.20. Discrepancies 39
were identified and associated with sampling points located along the current field borders. 40
Our data suggests that tillage erosion processes near field boundaries cannot be described as a 41
typical diffusive process. These processes near field boundaries should be characterised and 42
taken into account in a future version of the model to accurately simulate rates and patterns of 43
past soil redistribution in fragmented cultivated hillslopes. We also showed that the use of an 44
accurate DEM resulting from LIDAR data, based on present-day topography, leads to the 45
underestimation of soil redistribution rates by the model, especially in this landscape 46
submitted to recent and important morphological changes. Our results have important 47
implications for the simulation of tillage erosion processes and our understanding of soil 48
redistribution processes in complex cultivated areas. This is of particular interest to improve 49
our knowledge and prediction of patterns of soil physical parameters, such as carbon storage 50
or water content, particularly sensitive to surface erosion and landscape structuration. 51
52
Keywords: Soil erosion; Field border; Land consolidation; Cesium-137; Conversion model;
53 LIDAR 54 55 1. Introduction 56
During the last decades, soil erosion rates in cultivated areas of western Europe have 57
intensified and have become a problematic issue for farmers and rural communities. When it 58
is triggered by heavy storms, soil erosion and the associated muddy floods can have 59
disastrous and costly consequences (e.g. Pimentel et al., 1995; Evrard et al., 2007a). 60
Additional concerns about soil erosion are related to its subsequent negative impacts, such as 61
water pollution, decline in biodiversity and crop yields or reduction of soil water storage 62
capacity or organic carbon sequestration (e.g. Andraski and Lowery, 1992; Berger et al., 2006; 63
Boardman and Poesen, 2006; Papiernick et al., 2009). Because soil is a non-renewable 64
resource at human timescales, soil protection is crucial. Quantification of erosion and 65
deposition rates and the identification of their driving processes and their spatial variability 66
therefore constitute a prerequisite to develop and implement soil protection strategies. 67
Traditionally, soil redistribution processes observed on croplands in western Europe 68
were mainly attributed to water erosion processes. In that case, transport intensity is 69
controlled by topographical settings such as slope, drainage area and planform curvature 70
(Poesen, 1984; Foster, 1986; Chaplot and Le Bissonnais, 2003). However, research has shown 71
that tillage operations result in significant soil redistribution in intensively farmed cropland 72
(e.g. Lindstrom et al., 1992; Govers et al., 1994). Tillage erosion results from the net 73
downslope translocation of soil, controlled by slope gradient change, during farming 74
operations (Lindström et al., 1990; Govers et al., 1994; Montgomery et al., 1999; Van 75
Muysen et al., 1999). As shown by Govers et al. (1994), water and tillage-induced erosion 76
depend on different topographical parameters resulting in a specific spatial signature in the 77
landscape. Tillage erosion is the most intense on landscape positions where water erosion is 78
minimal (i.e. on convexities and in the proximity of upslope field boundaries), whereas areas 79
of tillage deposition often coincide with areas of maximal water erosion as hollows (Govers et 80
al., 1994; 1996; Van Oost et al., 2000). 81
The hydrological and sedimentological connectivity across cultivated hillslopes is to a 82
large extent controlled by the presence of field borders and associated linear elements, such as 83
hedges, roads, furrows and grass strips, which induce landscape fragmentation (Van Oost et 84
al., 2000; Follain et al., 2006; Szilassi et al., 2006). Vegetated borders (e.g., grass strips, 85
hedges and grassed waterways) can reinfiltrate surface runoff and trap sediment transported 86
by water (Van Dijk et al., 1996; Caubel et al., 2003; Evrard et al., 2008). In contrast, concave 87
anthropogenic features (e.g., furrows) provide preferential drainage pathways, thereby 88
increasing hydrological and sedimentological connectivity across the landscape. Linear 89
landscape elements with a compacted surface (e.g. roads, land tracks) have a limited 90
infiltration capacity and then enhance runoff and hydrological connectivity (Wemple et al., 91
1996; Forman and Alexander, 1998). In tilled fields, all types of field borders act as lines of 92
zero-flux (Dabney et al., 1999; Van Oost et al., 2000). Consequently, tillage-induced 93
deposition and erosion preferentially occur upslope and downslope of field borders that are 94
oriented parallel to contour lines. 95
Field borders can therefore act as barriers to water and sediment fluxes generated by 96
both water and tillage erosion (Dabney et al., 1999; Govers et al., 1999; De Alba, 2003; Van 97
Dijk et al., 2005; Knapen et al., 2008). Interaction between erosion and deposition processes 98
at the vicinity of field borders leads to the development of anthropogenic linear landforms of 99
several metres width (e.g., ridges-and-furrows, headlands, and lynchets). These features are 100
common in the agricultural landscapes of western Europe (Callot, 1980; Hooke, 1988; 101
Zadora-Rio, 1991). These landforms are not conserved after the removal of the field border 102
but will instead keep evolving, and may finally lead to the formation of undulations (Houben, 103
2008; Chartin et al., 2011). Assessing the effect of field borders and their potential removal is 104
then essential to understand past, present and future spatial patterns of soil redistribution and 105
soil properties in the current global change context. 106
Agricultural policy and mechanisation led to the massive removal of field borders 107
through the implementation of numerous land consolidation schemes between 1960 and 1990 108
in western Europe (Baudry and Burel, 1984; Vitikainen, 2004), and is still ongoing in some 109
regions. The use of 137Cs-technique can therefore offer a solution to evaluate soil 110
redistribution over these last decades (e.g., Rogowski and Tamura, 1965; Ritchie and 111
McHenry, 1990; Walling and Quine, 1992). 112
This study aims to quantify and improve our understanding of the effects of land 113
consolidation and field borders on mid-term soil erosion and on agricultural landscape 114
evolution. In order to achieve this objective, we analysed spatial patterns of 137Cs inventories 115
for an agricultural hillslope that was subjected to land consolidation. The study area is 116
representative for field consolidation in intensively cultivated areas of the southwestern 117
Parisian basin (France). We used a spatially-distributed model to convert these observations 118
into soil redistribution rates. Emphasis will be put on the impact of small-scale topographical 119
features, especially lynchets and undulations landforms associated with local soil 120
accumulation along current and former field borders. Finally, we discuss the wider 121
implications of our findings in relation to agricultural landscape evolution and model 122
development. 123
124
2. Materials and methods
125
2.1. Study area
2.1.1. Location and physiographical settings
127
The study was conducted on a 3.7 ha field located at the downslope part of a south-128
east facing hillslope in the southwestern Parisian Basin, France (47°08.31’N, 0°10.97’E) (Fig. 129
1). The area is part of the Quincampoix watershed and is characterised by an undulating 130
topography commonly observed in terrains underlain by Cretaceous chalks in this region. In 131
the study field, the elevation ranges between 43 to 60m with slope between 0 to 8.8%. Two 132
types of linear anthropogenic landforms - lynchet and undulation – were also identified within 133
this field (see further). 134
Soils are calcaric Cambisols, epileptic calcaric Cambisols and colluvic Cambisols with 135
clay and loam textures (Boutin et al., 1990; FAO, 1998). The mean annual precipitation 136
reaches ca. 600 mm and isevenly distributed throughout the year. 137
We reconstructed the changes in field boundaries using aerial photographs for 1945, 138
1959 and 2009. The study area is presently a unique field but it was divided into seven 139
individual fields before the last important campaign of land consolidation that occurred in 140
1967 (Fig. 2). Interviews with local farmers and aerial photographs have demonstrated that 141
this area has been cultivated with cereals and oilseed crops (maize, sunflower, wheat, barley 142
and rape) since at least 1945. 143
144
2.1.2. Characteristics of the anthropogenic linear landforms
145
We observed one lynchet (L1) and two undulations (U1, U2) in the study area. 146
Locations of the field borders associated with these linear landforms are presented in Figure 2. 147
The lynchet L1 and undulations U1 and U2 are oriented perpendicularly to the steepest slope 148
and separated by mostly regular hillslope sections in the study area (Chartin et al., 2011). 149
Lynchet landforms, also known as terraces, soil banks, or locally as ―rideaux‖ in 150
northern France and Belgium, are predominantly shaped by the progressive accumulation of 151
soil material upslope of a field border (Bollinne, 1971; Papendick and Miller, 1977; Van Dijk 152
et al., 2005; Salvador-Blanes et al., 2006; Follain et al., 2007). A lynchet is defined by two 153
morphological components separated by a field border, i.e., the axis (Fig. 3a). Uphill, 154
progressive slope gentling from up- to downslope shapes a wide concave area (from 15 to 155
30m width in this region). Downhill, there is a break-in-slope that in this specific case, is 2 to 156
5 m-wide and reaches more than 2 m height creating a sharp discontinuity in the landscape. 157
The soil accumulation in a lynchet evolves as a pseudo right-angle triangle (Fig. 3c). 158
An undulation consists of a wide gentle central convexity gradually connected by 159
slight external concavities to the general hillslope morphology (Fig. 3b). The top of the 160
convexity - considered as its axis - coincides closely with a former field border (Houben, 161
2008; Chartin et al., 2011). Undulation landforms correspond to a more or less thickened soil 162
with a lenticular convex shape (Fig. 3d). 163
164
2.2. Topographical data
165
A 2 m resolution raster DEM was built from LIDAR data with the following method. Raw, 166
tiled LIDAR datasets for the study area were assembled. Only the datasets identified as 167
ground floor points were kept for this study (vegetation and infrastructure top points were not 168
considered). The 2 m cells covering the area contained from 0 to 247 LIDAR points with 169
different Z values. The median Z value was attributed to each cell centroid for cells with 170
points whereas centroids for cells without points where deleted. Only elevation points of each 171
cell belonging to the same landuse as the controid were used to calculate this median value. 172
This prevents from an artificial smoothing of sharp topographic discontinuities such as 173
lynchet borders. A triangular irregular network (TIN) was then built from the remaining 174
centroids. The TIN was then interpolated to a 2 m resolution raster. The elevation raster was 175
finally filtered on a plot by plot basis depending on the land use. 176 177 2.3. 137Cs analysis 178 2.3.1. Field sampling 179
Sixty-eight soil cores were sampled in the field in 2009 for 137Cs activity analysis. 180
Thirteen cores were collectedalong each of the five transects parallel to the steepest slope and 181
referred to as I to V in Figure 4a to cover the entire range of topographic settings observed in 182
the area. Sample lines 1 and 2 are located in the concavity of lynchet L1; sample lines 5 and 9 183
are located along the axis of undulations U1 and U2, respectively, e.g. in their central 184
convexities; lines 4, 6, 8 and 10 are located in the external concavities of the latter undulations; 185
and, finally, sample lines 3, 7, 11, 12 and 13 are located in areas characterised by more or less 186
regular slopes. Three additional cores (IV-1a, IV-1b and IV-1c on Figure 4b) were sampled 187
along transect IV to detail the effect of the present field border on the recent soil redistribution 188
over a short distance in lynchet L1 (Fig. 4b). 189
Soil cores with 8 cm or 10 cm external diameter were collected with a percussion 190
drilling machine (Eijkelkamp) up to a soil depth of about 70 to 100 cm and immediately cut 191
into sections in the field. Depending on the local soil thickness, the first section corresponded 192
to the uppermost 20 to 40 cm of the core. Then, successive 10-cm sections were cut off until 193
the bedrock was reached. Two of the sixty-eight soil cores (sample points IV-1a and V-8 194
highlighted in Fig. 4) were cut into 5-cm sections to detail the vertical distribution of 137Cs at 195
particular locations. The V-8 soil core was collected on the downslope external concavity of 196
undulation U2, e.g. just downslope of a former field border that was removed in 1967. Core 197
IV-1a was sampled on the gentle slope of L1 lynchet, 3 m upslope of the present lower field-198
border. Each section of the 68 cores was oven-dried for 48 h at 40 °C, sieved to 8-mm. Soil in 199
the study area contains large quantities of coarser grains and chalk fragments. Attention was 200
paid to collect the fine particle fraction deposited on the surface of those coarser grains. The 201
<8mm fraction was ground to a fine powder. For each sample, a representative subsample of 202
the <8mm fraction (approx.. 70 g) was then collected to measure 137Cs activities. 203
204
2.3.2. Measuring 137Cs activities
205
137
Cs in the soil cores was measured at 661 keV using low background Germanium 206
gamma-ray detectors (Germanium hyperpure – GeHP, N-type, coaxial model) for 24 to 48 h. 207
An initial qualitative assessment was performed on successive subsamples of each core to 208
determine the maximum depth of the 137Cs signal. The 137Cs activity (Ai in Bq.kg−1) was then 209
derived for each core section. Finally, the 137Cs total inventory (Asurf ; Bq.m−2) of each core 210
was calculated according to Eq. (1) (Sutherland, 1992). 211
n i i i surf S M A A 1 (1), 212where Ai is the 137Cs activity in the successive sections of the core (Bq.kg−1); Mi is the mass 213
(kg) of the <8 mm soil fraction of the ith sampled section; S is the surface area (m2) of the soil 214
core cylinder, n the total number of sampled sections sections of the core. 215
To estimate whether soil erosion or deposition occurred in the investigated field since 216
the beginning of 137Cs fallout (1954), 137Cs inventories were compared to the local reference 217
inventory. This latter was the mean inventory obtained in four cores sampled in neighbouring 218
undisturbed sites such as orchards and pastures. Then, 137Cs residuals were calculated 219
according to Eq. (2): 220
, , ,
res x surf x surf ref
Cs A A (2),
221
where Csres,x are the 137Cs residuals at the x core location (Bq.m−2), Asurf,x is the 137Cs total 222
inventory at the the x core location (Bq.m−2), and Asurf,ref is the Cs reference inventory 223
(Bq.m−2). 224
Negative residuals mean that the concerned location has underwent net soil erosion since 225
1954, whereas positive residuals indicate the occurrence of net soil deposition. 226
227
2.4 Converting 137Cs activities into erosion-deposition rates
228
2.4.1. Conversion model description
229
We used a spatially explicit model to convert 137Cs residuals into soil erosion and 230
deposition rates (Mg.ha-1.yr-1 or mm.yr-1). The model consists in a combination of a punctual 231
mass-balance model and a spatially distributed and process-based model of water and erosion 232
tillage processes (Van Oost et al, 2003). The mass-balance model includes both the annual 233
fallouts and susceptible losses of 137Cs due to runoff (before its incorporation within the tilled 234
layer) during the whole period of the radionuclide fallout (Quine, 1995). The conversion 235
model exploits the different patterns of water and tillage erosion in a spatial analysis of 137Cs 236
inventories to assess the relative contribution of water and tillage erosion processes. 237
The water-induced processes of soil erosion (rill and interrill erosion) are defined as a 238
power function of slope gradient and contributing area, following Eqs. (3) and (4): 239 1 a b rill b E k S A , (3) 240 d irill b E c S , (4) 241
where Erill and Eirll are rill and interrill potentials, respectively (kg.m-2), ρb is the dry bulk 242
density of the soil (kg.m-3), S is the slope (m.m-1), A is the contributing area per unit contour 243
width (m2.m-1), and k1, a, b, c and d are coefficients (-). 244
The local rate of soil erosion is then calculated as the summation of both potentials for rill and 245
interrill erosion unless the local transport capacity is exceeded. The transport capacity on a 246
given slope segment is then considered as being proportional to the potential for rill erosion 247
(e.g., Desmet and Govers, 1995), Eq. (5): 248
2
c rill
T k E , (5) 249
where Tc is the transport capacity (kg.m-1) and k2 is a coefficient (m). 250
When local sediment inflow exceeds the transport capacity Tc, deposition occurs. The amount 251
of soil translocated is then equal to Tc. 252
The net soil flux induced by tillage translocation on a hilllsope of infinitesimal length 253
and unit width is considered as proportional to the local slope gradient (Govers et al., 1994; 254
Van Oost et al., 2000), Eq. (6): 255 3 3 t dh Q k S k dx , (6) 256
where Qt represents the net downslope flux due to tillage (kg.m-1.a-1), k3 is the tillage transport 257
coefficient (kg.m-1.a-1), S is the local slope gradient (m.m-1), h is the height at a given point of 258
the hillslope (m), and x is the horizontal distance (m). 259
The local intensity of tillage-induced erosion (Et in kg.m-2) is then modelled as a diffusive 260
process controlled by slope gradient changes, according to Eq. (7): 261 2 2 t t b dQ dh d h E dt dx d t , (7) 262
where t is the time (s). 263
Finally, field borders were considered as lines of zero flux. This means that no soil material is 264
translocated from one field to another during tillage. 265
266
2.4.2. Conversion model application
267
The simulation process is iterative, and each iteration corresponds to one year. Annual 268
137
Cs fallouts used in the model were based on the measured annual fallout for the northern 269
hemisphere (Cambrai et al., 1989). This value was rescaled to the local reference inventory 270
using the factor α (-), Eq. (8): 271 , , surf ref surf NH A A , (8) 272
where Asurf,ref is the Cs reference inventory (Bq.m−2) for the study area and Asurf,NH is the mean 273
Cs reference inventory (Bq.m−2) for the northern hemisphere. 274
137
Cs fallouts associated with the Chernobyl accident were reported to be negligible in the 275
study area and were therefore not considered in Cs reference inventories of Eq. (8) (Fourmont, 276
2001). 277
The parameter values proposed by Quine (1997) were used for the punctual mass-278
balance model. No a-priori assumptions were made about rates of water and tillage erosion. A 279
specific procedure developed by Van Oost et al. (2003) and based on the Generalized 280
Likelihood Uncertainty Estimation (Beven and Binley, 1992) was implemented to explore the 281
parameter space for which the model was in close agreement with the observed 137Cs 282
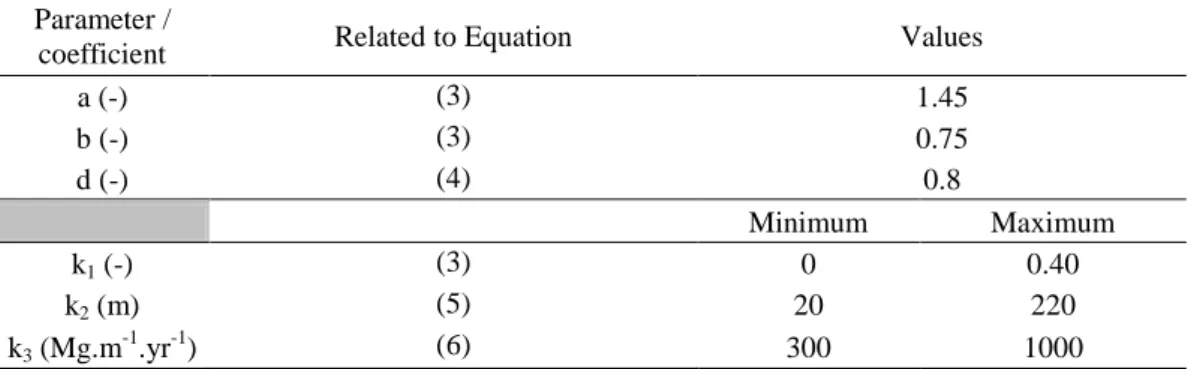
inventories. Value ranges for parameters k1, k2 and k3 (Eqs. 2, 4 and 5) used in this procedure 283
are presented in Table 1. Coefficients a, b and d (Eqs. 2 and 3) were based on studies carried 284
out by Desmet and Govers (1995, 1997), Van Oost et al (2000) and Van Rompaey et al. 285
(2001). 286
The conversion model was applied to compare simulated and observed 137Cs patterns 287
for 3000 randomly choosen parameter sets k1, k2 and k3over the whole study area. The 288
observational dataset used in the evaluation procedure, called ―total set‖, contains 67 289
sampling points: the point IV-1b was excluded as it is located just 1 m from point IV-1a. 290
Likelihood values for each set of parameters were determined and associated with the 291
corresponding model output values (Van Oost et al., 2003). The cumulative likelihood 292
distribution of water and tillage erosion rates was then defined separately for the whole study 293
area. From these cumulative distributions, median (M), 5th (P5) and 95th (P95) percentile 294
values were calculated to provide a quantification of model uncertainty. 295
296
3. Results and discussion
3.1. Recent soil redistribution patterns and relations with topographical settings
298
The observed 137Cs reference inventory was 1367 ± 30 Bq.m-2 in 2009 in Seuilly (Fig. 299
5a). About 40% and 65% of the total 137Cs inventory was concentrated in the uppermost 5 cm 300
and 10 cm, respectively. As observed at many other undisturbed locations, the 137Cs content 301
declined almost exponentially with soil depth in these profiles (Walling and Quine, 1992). 302
The 137Csresiduals (Eq. 2) ranged from -1030 Bq.m-2 to 980 Bq.m-2 in the 68 analysed 303
cores. The largest variations were observed along the steepest slope direction (NNW-SSE) 304
and were strongly affected by anthropogenic undulations U1, U2, and lynchet L1 (Fig. 6). 305
About 50% of the 137Cs contained in the soil at the time of sampling (2009) originates from 306
the period between1962 and 1964. Consequently, currently observed patterns mostly reflected 307
the soil redistribution that occurred after the 1967 land consolidation, when field borders 308
associated with undulations U1 and U2 were removed (Fig. 2). 309
The 137Cs residuals measured on undulation central convexities (sample lines 5 and 9) 310
ranged from -320 Bq.m-2 to 20 Bq.m-2 and were mostly negative, whereas residuals measured 311
on undulation external concavities (sample lines 4, 6, 8 and 10) ranged from 30 Bq.m-2 to 312
more than 730 Bq.m-2. These results reflected the progressive levelling of the undulation 313
landforms since the last land consolidation. These patterns of 137Cs residuals were then most 314
likely induced by redistribution through tillage practice such as it leads to soil erosion in 315
convexities and soil accumulation in concavities (Govers et al., 1994; 1996; De Alba et al., 316
2004). The profile V-8 provided an example of 137Cs vertical distribution in an undulation 317
external concavity, i.e. in a depositional context (Asurf,= 1786 Bq.m-2;Fig. 5b). The 137Cs 318
vertical distribution was homogeneous in the uppermost 30 cm and then declined rapidly in 319
the next five centimetres, reflecting the mixing induced by tillage operations (Kachanovski 320
and de Jong, 1984; Ritchie and McCarty, 2003). As undulation landforms initially correspond 321
to local soil accumulation induced by former field borders, their morphology in 2009 322
potentially derived from the levelling of two other types of anthropogenic landforms 323
consecutive to the field border removal: i) the undulations are former lynchets as suggested by 324
Bollinne (1971) and Houben (2008); ii) undulations are headlands created by an asymmetric 325
accumulation of soil due to tillage translocation on both sides of the borders (Callot, 1980; 326
Leturcq, 2008). In both cases, the morphology corresponding to current undulations in the 327
vicinity of the former field borders shows a strong evolution. 328
The 137Cs residuals ranged from 420 to 560 Bq.m-2 16 m upslope of the lynchet L1 329
field border (sample line 2). This area is characterised by a particularly gentle slope that is 330
clearly concave. In contrast, four of the five cores collected 2m upslope of same border 331
(sample line 1) showed negative residuals ranging from -1000 Bq.m-2 to -250 Bq.m-2 (Fig.6). 332
Fig. 7 shows that lynchet L1 (sample lines 1 and 2) was characterised by a large variability of 333
137
Cs residuals revealing the occurrence of both erosion and deposition processes. It has 334
nevertheless mostly undergone soil accumulation since 1967. Indeed, 137Cs residuals ranged 335
from -426 Bq.m-2 to 946 Bq.m-2, with negative values exclusively concentrated within the 336
first 4m upslope the field border. Even though lynchets are typically developed by the 337
progressive accumulation of soil upslope of a field border, our results reflected that soil 338
erosion occurred along this downfield border during the period 1954-2009. This complex 339
behaviour could be due to specific tillage practices performed along the field border. Farmers 340
systematically end up their tillage operations by contouring the field, i.e. perpendicularly to 341
the main up- and downslope tillage direction in the case of the upslope and downslope field 342
borders. This operation with the mouldboard plough results in the translocation of soil to the 343
inside of the field. This process could explain the slight local convexity observed in the first 344
meters of the field along the lower field border (Fig. 7). Considering this short-distance 345
variability, sampling schemes have to be carefully designed to describe in an appropriate way 346
the major soil redistribution processes (erosion or deposition) occurring in landforms 347
associated with field borders. 348
A depositional context was also observed 10 m downslope of the current upslope field 349
border (137Cs residuals varied from 475 Bq.m-2 to 800 Bq.m-2 along the sampling line 13; Fig. 350
5). Indeed, soil is thicker at this location than in surrounding areas with a depth locally up to 351
80 cm (Chartin, 2011). Moreover, the local slope is convex in the direction of the steepest 352
slope. Here again, tillage practices performed along this field border could explain the local 353
soil accumulation and the topographical convex settings. Unfortunately, sampling density was 354
not sufficient to check the relevance of this hypothesis in this specific study case. 355
Finally, spatial patterns of 137Cs residuals in undifferentiated areas are rather complex 356
and do not seem to be directly influenced by slope gradient nor curvature (Fig. 6). 357
358
3.2.Modelling erosion and deposition rates from 1954 to 2009
359
3.2.1. Conversion results
360
The factor α used to determine mean annual 137Cs fallouts in this area was 0.786 361
(Eq. 7). Fig. 8 presents the simulated optimal 137Cs inventories, tillage and water erosion 362
simulated by the model over the whole study area. 363
The major observed patterns of 137Cs inventories related to lynchets and undulations 364
were reproduced by the simulations. Convex landforms were characterised by soils with low 365
137
Cs inventories when compared to the higher inventories simulated on concave landforms 366
(Fig. 8a). Tillage was found to be the dominant process controlling 137Cs patterns since the 367
1967 land consolidation. Tillage erosion rates were often higher than 6 Mg.ha-1.yr-1 and 368
reached locally up to 15 Mg.ha-1.yr-1 in central convex parts of U1and U2 (Fig.8b). Soil 369
accumulation by tillage observed in external concave areas of undulations and over the whole 370
area of lynchet L1 seemed to be correctly reproduced with a maximum deposition rate 371
reaching 22 Mg.ha-1.yr-1. Water erosion output patterns were also greatly influenced by 372
undulation and lynchet landforms (Fig. 8c). U1 and U2 subdivided the study field in three 373
areas characterised by similar patterns of simulated water erosion. In each area, erosion of soil 374
material was simulated over most of the upslope part whereas deposition was simulated in the 375
concave depositional settings located downslope of the area. Maximum soil erosion and 376
deposition rates by water were simulated in the lower area, i.e. between U1 and L1, where the 377
general slope is the steepest. Here, erosion rates reached 0.6 Mg.ha-1.yr-1 within the U1 378
external concavity and net deposition reached 5 Mg.ha-1.yr-1 within L1 concavity. 379
Simulated tillage erosion was an order of magnitude higher than water erosion in both 380
erosional and depositional areas (e.g., the median water erosion rates was -0.20 Mg.ha-1.yr-1 381
whereas the median tillage erosion rate was -4.50 Mg.ha-1.yr-1; Tab. 2). The mean tillage 382
erosion rate over the whole study area was three to four times lower than the maximum 383
erosion rates simulated in undulations (Tab. 2; Fig. 8b). Considering the mean tillage 384
deposition rate over the whole study area, it was more than four times lower than maximum 385
deposition rates simulated within the lynchet L1 (Tab. 2; Fig. 8b). The uncertainty associated 386
with simulated water erosion and deposition was much higher than the one associated with 387
tillage simulation. This could be explained by the dominance of tillage erosion process (Tab. 388
2). Moreover, deposition rates and patterns of water erosion are largely controlled by k2 389
whereas tillage process simulations are characterised by soil redistribution patterns that 390
remained stable for the entire range of the tested k3 values (Van Oost et al., 2003). 391
The model runs confirmed our observations: soil redistribution by tillage is dominant 392
in the area since 1967. Tillage redistributes sediment in fields whereas water exports it from 393
fields. In this context, we estimated here that 98.5 % of the total eroded soil was deposited in 394
the study field, whereas only 1.5% was exported by water erosion. This result was in 395
agreement with previous findings obtained in the Parisian basin showing that land 396
consolidation generates a dramatic increase of soil redistribution within cultivated catchments, 397
and to a slight (Evrard et al., 2010; Delmas et al., 2012) or a large increase (Boardman et al., 398
1994; Evrard et al., 2008) of sediment exports from the catchment, depending on the 399
catchment topography, land use characteristics and the implementation of soil conservation 400
measures. As soon as mechanization appeared in the 1950s, land consolidation campaigns 401
favoured its introduction across the world and, inversely, mechanization motivated the 402
implementation of land consolidation operations (Van Huylenbroeck et al., 1996; Crecente et 403
al., 2002; Niroula and Thapa, 2005). However, mechanized agriculture involved higher tillage 404
erosion rates when compared to previous non-mechanized tillage (Govers et al., 1996; Van 405
Oost et al., 2000, 2006). Land consolidation enhances hydrological and sedimentological 406
connectivity and leads to important increases of sediment exports in regions particularly 407
sensitive to water erosion (Evrard et al., 2007b). However, this increase is not observed when 408
tillage largely dominates soil redistribution. Moreover, soils developed on Cretaceous chalks 409
appear not to be particularly sensitive to water erosion, thereby limiting the hydrological and 410
sedimentological connectivity (Boutin et al., 1990). 411
Our results explicitly identified hotspot areas of soil erosion induced by land 412
consolidation, i.e., in the vicinity of removed field borders, and hotspot areas of soil 413
deposition, i.e. in the vicinity of present field borders and external concavities of undulations. 414
We thereby show that land consolidation led progressively to the general levelling of the 415
hillslope morphology. This was particularly true when considering the convex undulations. 416
From sinks for soil material before land consolidation, the corresponding areas progressively 417
became sources for soil material redistribution. 418
419
3.2.2. Analysis of the discrepancies 420
Even though the conversion model reproduced the major trends of soil erosion and 421
deposition recorded in the study field, observed and simulated 137Cs inventories fitted rather 422
poorly (r² = 0.20, p < 0.05; Fig. 9). Indeed, the model tended to systematically underestimate 423
inventories in depositional settings and to overestimate inventories in highly erosive areas. 424
Simulated 137Cs inventories along the linear landforms were more or less 425
underestimated (from -150 to -750 Bq.m-2) on observed depositional settings associated with 426
lynchet L1 and undulations U1 and U2, i.e. on concave parts (lines 2, 4, 6, 8 and 10; Fig. 10a). 427
However, most of these locations were simulated as being in a depositional context (Fig. 10b). 428
Similarly, central convexities located on undulations were simulated as eroded areas. The 429
largest under-estimations (< -600 Bq.m-2) were concentrated along the upslope field border 430
(Fig. 10a). In this case, observed depositional locations were simulated as eroded sites (Fig. 431
10b). Although deposition is simulated within a few-meter width area along this upslope 432
border (Fig. 8a), actual deposition occurring ten meters downslope of this border (along the 433
sample line 13) was not well reproduced by the model. The largest over-estimations were 434
concentrated along the downslope field-border (sample line 1 on lynchet L1) where 435
simulation errors reached up to 1000 Bq.m-2. As mentioned before, we infer that specific 436
tillage operations performed along the upper and lower field borders could have induced 437
processes differing from the classical diffusive process associated with ―infield‖ operations 438
and considered as the only tillage-induced process in the conversion model The mechanisms 439
of those specific processes could therefore be implemented to improve the model efficiency. 440
Furthermore, sampling could be intensified in the vicinity of the current field borders in order 441
to describe more accurately their impact on local variations of soil redistribution. 442
We therefore ran the model with a dataset (subsequently referred to as the ―infield set‖) 443
excluding points sampled at the vicinity of upslope and downslope field borders, i.e. sampling 444
points IV-1a, IV-1b and those located along lines 1 and 13 (n = 55). Observed and simulated 445
inventories fitted much better when using the ―infield set‖ (r² = 0.42; p < 0.05; Fig. 11) than 446
when using the ―total set‖ (r² = 0.20), but discrepancies remained. 447
Both simulations outlined that tillage-induced processes were the driving factor 448
explaining more than 95 % of the total soil redistribution that occurred after the 1967 land 449
consolidation (Table 3). We demonstrated that tillage practices levelled the field morphology, 450
and we can then hypothesise that local curvatures derived from the DEM based on the 2009 451
LIDAR data were smoothened compared to those existing in 1967. Consequently, tillage 452
erosion and deposition rates simulated for the period 1954-2009 remained necessarily under-453
estimated when considering curvatures as the morphological parameter controlling the 454
intensity of soil translocation by this diffusive process. The more the landscape morphology 455
would have evolved since 137Cs fallouts, the less the conversion of 137Cs inventories into soil 456
redistribution rates would be accurate. This should be taken into account when using the 137Cs 457
method to validate the parameterization of erosion models dedicated to the prediction of 458
medium-term erosion (from decades to centuries). 459
460
4. Conclusions
461
This study focused on the impact of land consolidation and field borders on medium 462
term soil erosion (1954-2009) and landscape morphology within a 3.7-ha field consolidated in 463
1967. The spatial patterns of 137Cs inventories were analyzed and a spatially-distributed 464
conversion model simulating the respective implication of water and tillage erosion was 465
applied. The model simulated tillage erosion as the most dominant process across the study 466
area, by generating 95% of soil redistribution movements (i.e., about 4.50 Mg.ha-1.yr-1) and 467
deeply modifying the landscape morphology. Hence, soil redistribution was greatly affected 468
by the presence of current but also former field borders, where hotspots areas of erosion (on 469
undulations) and deposition (on lynchets; i.e., about 20 Mg.ha-1.yr-1) are identified. Land 470
consolidation contributed to the acceleration of soil redistribution within the field through the 471
conversion of depositional areas into sediment delivering areas. The conversion model 472
reproduced the main patterns of 137Cs inventories, but simulated inventories fitted rather 473
poorly with these latters (r² = 0.20). Discrepancies were identified and associated with 474
sampling points located along the current field borders where tillage is performed 475
perpendicularly to the main tillage direction in the field. This tillage operation is observed in 476
most cultivated plots and corresponds to a contouring of the field when finishing a tillage 477
operation. This particular tillage operation could be taken into account in a future version of 478
the model to accurately simulate rates and patterns of past soil redistribution in fragmented 479
cultivated hillslopes. An other outcome of this specific process is that 137Cs sampling schemes 480
have to be carefully designed to describe in an appropriate way the major soil redistribution 481
processes occurring in landforms associated with field borders. We also suggest that the use 482
of an accurate DEM representing the actual topography in the model leads to the 483
underestimation of soil redistribution rates, especially in this landscape where morphology 484
was submitted to recent and significant changes. These results have important implications for 485
the modelling of tillage erosion and to better quantify and determine the spatial patterns of 486
soil redistribution processes across cultivated areas in a changing environment. This is of 487
particular interest to improve our knowledge and prediction of patterns of soil physical 488
parameters, as carbon storage or water content, particularly sensitive to surface erosion and 489 landscape structuration. 490 491 Acknowledgements 492
This project was funded by ANR (Agence Nationale de la Recherche) in the framework of the 493
LANDSOIL project (ANR-08-VULN-006). The authors would like to gratefully thank Jean-494
Paul Bakyono and Isabel Pene-Galland for their role on field data collection and sample 495
preparation. This paper was much improved thanks to the comments of two anonymous 496
referees. This is LSCE contribution no. X. 497
498
References
499 500
Andraski, B.J. and Lowery, B., 1992. Erosion Effects on Soil Water Storage, Plant Water 501
Uptake, and Corn Growth. Soil Science Society of America Journal 56(6), 1911-1919. 502
503
Baudry, J., Burel, F., 1984. "Remembrement": Landscape consolidation in France. Landscape 504
Planning 11, 235-241. 505
506
Boardman, J., Poesen, J., 2006. Soil erosion in Europe: major processes, causes and 507
consequences. In: J. Boardman and J. Poesen (Editors), Soil erosion in Europe. Wiley, 508
Chicester, pp. 479-489. 509
510
Berger, G., Kaechele, H. and Pfeffer, H., 2006. The greening of the European common 511
agricultural policy by linking the European-wide obligation of set-aside with voluntary agri-512
environmental measures on a regional scale. Environmental Science & Policy 9(6), 509-524. 513
514
Beven, K. and Binley, A., 1992. The Future Of Distributed Models – Model Calibration And 515
Uncertainty Prediction. Hydrological Processes 6(3), 279-298. 516
517
Boardman, J., Ligneau, L., de Roo, A., Vandaele, K., 1994. Flooding of property by runoff 518
from agricultural land in northwestern Europe. Geomorphology 10, 183-196. 519
520
Bollinne, A., 1971. Les rideaux en Hesbaye gembloutoise - Etude morphologique et 521
sédimentologique. Bulletin de la Société géographique de Liège 7, 61-67. 522
523
Boutin, D., Froger, D., Rassineux, J., 1990. Feuille Loudun (1724-1624), Carte des sols du 524
Département de la Vienne et de la région Centre au 1:50000, Chambre d'Agriculture de la 525
Vienne - IGN - INRA. 526
527
Callot, H.J., 1980. La plaine d'Alsace. Modelé agraire et parcellaire. Université de Nancy II, 528
France. 529
530
Cambrai, R.S., Playford, K., Carpenter, R.C., 1989. Radioactive fallout in air and rain: results 531
to the end of 1988. UK Atomic Energy Authority Report AERE-R 10155, HMSO. 532
533
Caubel, V., Grimaldi, C., Merot, P., Grimaldi, M., 2003. Influence of a hedge surrounding 534
bottomland on seasonal soil-water movement. Hydrological Processes 17, 1811-1821. 535
536
Chaplot, V., Le Bissonnais, Y., 2003. Runoff features for interrill erosion at different rainfall 537
intensities, slope lenghts, and gradients in agricultural loessial hillslope. Soil Science Society 538
of America Journal 67(3), 844-851. 539
Chartin, C., 2011. Effet de l’évolution du parcellaire agricole sur la redistribution des sols et 541
la morphologie des versants cultivés – exemple du Bassin parisien. Université de Tours, 542
France, 322 pp. 543
544
Crecente, R., Alvarez, C., Fra, U. 2002. Economic, social and environmental impact of land 545
consolidation in Galicia. Land Use Policy (19), 135-147. 546
547
Chartin, C., Bourennane H., Salvador-Blanes, S., Hinschberger, F., Macaire, J.-J., 2011. 548
Classification and mapping of anthropogenic landforms on cultivated hillslopes using DEMs 549
and soil thickness data — Example from the SW Parisian Basin, France. Geomorphology 135, 550
8-20. 551
552
Dabney, S.M., Liu, Z., Lane, M., Douglas, J., Zhu, J., Flanagan, D.C., 1999. Landscape 553
benching from tillage erosion between grass hedges. Soil & Tillage Research 51, 219-231. 554
555
De Alba, S., 2003. Simulating long-term soil redistribution generated by different patterns of 556
mouldboard ploughing in landscapes of complex topography. Soil and Tillage Research 71, 557
71–86. 558
559
De Alba, S., Lindstrom, M.J., Schumacher, T.E., Malo, D.D., 2004. Soil landscape evolution 560
due to soil redistribution by tillage: new model of soil catena evolution in agricultural 561
landscapes. Catena 58, 77-100. 562
563
Delmas, M., Pak, L.T., Cerdan, O., Souchère,V., Le Bissonnais, Y., Couturier, A, Sore, L., 564
2012. Erosion and sediment budget across scale: A case study in a catchment of the European 565
loess belt. Journal of Hydrology 420, 255-263. 566
567
Desmet, P.J.J., Govers, G., 1995. GIS-based simulation of erosion and deposition patterns in 568
an agricultural landscape: a comparison of model results with soil map information. Catena 25, 569
389-401. 570
571
Desmet, P.J.J., Govers, G., 1997. Two-dimensional modelling of the within-field variation in 572
rill and gully geometry and location related to topography. Catena 29, 283-306. 573
574
Evrard, O., Bielders, C.L., Vandaele, K., Van Wesemael, B., 2007a. Spatial and temporal 575
variation of muddy floods in central Belgium, off-site impacts and potential control measures. 576
Catena 70, 443-454. 577
578
Evrard, O., Persoons, E., Vandaele, K., van Wesemael, B., 2007b. Effectiveness of erosion 579
mitigation measures to prevent muddy floods: A case study in the Belgian loam belt. 580
Agriculture, Ecosystems & Environment 118, 149-158. 581
582
Evrard, O., Vandaele, K., van Wesemael, B., Bielders, C.L, 2008. A grassed waterway and 583
earthen dams to control muddy floods from a cultivated catchment of the Belgian loess belt. 584
Geomorphology 100, 419-428. 585
586
Evrard, O., Nord, G., Cerdan, O., Souchère, V., Le Bissonnais, Y., Bonté, P., 2010. Modelling 587
the impact of land use change and rainfall seasonality on sediment export from an agricultural 588
catchment of the northwestern European loess belt. Agriculture, ecosystems and environment 589
138, 83-94. 590
591
FAO, 1998. World reference base for soil resources. Food and Agriculture Organization of 592
the United Nations. World Soil Resources Report No 84, FAO, Rome. 593
594
Follain, S., Minasny, B., McBratney, A.B., Walter, C., 2006. Simulation of soil thickness 595
evolution in a complex agricultural landscape at fine spatial and temporal scales. Geoderma 596
133, 71-86. 597
598
Forman, R.T.T., Alexander, L.E., 1998. Roads and major ecological effects. Annual Review 599
of Ecology and Systematics 29, 207-231. 600
601
Foster, G.R., 1986. Understanding ephemeral gully erosion. In: B.i.A. National Research 602
Council (Editor), Soil conservation: Assesing the national research inventory. National 603
Academy Press, Washington, pp. 90-118. 604
605
Fourmont, A., 2001. Analyse de l'évolution subactuelle des banquettes colluviales 606
anthropiques par la méthode du Césium-137. Influence sur le bilan sédimentaire du bassin du 607
Quincampoix (Sud-ouest du Bassin Parisien, France), Rapport de stage de DEA, Université 608
de Tours, France, pp. 40. 609
610
Govers, G., Lobb, D.A., Quine, T.A., 1999. Tillage erosion and translocation: emergence of a 611
new paradigm in soil erosion research. Soil & Tillage Research 51, 167-174. 612
613
Govers, G., Quine, T.A., Desmet, P.J.J., Walling, D.E., 1996. The relative contribution of soil 614
tillage and overland flow erosion to soil redistribution on agricultural land. Earth Surface 615
Processes and Landforms 21, 929-946. 616
617
Govers, G., Vandaele, K., Desmet, P.J.J., Poesen, J., Bunte, K., 1994. The role of tillage in 618
soil redistribution on hillslopes. European Journal of Soil Science 45, 469-478. 619
620
Hooke, D., 1988. Cosmogenic nuclides, topography, and the spatial variation of soil depth. 621
Geografiska Annaler 70 B(1), 123-131. 622
623
Houben, P., 2008. Scale linkage and contingency effects of field-scale and hillslope-scale 624
controls of long-term soil erosion: anthropogeomorphic sediment flux in agricultural loess 625
watersheds of Southern Germany. Geomorphology 101, 172-191. 626
627
Kachanovski, R. G., de Jong, E., 1984. Predicting the temporal relationship between soil 628
Cesium-137 and erosion rate. Journal of Environmental Quality 13(2), 301-304. 629
630
Knapen, A., Poesen, J., Govers, G., De Baets, S., 2008. The effect of conservation tillage on 631
runoff erosivity and soil erodibility during concentrated flow. Hydrological Processes 22, 632
1497-1508. 633
634
Leturcq, S., 2008. Fonction et devenir d'un réseau invisible: les crêtes de labour dans les 635
terroirs beaucerons (XIVe-XXe siècles), COST du Mans. Marqueurs des paysages et 636
systèmes socio-économiques. R.Compatangelo-Soussignan, J.R.Bertrand, J.Chapman, P.Y. 637
Laffont, Rennes (France), pp. 163-174. 638
Lindstrom, M.J., Nelson, W.W., Schumacher, T.E., 1992. Quantifying tillage erosion rates 640
due to moldbard plowing. Soil & Tillage Research 24, 243-255. 641
642
Lindstrom, M.J., Nelson, W.W., Schumacher, T.E., Lemme, G.D., 1990. Soil movement by 643
tillage as affected by slope. Soil & Tillage Research 17, 255-264. 644
645
Montgomery, J.A., McCool, D.K., Busacca, A.J., Frazier, B.E., 1999. Quantifying tillage 646
translocation and deposition rates due to moldboard plowing in the Palouse region of the 647
Pacific Northwest, USA. Soil & Tillage Research 51, 175-187. 648
649
Niroula,, G.S., Thapa, G.B. 2005. Impacts and causes of land fragmentation, and lessons 650
learned from land consolidation in South Asia. Land use Policy 22, 358-372. 651
652
Papendick, R.I., Miller, D.E., 1977. Conservation tillage in Pacific Northwest. Journal of Soil 653
and Water Conservation 32, 49-56. 654
655
Papiernick, S.K., Schumacher, T.E., Lobb, D.A., Lindstrom, M.J., Lieser, M.L., Eynard, A., 656
Schumacher, J.A., 2009. Soil properties and productivity as affected by topsoil movement 657
within an eroded landform. Soil & Tillage Research 102, 67-77. 658
659
Pimentel, D., Harvey, C., Resosudarmo, P., Sinclair, K., Kurz, D., McNair, M., Crist, S., 660
Shpritz, L., Fitton, L., Saffouri, R., Blair, R. 1995. Environmental and economic costs of soil 661
erosion and conservation benefits. Science 267(5201), 1117-1123. 662
663
Poesen, J., 1984. The influence of slope gradient on infiltration rate and Hortonian overland 664
flow volume. Z. Geomorphol., N.F. Suppl.-Bd. 49, 117-131. 665
666
Quine, T.A., 1995. Estimation of erosion rates from caesium-137 data: the calibration 667
question. In: I.D.L. Webster, A.M. Gurnell and B.W. Webb (Editors), Sediment and Water 668
Quality in River Catchments. John Wiley & Sons, Chicester, pp. 307-329. 669
670
Quine, T.A., Govers, G., Walling, D.E., Zhang, X., Desmet, P., Zhang, Y., Vandaele, K., 671
1997. Erosion processes and landform evolution on agricultural land - new perspectives from 672
caesium-137 measurements and topographic-based erosion modelling. Earth Surface 673
Processes and Landforms 22, 799-816. 674
675
Ritchie, J.C., McCarty, G.W., 2003. Using 137Cesium to understand soil carbon redistribution 676
on agricultural watersheds. Soil and tillage Research 69, 45-51. 677
678
Ritchie, J.C., McHenry, J.R., 1990. Application of radioactive fallout Cesium-137 for 679
measuring soil erosion and sediment accumulation rates and patterns: a review. Journal of 680
Environmental Quality 19, 215-233. 681
682
Rogowski, A.S., Tamura, T., 1965. Movement of 137Cs by runoff, erosion and infiltration on 683
the alluvial Captina silt loam. Health Physics 11(12), 1333-1340. 684
685
Salvador-Blanes, S., Cornu, S., Couturier, A., King, D., Macaire, J.-J., 2006. Morphological 686
and geochemical properties of soil accumulated in hedge-induced terraces in the Massif 687
Central, France. Soil and Tillage Research 85, 62–77. 688
Sutherland, R.A., 1992. Caesium-137 estimates of erosion in agricultural areas. Hydrological 690
Processes 6, 215-225. 691
692
Szilassi, P., Jordan, G., Van Rompaey, A., Csillag, G., 2006. Impacts of historical land use 693
changes on erosion and agricultural soil properties in the Kali Basin at the Lake Balaton, 694
Hungary. Catena 68, 96-108. 695
696
Van Dijk, P.M., Auzet, A.-V., Lemmel, M., 2005. Rapid assessment of field erosion and 697
sediment transport pathways in cultivated catchments after heavy rainfall events. Earth 698
Surface Processes and Landforms 30(2), 169-182. 699
700
Van Dijk, P.M., Kwaad, F.J.P.M., Klapwijk, M., 1996. Retention of water and sediment by 701
grass strips. Hydrological Processes 10, 1069-1080. 702
703
Van Huylenbroeck, G., Castro Coelho, J., Pinto, P.A. 1996. Evaluation of Land Consolidation 704
Projects (LCPs): A Multidisciplinary Approach. Journal of Rural Studies 12(3), 297-310. 705
706
Van Muysen, W., Govers, G., Bergkamp, G., Roxo, M., Poesen, J., 1999. Measurement and 707
modelling of the effects of initial soil conditions and slope gradient on soil translocation by 708
tillage. Soil & Tillage Research 51, 303-316. 709
710
Van Oost, K., Govers, G., De Alba, S., Quine, T.A. 2006. Tillage erosion: a review of 711
controlling factors and implications for soil quality. Progress in Phiysical geography 30(4), 712
443-466. 713
714
Van Oost, K., Govers, G., Desmet, P.J.J., 2000. Evaluating the effects of changes in landscape 715
structure on soil erosion by water and tillage. Landscape Ecology 15, 577-589. 716
717
Van Oost, K., Govers, G., Van Muysen, W., 2003. A process-based model for Caesium-137 718
derived erosion rates on agricultural land: an integrated spatial approach. Earth Surface 719
Processes and Landforms 28, 187-207. 720
721
Van Rompaey, A.J.J., Verstraeten, G., Van Oost, K., Govers, G., Poesen, J., 2001. Modelling 722
mean annual sediment yield using a distributed approach. Earth Surface Processes and 723
Landforms 26(11), 1221-1236. 724
725
Vitikainen, A., 2004. An overview of land consolidation in Europe. Nordic Journal of 726
Surveying and Real Estate Research 1, 25-44. 727
728
Walling, D.E., Quine, T.A., 1992. The use of Caesium-137 measurements in soil erosion 729
surveys, Erosion and sediment transport monitoring programmes in river basins. IAHS, Oslo, 730
pp. 143-152. 731
732
Wemple, B.C., Jones, J.A., Grant, G.E., 1996. Channel network extension by logging roads in 733
two basins, Western Cascades, Oregon. Water Resources Bulletin 32, 1195-1207. 734
735
Zadora-Rio, E., 1991. Les terroirs médiévaux dans le Nord-Ouest de l'Europe, Pour une 736
Archéologie agraire. J. Guilaine, Paris, pp. 165-192. 737
Table 1. Values of parameters and coefficients input in the model application.
Parameter /
coefficient Related to Equation Values
a (-) (3) 1.45 b (-) (3) 0.75 d (-) (4) 0.8 Minimum Maximum k1 (-) (3) 0 0.40 k2 (m) (5) 20 220 k3 (Mg.m -1 .yr-1) (6) 300 1000
Table 2. Simulated soil redistribution rates for the whole study area for the period 1954-2009. P5 and P95 are the 5th and 95th percentile simulation limits, respectively, and M the median.
Mean erosion (Mg.ha-1.yr-1) Mean deposition (Mg.ha-1.yr-1)
P5 M P95 P5 M P95
Water -0.69 -0.20 -0.13 0.07 0.13 0.24
Tillage -4.55 -4.50 -4.46 4.47 4.50 4.55
Table 3. Results of the conversion model applications to “Total” and “Infield”datasets.
Dataset Elevation inputs R² Mean erosion (Mg.ha-1.yr-1) Mean deposition (Mg.ha-1.yr-1) Implication of Tillage (%) Total LIDAR 0.20 -4.70 4.63 ~ 98 Infield 0.42 -5.82 5.77 ~ 98 Table
Fig. 1. Location of the study area.
Fig. 2. Reconstruction of the field borders in 1945, 1959 and 2009.
Fig. 3. Geometrical characteristics of the two types of anthropogenic landforms, and the associated soils: (a) and (c) provide a picture and a cross-section of a lynchet; (b) and (d) provide a picture and a cross-section of an undulation.
Fig. 4. 137Cs sampling schemes. (a) Sampling in the whole study area. (b) Zoom on samples to give details on lynchet L1.
Fig. 5. Vertical distribution of 137Cs in: (a) mean reference profile of Seuilly, (b) profile V-8 and (c) profile IV-1a.
Fig. 6. 137Cs residuals measured in the study area with slope gradient contours.
Fig. 7. 137Cs residuals measured along a topographic cross-section within lynchet L1 (transect IV).
Fig. 8. Model outputs overlayed on an isometric projection of the study area topography: (a) simulated 137Cs inventories, (b) simulated soil redistribution rates by tillage erosion, and (c) simulated soil redistribution rates by water erosion.
Fig. 9. Median simulated 137Cs inventories plotted against observed 137Cs inventories. Black line is the 1:1 line and grey lines correspond to the 137Cs reference inventory (i.e., 1367 Bq.m-2).
Fig. 10. Spatial distribution of a) simulation errors and b) simulated 137Cs residuals in the study field.
Fig. 11. Median simulated 137Cs inventories, based on the “infield dataset”, plotted against observed 137Cs inventories. Black line is the 1:1 line and grey lines correspond to the 137Cs reference inventory (i.e., 1367 Bq.m-2).
Figure
Figure
(a) Lynchet axis = field border (b) Undulation axis Axis 10 m 1 m Slope gentling Break-in-slope 1 m 10 m Axis SOIL Central convexity External concavity External concavity SOIL (c) (d) Figure
Figure
Figure
Figure
Figure
Figure
Figure
Figure
Figure