HAL Id: insu-02311531
https://hal-insu.archives-ouvertes.fr/insu-02311531
Submitted on 26 Apr 2021
HAL is a multi-disciplinary open access
archive for the deposit and dissemination of
sci-entific research documents, whether they are
pub-lished or not. The documents may come from
teaching and research institutions in France or
abroad, or from public or private research centers.
L’archive ouverte pluridisciplinaire HAL, est
destinée au dépôt et à la diffusion de documents
scientifiques de niveau recherche, publiés ou non,
émanant des établissements d’enseignement et de
recherche français ou étrangers, des laboratoires
publics ou privés.
Sample Analysis at Mars in Gale crater
Arnaud Buch, Imène Belmahdi, Cyril Szopa, Caroline Freissinet, Daniel P.
Glavin, Maeva Millan, Roger Summons, David Coscia, Samuel Teinturier,
Jean-Yves Bonnet, et al.
To cite this version:
Arnaud Buch, Imène Belmahdi, Cyril Szopa, Caroline Freissinet, Daniel P. Glavin, et al.. Role of the
Tenax® adsorbent in the interpretation of the EGA and GC-MS analyses performed with the Sample
Analysis at Mars in Gale crater. Journal of Geophysical Research. Planets, Wiley-Blackwell, 2019,
124 (11), pp.2819-2851. �10.1029/2019JE005973�. �insu-02311531�
A. Buch1 , I. Belmahdi1, C. Szopa2,3, C. Freissinet2, D.P. Glavin4 , M. Millan4,5, R. Summons6 , D. Coscia2, S. Teinturier4, J.‐Y. Bonnet2, Y. He1, M. Cabane2, R. Navarro‐Gonzalez7 ,
C.A. Malespin4, J. Stern4 , J. Eigenbrode4 , P.R. Mahaffy4 , and S.S. Johnson5
1Laboratoire Génie des Procédés et Matériaux, CentraleSupelec, Gif‐sur‐Yvette, France,2LATMOS/IPSL, UVSQ Université
Paris‐Saclay, Sorbonne Université, CNRS, Guyancourt, France,3Institut Universitaire de France, Paris, France,4NASA Goddard Space Flight Center, Greenbelt, MD, USA,5Department of Biology, Georgtown University, Washington, DC,
USA,6IMT, Cambridge, MA, USA,7Instituto de Ciencias Nucleares, Universidad Nacional Autónoma de México, Circuito Exterior, Ciudad Universitaria, Ciudad de México, Mexico
Abstract
The Sample Analysis at Mars (SAM) experiment on the National Aeronautics and Space Administration Curiosity rover seeks evidence of organic compounds on the surface of Mars. Since the beginning of the mission, various organic molecules have been detected and identified. While several have been demonstrated to be indigenous to the Martian soil and rocks analyzed, others appear to have been produced from sources internal to the experiment. The objective of this study is to build an exhaustive molecular database to support the interpretation of SAM results by identifying all the chemical species produced from Tenax® adsorbents, by determining (1) the thermal degradation by‐products of Tenax®, (2) the effect of Tenax® conditioning on the formation of Tenax® by‐products, (3) the impact of MTBSTFA or a mixture of MTBSTFA and DMF on Tenax® decomposition, and (4) the reaction between Tenax® and calcium perchlorate. Our results indicate that the by‐products of the SAM trap are due to the impact of trap heating, the impact of the derivatization reagent (MTBSTFA) and the presence of perchlorate in Martian soil. Some of these by‐products are observed in the SAM gas chromatograph mass spectrometer data from Mars.Plain Language Summary
The Sample Analysis at Mars (SAM) experiment onboard the Curiosity Rover has a polymer‐based chemical trap (Tenax®) that concentrates the evolved species from the Martian samples. We studied the impact that this trap could have on the SAM results when heated, when exposed to the chemical compounds used for sample processing (derivatization) and when exposed to Martian perchlorates. We conclude by demonstrating that some of the organic compounds detected in the background signal of the SAM chromatograms likely came from the degradation of Tenax®. This study will help to discriminate the endogenous organic compounds detected on Mars by SAM fromthe contamination.
1. Introduction
1.1. The Quest for Organics on Mars
The search for organics on Mars is key in the distribution of the organic matter in the solar system, under-standing the emergence of life, and potentially discovering the presence of life on Mars. The Viking, Phoenix, and Mars Science Laboratory (MSL) missions have focused on these objectives. The Viking lander was the first successful spacecraft to reach the Martian surface in the summer of 1976. The gas chromatograph‐mass spectrometer (GC‐MS) experiment onboard was devoted to characterizing the organic material (OM) present in solid samples acquired by the lander (Biemann et al., 1976). It was capable of vola-tilizing or thermally degrading organic compounds from Martian soil samples by heating them up to 500 °C in dedicated ovens. The volatile molecules released from the samples were then analyzed by GC‐MS for detection and identification. The Viking GC‐MS analyses reveal the presence of acetone, freon‐E, benzene, toluene, xylene, methylfluorosiloxane, chloromethane, and dichloromethane (Biemann et al., 1977). The origin of these compounds was first proposed to be terrestrial contamination; for instance, the
©2019. American Geophysical Union. All Rights Reserved.
• In this article, we evaluate the impact of the Tenax® traps on the Sample Analysis at Mars experiment results, with concurrent implications for the future Martian Organic Molecule Analyser experiment results
• Tenax® is an adsorbent resin used on SAM as a trap; it is an organic polymer that can be degraded into smaller molecules
• By‐products of Tenax® may contribute to the background of the SAM chromatogram. Here we identify them and the conditions of their production
Correspondence to:
A. Buch,
Citation:
Buch, A., Belmahdi, I., Szopa, C., Freissinet, C., Glavin, D. P., Millan, M., et al. (2019). Role of the Tenax® adsorbent in the interpretation of the EGA and GC‐MS analyses performed with the Sample Analysis at Mars in Gale crater. Journal of Geophysical
Research: Planets, 124,
https://doi.org/10.1029/2019JE005973 Received 26 MAR 2019
Accepted 10 SEP 2019
Accepted article online 10 OCT 2019
2819–2851.
dichloromethane was widely attributed to residues of solvents used for cleaning procedure (NASW‐4355, 1988). However, the possibility that chloromethane could originate on Mars could not be excluded (Biemann et al., 1977). Decades later, with the discovery of perchlorates (0.4 to 0.6 wt%) in Martian soil with the Phoenix mission (Hecht et al., 2009), results have been reinterpreted after showing that heating a mixture of organic molecules and perchlorates under the GC‐MS experimental conditions produced chloromethane and other chlorine‐bearing organics (Navarro‐Gonzalez et al., 2010). Perchlorates were also recently detected with the Sample Analysis at Mars (SAM) experiment on the Curiosity rover in soil samples in Gale crater (Glavin et al., 2013). This detection, in a quite different region than the high latitude northern plains where the Phoenix probe landed, adds to models of production of perchlorates on Mars (Carrier & Kounaves, 2015; Clark & Kounaves, 2016) and suggests that perchlorates could be widespread at the surface of Mars. It is possible that the chlorohydrocarbons detected with the GC‐MS experiment onboard Viking were representative of organics indigenous to the samples that would have reacted with perchlorates. But this assumption cannot be verified by the limited number of experiments carried out with Viking's GC‐MS experiment. But more recently it has been suggested that the presence of chlorobenzene in the Viking signal could have been the result of a reaction of Martian organic molecules with Martian perchlorate (Guzman et al., 2018).
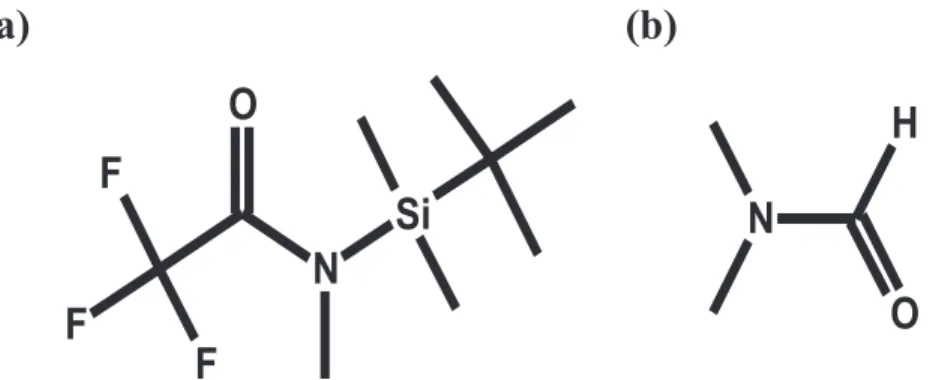
Since Viking, we have made substantial strides in our ability to detect OMs on the surface of Mars. The MSL is capable of detecting a wide range of organic molecules, including the carboxylic salts, after derivatization, predicted by Benner et al. (2000). The SAM Sample Acquisition/Sample Processing and Handling system (SA/SpaH) can receive Martian scooped soil or drilled rock samples. Each sample is placed in one of 74 cups that can be heated up to ~900 °C. There are six calibration cups and 68 sample cups, including 59 empty quartz cups for pyrolysis and nine metal cups containing wet chemistry solvent (seven with N‐(tert‐butyldi-methylsilyl)‐N‐methyl‐trifluoroacetamide (MTBSTFA) and dimethylformamide (DMF) 4:1 for derivatization experiments (Figures 1a and 1b) and two with tetramethylammonium hydroxide (TMAH) diluted in metha-nol (25% v/v) for thermochemolysis experiments).
SAM uses two sample preparation modes: pyrolysis and wet chemistry (derivatization and thermochemo-lysis). Pyrolysis consists of exposing the samples to high temperatures (up to 800 °C; Moldoveanu, 1998). The aim of the wet chemistry experiments is to increase the range of compounds analyzable by GC‐MS by reducing the polarity of the OM contained in the sample. Due to the polar nature of several Martian mole-cular targets (amino acids, carboxylic acids, amines, etc.), derivatization is required in order to make ana-lytes less polar, less reactive by reducing their ability to do intermolecular and intramolecular H‐bonding, and thus more volatile (Lin et al., 2008; Orata, 2012), improving their thermal stability and their chroma-tographic analysis. MTBSTFA is a silyl reagent (Figure 1), which replaces any labile (reactive) hydrogen in chemical bonds (e.g., ‐OH, ‐NH2, ‐SH, and ‐COOH) with the nonpolar moiety ‐Si (CH3)2C(CH3)3
(Kataoka, 1996). Thermochemolysis thermally degrades molecules before the substitution of acidic hydro-gen by apolar groups from TMAH (i.e., methyl groups –CH3; Challinor, 2001; Gallois et al., 2010;
Shadkami & Helleur, 2010).
Figure 1. Chemical diagram of (a) N‐tert‐butyldimethylsilyl‐N‐methyltrifluoroacetamide (MTBSTFA) and (b) dimethyl-formamide (DMF).
After sample preparation, the stream of helium is divided: a 1:800 fraction is sent directly to the quadrupole mass spectrometer, while the sample is heated at a rate of 35 °C/min (evolved gas analysis modes). The frac-tion sent to GC‐MS is first trapped on the hydrocarbon (HC) trap and then the injector trap (IT), which serves to preconcentrate the chemical compounds before a pulsed thermal injection into the column for analysis (GC‐MS mode). The HC trap is packed with three types of adsorbents in series: nonporous silica beads, Tenax® TA, and 60/80 mesh Carbosieve G (Mahaffy et al., 2012), whereas the IT in front of GC Column 5, the most commonly used column on SAM to date, is packed with Tenax® GR (Mahaffy et al., 2012). Tenax® TA is a porous polymer made of poly(2,6‐diphenyl‐p‐phenylene oxide) polymer (PPPO; Figure 2), and Tenax® GR is made of 70% of PPPO and 30% graphitic carbon, which are respectively used to trap C6‐
C26and C7‐C30organic molecules. 1.2. SAM Objectives and Results
Among SAM's objectives is the search for indigenous organic compounds in Mars' subsurface (down to 6‐cm maximum; Mahaffy et al., 2012). Organic molecules indigenous to a Martian sample were identified early in the mission. These include chlorobenzene (if generated in situ under Martian irradiation; Freissinet et al., 2015) and dichlorobenzene (Szopa et al., 2015) as well as C2 to C4 dichloroalkanes. The chlorinated aromatic HC s (chlorobenzene and dichlorobenzene) could be either present as is in the Martian sample or more likely derived from other precursors.
The nature of these precursors has been investigated, and possibilities that have been proposed include ali-phatic compounds, aryl molecules, and high molecular weight compounds (e.g., kerogen; Freissinet et al., 2015). Experiment showed that acetic acid, propane, propanol, and hexane pyrolyzed with calcium perchlo-rates generate several chlorine‐bearing aliphatic molecules (e.g., 2,3‐dichlorobutane, chlorohexane, dichlor-ohexane, 2‐chloropropane, 1,2,3‐trichloropropane, and 1‐chloro‐2‐propanone), some of which are detected by SAM, that is, dichloromethane, carbon tetrachloride, and 1,2‐dichloropropane(Miller et al., 2016). And, pyrolysis of Murchison kerogen in the presence of calcium perchlorate releases chloromethane, chlor-oethane, chloropropane, and chlorobenzene (Miller et al., 2016). All of them have been detected by SAM (Freissinet et al., 2015).
Some authors also demonstrated that functionalized aromatic compounds, that is, benzoic acid, phthalic acid, and mellitic acid, can be precursors of chlorobenzene and dichlorobenzene when they are mixed with perchlorates and chloride (Miller et al., 2016; Steininger et al., 2012). It has been suggested that the benzene-carboxylic acid family of compounds are metastable products of the oxidation of aromatic HCs and acid inso-luble kerogens by hydroxide radical (photodissociation product of water by UV radiation; Benner et al., 2000). However, other sources of organic matter transformation exist, including radiation and other oxidants. For instance, Stalport et al. studied the effect of UV radiation on benzenecarboxylic acids and oxalic acid. He
demonstrated that benzoic acid, oxalic acid, phthalic acid, and trimesic acid are rapidly destroyed by such radiation (Stalport et al., 2009; Stalport et al., 2010). Only mellitic acid persists after evolving into an UV and oxidation resistant compound (benzenehexacarboxylic acid‐trianhydride (C12O9)) (Poch et al., 2014;
Stalport et al., 2009).
Several other organic molecules have been identified as part of the SAM GC‐MS background: compounds released by the stationary phase of the column; residues of preflight tests; residues of MTBSTFA and DMF; nonchlorinated aromatic compounds from Tenax® degradation; permanent gases from the degrada-tion of MTBSTFA, DMF, and Tenax®; and mineral thermal degradadegrada-tion products. Among those molecules, phenol, a functionalized aromatic, is known to be released from the Tenax® trap and could sustain chlorina-tion from the perchlorates of the sample. Addichlorina-tionally, SAM has also identified various chlorinachlorina-tion states of methane, thought to be a product of perchlorate‐mediated chlorination of methane from MTBSTFA degra-dation (Glavin et al., 2013), although a Martian origin of the methane cannot be excluded (Webster et al., 2018).
MTBSTFA and DMF by‐products are very well known (Freissinet et al., 2015; Glavin et al., 2013; Miller et al., 2016), but this is not the case of Tenax® within SAM conditions. Because Tenax® is an organic polymer, it is able to generate by‐products when it is heated or exposed to reactive gas such as NO2or O3(Clausen &
Wolkoff, 1997; Klenø et al., 2002). The main degradation products of Tenax® are 2,6‐diphenyl‐p‐ benzoquinone, 2,6‐diphenyl‐p‐hydroquinone, and acetophenone.
Moreover, the Tenax® adsorbent may be impacted by the storage condition and to the number of times the adsorbent is reused. For example, experiments showed that after a storage of toluene at−20 for 24 hr in a Tenax® TA trap, the efficiency of the desorption was decreased by about 10% (Chu et al., 2016).
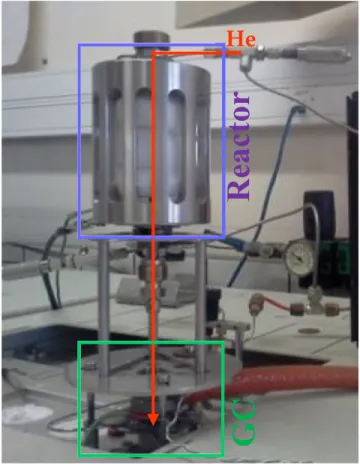
Figure 3. Sample preparation device (Buch, Sternberg, & Chazalnoel, 2009). The reactor is 20 cm high and has a diameter of 7 cm. It consists of a gas chromatograph liner that can be used in split or splitless mode. It can go from a temperature of +20 to +600 °C in 30 s. The reactor can also be quickly cooled with liquid CO2, from 600 to−180 °C in 30 s. A septum
The objective of this work is to build an exhaustive molecular database to support the interpretation of the SAM results by identifying all the possible sources of contamination brought by the trap adsorbents, espe-cially Tenax®, and understand modes for their production under SAM conditions. Upon heating, the adsor-bents, especially Tenax®, generate by‐products, so it is necessary to determine the nature of these molecules. For this purpose, we tested (1) the thermal stability of Tenax® (TA and GR) up to 600 °C and the OM released during their degradation, (2) the impact of MTBSTFA or a mixture MTBSTFA/DMF on the Tenax® degrada-tion, and (3) the reactivity between Tenax® and calcium perchlorate.
1.3. ExoMars and the Future MOMA Experiments
In 2020, the joint ESA‐Roscosmos ExoMars‐2020 mission will be launched, including the Mars Organic Molecules Analyser (MOMA) experiment carried by the Rosalind Franklin rover. The goals of the mission include the search for molecules relevant to life on the Martian surface and near subsurface (large, nonvola-tile organic or biological molecules that suggest existing or prior biosynthetic activity), as well as the discri-mination of endogenous from exogenous sources of organics on Mars. The MOMA experiment will be a key analytical tool in providing chemical (molecular) information from the solid samples collected by the rover, with a particular focus on the characterization of the organic content (Goetz et al., 2016). The MOMA instru-ment contains a UV laser desorption/ionization ion trap mass spectrometer (LD‐ITMS) and a gas chromatograph‐ion trap mass spectrometer (GC‐ITMS), with on‐board derivatization capabilities, which provide the unique capability of characterizing a broad range of compounds, including a range of volatile and nonvolatile species, as well as chiral analysis. Core samples will be extracted as deep as 2 m below the Martian surface to minimize the effects of radiation and oxidation on OMs. Samples will be crushed and deposited into sample cups seated in a rotating carousel. These cups are sealed with a tapping station and gas processing system prior to pyrolysis.
Soil samples will be analyzed either by LDI‐ITMS or pyrolysis GC‐ITMS. In a subset of GC‐MS analyses, select samples are subjected to in situ derivatization, consisting of the reaction of the sample components with specific reactants (MTBSTFA (Buch, Sternberg, Szopa, et al., 2009), DMF‐DMA (Freissinet et al., 2010), and TMAH (Geffroy‐Rodier et al., 2009)). To preconcentrate the volatile species, two Tenax® TA traps will be used (Goesmann et al., 2017). Those traps will be subject to a heating process up to 350 °C in presence of perchlorate salts and a derivatizing reagent (in particular MTBSTFA). Thus, the results of this study will not only impact our understanding of the SAM results from Gale Crater but also help to interpret the future GC‐MS data from the ExoMars mission.
2. Materials and Methods
2.1. Reagents and MaterialsThe physical thermal evolution of Tenax® was studied using thermal‐gravimetry. The mass loss and the heat exchanges were monitored using a Sensys (Setaram) instrument composed of a thermogravimetric analyzer coupled with a differential scanning calorimeter (TG‐DSC). The chemical thermal evolution of Tenax® was followed using gas chromatography coupled to mass spectrometry. Analyzes were performed on a Trace GC Ultra (ThermoFisher) gas chromatograph equipped with an Optic 3 injector (GL Science, with a maximum operating temperature of 600 °C) and coupled with a quadrupole mass spectrometer DSQ II (ThermoFisher). Electron impact at 70‐eV energy was used as the ionization source, and the 45 to 450 m/z range was scanned. To characterize the gaseous products released from the sample, GC‐MS analyses were completed using two capillary Restek columns: RTX‐5Sil‐MS (30 m × 0.25 mm × 0.25 μm) and RTX20 (30 m x 0.25 mm x 0.25 μm). The carrier gas was helium (99.9999% purity) set at a 1.0 mL/minflow rate, with a 20 mL/min (RTX‐5Sil‐MS) or 10 ml/min (RTX20) splitflow rate. With the RTX‐5Sil‐MS, the column temperature started at 35 °C, held for 8 min, and then heated at a 7 °C/min ramp up to 300 °C and held 10 min at this maximum temperature. With the RTX20, the column temperature started at 35 °C, held for 5 min, and then heated at a 10 °C/min ramp up to 300 °C and held 5 min at this maximum temperature.
The samples were prepared for chromatographic analyses using a patented reactor (Buch, Sternberg, & Chazalnoel, 2009) that plays the role of an additional oven located upstream from the Optic 3 injector of the GC‐MS (Figure 3).
GC grade derivatization reagents MTBSTFA (99.8%) and DMF (>97%) were purchased from Fluka (France) and Alfa Aesar (France) respectively. Tetrahydrated calcium perchlorate was purchased from Alfa Aesar (France).
The two adsorbents (Tenax® GR and Tenax® TA) were purchased from Interchim (France). Both have a 60– 80 mesh size distribution similar to the one used for the SAM's trap. Before analyses, in order to remove any contamination, which could be trapped on the adsorbents, they were cleaned and conditioned. The Tenax® was heated at 280 °C under a 20 ml/min heliumflow, either for 24 hr (long conditioning) or 2 hr (short con-ditioning) to study the effect of conditioning on adsorbent degradation.
Calcium perchlorate (Ca (ClO4)2) was chosen for this study on the basis of its detection in the Rocknest
sam-ple (Archer et al., 2014; Glavin et al., 2013; Leshin et al., 2013). As perchlorate salts are highly hygroscopic, they were dehydrated before use in an oven in order to accurately measure the mass of perchlorate handled. Then, the salts of calcium perchlorate were heated at 100 °C to ensure that they were dehydrated. Then, they were put in a hot mortar to keep them dry during crushing. The solidified salts were crushed to form perchlo-rate shaving. To preserve perchloperchlo-rate from moisture, they were stored in a desiccator. The determination of percentage of water contained in calcium perchlorate has been done using Karl Fischer Titration (Aquaprocesseur radiometer) (Burns & Muraca, 1962). The mean value for the salt we use is around 1% ± 0.5%
2.2. Thermal Stability of Tenax® TA and GR
To test the thermal stability of Tenax®, 10 mg of Tenax® GR or Tenax® TA was introduced in a glass liner to be preconditioned according to the method described previously. Once this step completed, the Tenax® was heated to a specified temperature ranging from 100 to 600 °C. For each temperature, fresh and clean adsor-bent was used. This experiment was repeated 2 times with increasing conditioning duration of 2 and 24 hr. The gaseous products were monitored in real time by GC‐MS, using a RTX‐20 column.
The physical behavior of Tenax® was also studied with TG‐DSC. With this aim, an aluminum crucible con-taining 10 mg of Tenax® GR or Tenax® TA isflowed with dinitrogen (99.9999% purity) at 50 ml/min. For the original experiment, the initial temperature of Tenax® was set to 280 °C and kept constant for 30 min to clean the adsorbent. After this step was completed, the temperature was increased at a 5 °C/min rate up to 600 °C. 2.3. Study of the Interaction of Tenax® GR With Derivatization Reagents
In order to study the chemical reactivity that can occur between the derivatization reagents and the adsor-bents used in SAM, the thermal degradation experiment described above was repeated in the presence MTBSTFA or a mixture of MTBSTFA and DMF. Thus, a 0.5μl volume of MTBSTFA or MTBSTFA/DMF ture (4:1) was deposited on 24 hr preconditioned Tenax® GR (long conditioning) in the injector, and the mix-ture was heated to temperamix-tures ranging from 100 to 600 °C. The gaseous products of reaction were analyzed by GC‐MS using the same chromatographic conditions as presented previously.
2.4. Study of the Impact of Calcium Perchlorate on the Adsorbents' Stability
The aim of these experiments was to understand the range of by‐products released from the adsorbents (Tenax® GR and TA) when they were exposed to chemically aggressive species such as Cl2, HCl, and O2
released from the perchlorate thermal degradation. In addition, we studied the production of by‐products from Tenax® as a function of the amount of perchlorates. The following two different types of experiments were carried out to study this interaction:
1. We placed a long‐conditioned sample of adsorbent in direct contact with perchlorate. About 25 mg of Tenax® was placed in the SplitSpless (SSL) GC injector with amounts of perchlorate varying from 3 to 24 mg (~10 to 50wt% of calcium perchlorates; mass fraction is defined as the ratio of the mass of per-chlorates to the sum of masses of perper-chlorates and Tenax®. Then the injector temperature was set to 400 °C (this temperature is above the Tenax® recommended operating temperature and provides a good sample of possible Tenax® by‐products) and the gases released from the sample were analyzed by GC‐MS.
2. The perchlorate degradation products were sent to the adsorbents from upstream. This experiment allowed a closer approximation of the behavior of the SAM experiment. For these experiments, amounts of Ca (ClO4)2ranging from ~10 to 50 wt% (from 3 to 24 mg) were placed in the additional oven (Figure 3)
Table 1 Li st of the Che mical Co mpounds Det ected With GC ‐MS Anal ysis During the Therma l Degrad ation Exp eriments of Tenax® Alone, and Mixtu res of Tenax® With MTBST FA and MTBS TFA/DM F No. Rt (s) Compound CAS No. Short conditioning Tenax® TA Short conditioning Tenax® GR Long conditioning Tenax® GR Long conditioning Tenax® GR + MTBSTFA Long conditioning Tenax® TA + MTBSTFA/DMF Source Compounds detected by SAM 1 199.2 Tert ‐butyldimethyl fl uorosilane NA N.D. N.D. N.D. 350 ‐600 N.D. MTBTSFA ✓ 2 358.8 2,2,2, ‐Tri fl uoro ‐N ‐methylacetamide 815 ‐06 ‐5 N.D. N.D. N.D. 100 ‐550 100 ‐600 MTBTSFA ✓ 3 446.4 Trimethylsilanol 18173 ‐ 64 ‐3 N.D. N.D. N.D. 100 ‐600 100 ‐600 MTBTSFA ✓ 4 285.6 Benzene 71 ‐43 ‐2 400 –600 400 –600 500 –600 500 –600 600 TENAX ✓ 5 446.4 Tert ‐butyldimethylsilanol (MSW) 18173 ‐ 64 ‐3 N.D. N.D. N.D. 100 –600 100 –600 MTBTSFA – H2 O ✓ 6 455.4 Toluene 108 ‐88 ‐3 500 –600 400 –600 550 –600 200 –600 500 –600 TENAX ✓ 7 575.4 N ,N ‐dimethylformamide (DMF) 68 ‐12 ‐2 N.D. N.D. N.D. N.D. 100 –600 DMF N.D. 8 574.2 Ethylbenzene 100 ‐41 ‐4 550 –600 450 –600 550 –600 550 –600 550 –600 TENAX ✓ 9 600 Phenylethyne 536 ‐74 ‐3 450 –600 450 –600 N.D. 500 –600 550 –600 TENAX ✓ 10 616.8 Styrene 100 ‐42 ‐5 400 –600 400 –600 550 –600 550 –600 550 –600 TENAX ✓ 11 675.6 2,2,2 ‐Tri fl uoro ‐N ‐methyl ‐N ‐ (trimethylsilyl)acetamide 24589 ‐ 78 ‐4 N.D. N.D. N.D. 100 –600 100 –300 MTBSTFA ✓ 12 720.6 729.6 768.6 784.8 Benzene, 1‐ ethenyl ‐2 ‐methyl or Benzene, 2‐ propenyl or o‐ methylstyrene or p‐ methylstyrene, or m ‐methylstyrene 611 ‐15 ‐4 300 ‐57 ‐2 98 ‐83 ‐9 622 ‐97 ‐9 100 ‐80 ‐1 400 –600 400 –600 N.D. 450 –600 N.D. TENAX N.D. 13 723.6 N ,N ‐diamylmethylamine 76257 ‐ 73 ‐3 N.D. N.D. N.D. 100 –600 100 –250 DMF N.D. 14 734.4 Phenol 108 ‐95 ‐2 400 –600 400 –600 600 400 –600 550 –600 TENAX ✓ 15 777.6 1,3 ‐Ditert ‐butyl ‐1,1,3,3 ‐ tetramethyldisiloxane (BSW) 67875 ‐ 55 ‐2 N.D. N.D. N.D. 100 –600 100 –600 MTBSTFA – H2 O ✓ 16 801 Benzene, 1‐ propynyl or benzene, 1‐ ethynyl ‐3 ‐methyl 673 ‐32 ‐5 766 ‐82 ‐5 N.D. 450 –600 N.D. 450 –600 550 –600 TENAX/ MD N.D. 17 808.8 Cresol 13 19 ‐77 ‐3 N.D. N.D. N.D. 500 –600 600 T E N A X /M D N.D. 18 847.8 Acetophenone 98 ‐86 ‐2 500 –600 400 –600 N.D. 300 –600 550 –600 T E N A X /M D N.D. 19 864 Benzene,1 ‐methyl ‐4 ‐(2 ‐propenyl) ‐ 3333 ‐13 ‐ 9 N.D. N.D. N.D. 550 –600 600 TENAX/ MD N.D. 20 930 Tris-(trimethylsilyl)borate 4325 ‐85 ‐ 3 N.D. N.D. N.D. 100 –600 100 –250 MTBSTFA ✓ 21 936 Benzoic acid 65 ‐85 ‐0 400 –450 N.D. N.D. N.D. N.D. TENAX N.D. 22 951.6 Naphtalene 2471 ‐84 ‐ 3 400 –600 400 –600 500 –600 350 –600 500 –600 TENAX ✓ 23 993 3‐ Phenyl ‐3 ‐butene ‐2 ‐one 32123 ‐ 84 ‐5 N.D. N.D. N.D. 550 –600 N.D. TENAX/M N.D. 24 1,038 Bis ‐( tert ‐butyldimethylsilyl)carbonate NA N.D. N.D. N.D. 100 –600 100 –400 MTBSTFA N.D. 25 1,114.2 Diphenyldi fl uorosilane 312 ‐40 ‐3 N.D. N.D. N.D. 350 –600 N.D. MTBSTFA N.D. 26 1,125.6 Biphenyl 92 ‐52 ‐4 400 –600 400 –600 450 –600 300 –600 500 –600 TENAX ✓ 27 1,158 Benzoic acid, TBDMS 75732 ‐ 41 ‐1 N.D. N.D. N.D. 250 ‐600 N.D. TENAX/M deriv. ✓
Table 1 (continu ed) No. Rt (s) Compound CAS No. Short conditioning Tenax® TA Short conditioning Tenax® GR Long conditioning Tenax® GR Long conditioning Tenax® GR + MTBSTFA Long conditioning Tenax® TA + MTBSTFA/DMF Source Compounds detected by SAM 28 1,149.6 1H ‐indene ‐1,3(2H) ‐dione 606 ‐23 ‐5 450 –500 N.D. N.D. N.D. N.D. N.D. N.D. 29 1,164.6 1,209.6 Diphenylmethane or 2‐ Methylbiphenyl 101 ‐81 ‐5 643 ‐58 ‐3 400 –600 400 –600 450 –600 400 –600 550 –600 TENAX N.D. 30 1,227 Stilbene 588 ‐59 ‐0 400 –500 N.D. N.D. N.D. N.D. N.D. N.D. 31 1,254.6 1,399.8 o‐ Hydroxy ‐biphenyl or p‐ Hydroxybiphenyl or m ‐Hydroxybiphenyl or 90 ‐43 ‐7 92 ‐69 ‐3 580 ‐51 ‐8 400 –550 400 –600 450 –600 150 –600 500 –600 TENAX N.D. 32 1,291.8 Fluorene 86 ‐73 ‐7 450 –550 400 –600 N.D. 300 –600 N.D. TENAX/M N.D. 33 1,288.2 p‐ Benzylphenol 39579 ‐ 09 ‐4 400 –550 N.D. 500 –600 500 –600 N.D. TENAX/M N.D. 34 1,338 4‐ Phenyl ‐4 ‐cyclopentene ‐1,3 ‐dione 51306 ‐ 96 ‐8 450 –600 N.D. N.D. 500 –600 N.D. TENAX/M N.D. 35 1,453.2 9H ‐fl uorene, 9‐ methylene 85 ‐01 ‐8 450 –600 N.D. N.D. 500 –600 N.D. TENAX/M N.D. 36 1,483.2 1‐ Benzylnaphthalene 611 ‐45 ‐0 450 –550 N.D. N.D. 500 –600 N.D. TENAX/M N.D. 37 1,509 [1,1 ′‐ biphenyl] ‐2,5 ‐diol [1,1 ′‐ biphenyl] ‐4,4 ′‐ diol 1079 ‐21 ‐ 6 92 ‐88 ‐6 400 –600 400 –600 N.D. 350 –600 500 –600 TENAX/ MD N.D. 38 1,561.2 2‐ Phenyl ‐naphtalene 35465 ‐ 71 ‐5 450 –500 400 –600 N.D. 300 –600 500 –600 TENAX/ MD N.D. 39 1,682.4 Terphenyl 26140 ‐ 60 ‐3 400 –550 400 –600 500 –600 250 –600 500 –600 TENAX/ MD N.D. 40 1,723.8 1,794 1,874.4 m ‐Terphenyl ‐2 ′‐ ol or m ‐terphenyl ‐4 ′‐ ol 2432 ‐11 ‐ 3 6093 ‐03 ‐ 4 400 –600 400 –600 400 –600 250 –600 500 –600 TENAX ND 41 1,780.8 1,797.6 1,818.6 Indeno[2,1b]oxine, 2‐ phenyl or Dibenzofuran, 4‐ phenyl or dibenzofuran, 1‐ phenyl 10435 ‐ 67 ‐3 74104 ‐ 10 ‐ 2 6331-7‐ 69 ‐1 400 –600 400 –600 550 –600 350 –600 500 –600 TENAX N.D. 42 1,807.8 2,103 2,134.2 m ‐Terphenyl, 5′ phenyl or Quaterphenyl 612 ‐71 ‐5 29036 ‐ 02 ‐0 N.D. N.D. N.D. 600 500 –600 TENAX/ MD N.D. 43 1,861.8 2,5 ‐Cyclohexadiene ‐1,4 ‐dione, 2,5 ‐ diphenyl ‐ 844 ‐51 ‐9 N.D. N.D. N.D. 600 500 –600 TENAX/ MD N.D. 44 1,965.6 2,001.6 2,019.6 2,4,6 ‐Triphenylphenol 3140 ‐01 ‐ 0 N.D. N.D. N.D. 600 N.D. TENAX/M N.D. Note . T hey are p rese n ted w ith thei r retention ti m es, thei r C A S n umbers, and the te m peratures at w h ich th ey are rel eased. A sp eci fi c column cor re spon ds to th e comp ound s det ect ed by SAM. Abb reviation s: DMF: dimet hylformamid e; G C ‐MS: gas ch romato graph mass spectro meter; MTB STFA – H2 O: deriva tization produc ts of water by MTB SFA (MSW : monosi lylated wa ter/BSW: bisil ylated water); N.D .: not de tected; SAM: Sample An alysis at Mars; TENAX : Tenax® degradati on by ‐pro ducts observe d with or without addition of the derivat ized produc ts (MTB STFA or MTBST FA/D MF mixture); TEN AX/M: non ‐deriva tized molecules formed from Tenax ® only in the pres ence of MTB STFA (certai nly due to MTB STFA by ‐produc t i.e. HF); TE NAX/M deriv. : the TBDMS ‐ben zoic acid is the result of the deriva tization by MTBST FA of Tenax® de gradation pro duct i.e. ben zoic acid ; TE NAX/MD: non ‐deriva tized Tenax® pro ducts generate d only after the addition of MTB STFA or of MTB STFA /DMF mi xture .
and heated to 400 °C (±10 °C). Gaseous degradation products were sent to the optic 3 injector, which contains Tenax® GR cooled to 0 °C (using CO2cooling) for 5 min. Desorption occurred at 300 or 400 °
C. The approximate maximal temperature reached by Tenax® in SAM trap is set between those two temperatures (Glavin et al., 2013; Leshin et al., 2013).
Tenax® GR adsorbent is contained in the HC traps of SAM placed upstream from the IT. As a result, these traps are thefirst exposed to derivatization solvent or perchlorates by‐products, and thus the most likely impacted. For this reason, we prioritized the use of Tenax® GR for these experiments with pure MTBSTFA, mixed MTBSTFA/DMF, andfinally with perchlorates.
3. Results and Discussions
3.1. Thermal Degradation of Tenax® GR and TA 3.1.1. Thermal Degradation Products
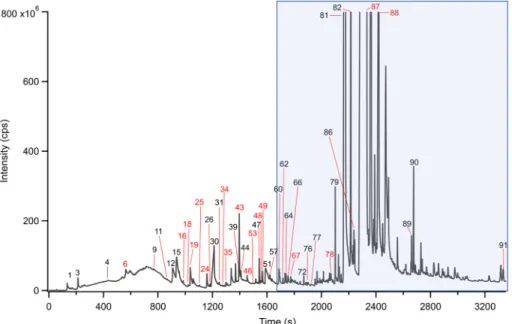
The effect of temperature on Tenax® TA and Tenax® GR degradation was investigated up to 600 °C, which is higher than the maximum temperature used for SAM (300 °C) for trap heating. The molecules detected are presented in Table 1. A typical chromatogram obtained from the heating of the Tenax® TA to 600 °C is dis-played in Figure 4.
In Table 1, we observe that the short conditioning Tenax® TA and the short conditioning Tenax® GR starts to release volatile products from 400 °C. Twenty‐five and 19 organic molecules were detected, respectively, a majority of them containing aromatic rings. The size of these compounds ranged from C6to C24(Table 1).
We separated them into four groups such as phenyl (which contains one aromatic cycle of 6 carbons, e.g., benzene and acetophenone), biphenyl (e.g., biphenyl and hydroxybiphenyl), terphenyl (e.g., terphenyl) deri-vatives, and other molecules that are produced either by cyclization or recombination including naphtha-lene, benzofurane, stilbene, andfluorene derivatives.
3.1.2. Degradation Mechanisms of Tenax®
To explain the thermal decomposition of the Tenax® and the formation of the detected by‐product (Table 1), we follow a general mechanism of thermal decomposition of polymers (Witkowski et al., 2016). The altera-tion of the polymer is initiated by (1) the main chain reacaltera-tion, a random‐chain scission (the decomposialtera-tion reaction produces monomers or oligomers including ten monomers units maximum) and the cross‐linking between unsaturated site, or (2) the side chain reaction, a side chain elimination (the decomposition takes place at the adjacent groups) and side chain cyclization. Then, the decomposition of the polymer
Figure 4. Chromatogram obtained on a RTX20 (Restek) column when analyzing the compounds released by Tenax® TA heated up to 600 °C (the numbers corre-spond to those presented in Table 1). The shaded part correcorre-sponds to all the compounds unable to be seen by Sample Analysis at Mars due to their high retention times. Temperature program: 35 °C hold for 5 min then 10 °C/min up to 300 °C then isotherm at 300 °C for 5 min.
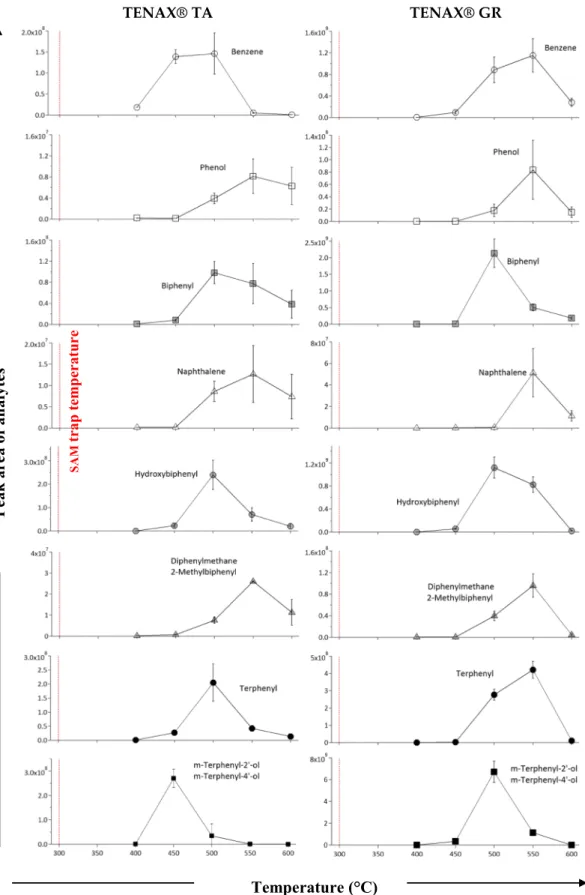
Figure 5. Evolution of the quantity of compounds released from Tenax® GR and TA versus the temperature for the benzene (m/z 78), phenol (m/z 94), naphthalene (m/z 128), hydroxybiphenyl (m/z 170), biphenyl (m/z 154), diphenylmethane‐2‐methylbiphenyl (m/z 168), terphenyl (m/z 230), and m‐terphenyl‐2′‐ol/m‐terphenyl‐ 4′‐ol (m/z 246). Maximum temperature of the Sample Analysis at Mars trap is 300 °C (red line).
propagates through hydrogen atom transfer (intramolecular and intermolecular transfer) and decomposition of the polymer (depolymerization). Finally, a termination neutralizes the propagation of the decomposition of the polymer by the assembly of two polymer chain radicals (recombination), by the transfer of hydrogen radicals from another polymer chain (disproportionation) or from an unimolecular termination.
To elucidate the mechanism of thermal degradation of Tenax® GR and Tenax® TA and the formation of the species released during degradation, the abundances of their major thermal degradation products are plotted as a function of temperature (Figure 5).
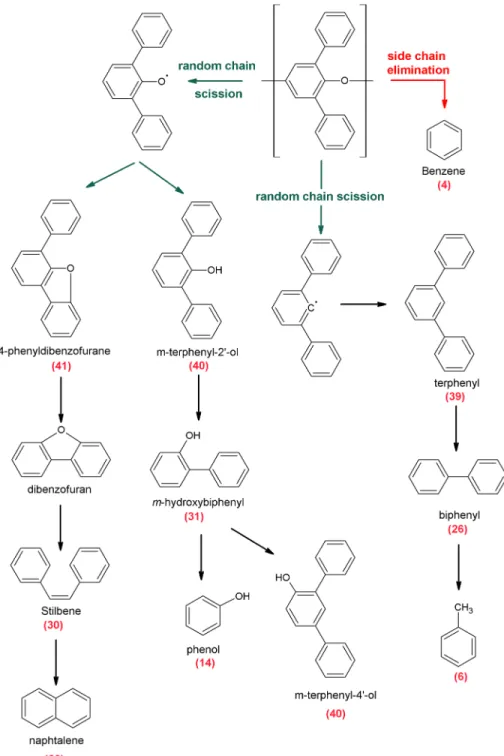
Figure 6. Mechanisms of thermal degradation of the Tenax® by side chain elimination and random chain scission. The pathway of formation for Tenax® certain artifacts is listed in Table 1. The numbers in brackets correspond to the number of compounds listed in Table 1.
The products of thermal degradation of the Tenax® GR adsorbents begin to be released at 400 °C. The emis-sion of m‐terphenyl‐2′‐ol/m‐terphenyl‐4′‐ol (isomers), biphenyl, and hydroxybiphenyl reached their maxi-mum intensity at 500 °C for Tenax® GR. At this same temperature, other molecules, namely, benzene, diphenylmethane/2‐methylbiphenyl (isomers), terphenyl, and phenol also started to evolve. Nevertheless, their maximum rate of production was observed around 550 °C. With Tenax® GR, the naphthalene peak emerged only at 550 °C.
With regard to Tenax® TA, the release of polymer thermal degradation products started at the same tempera-ture as Tenax® GR, 400 °C. However, the formation of m‐terphenyl‐2′‐ol/m‐terphenyl‐4′‐ol and benzene reached their maximum of intensity at 450 °C. Hydroxybiphenyl, terphenyl, biphenyl, and benzene were produced at 500 °C as well as diphenylmethane/2‐methylbiphenyl, naphthalene, and phenol, which peaked at 550 °C. For all compounds and both Tenax® TA and GR, the abundance of thermal degradation products drastically decreased from 600 °C.
These results appear to indicate that the thermal decomposition of Tenax® (Figure 6) occurred through ran-dom chain scissionfirst, leading to the formation of m‐terphenyl‐2′‐ol/m‐terphenyl‐4′‐ol when the adsorbent degradation began (Figure 5; Tenax® TA at 450 °C and Tenax® GR at 500 °C). Then, at higher temperatures (around 450 and 500 °C), smaller molecules including terphenyl, hydroxybiphenyl, and biphenyl came out either directly from PPPO polymer by random chain scission or from of Tenax® by‐products by thermal degra-dation. The compounds observed could have been the result of the degradation of larger molecules or the
Figure 7. Evolution with temperature of the amount of Tenax® GR and Tenax® TA major thermal degradation products, that is, benzene (m/z 78), phenol (m/z 94), naphthalene (m/z 128), hydroxybiphenyl (m/z 170), biphenyl (m/z 154), diphenylmethane/2‐methylbiphenyl (m/z 168), terphenyl (m/z 230), and m‐terphenyl‐2′‐ol/m‐terphenyl‐4′‐ol (m/z 246).
Figure 8. Picture of the dark residues deposited in the gas chromatograph‐mass spectrometer liner after the exposure to 600 °C of 50 mg of Tenax® GR contained in the liner.
recombination of smaller compounds. For instance, biphenyl might have been formed either from the ther-mal decomposition of terphenyl or from the recombination of phenyl fragments (Masonjones et al., 1996; Silverman et al., 2007). Diphenylmethane, 2‐methylbiphenyl and naphthalene could have been caused respectively by recombination of phenyl fragments or cyclization of phenyl derivatives (Bittner & Howard, 1981; Colket & Seery, 1994; Frenklach et al., 1985). The fact that they were mostly formed at high temperature (550 °C) is due to the production of phenyl derivatives at this temperature.
Benzene, however, is an interesting case. This molecule can be formed by many pathways specifically by the secondary decomposition of larger Tenax® degradation products (e.g., terphenyl and biphenyl; Figure 6) or directly from the polymer by the side chain elimination process (Witkowski et al., 2016). This latter way of production directly from the Tenax® explains why the benzene is produced at lower temperatures that the other by‐products (400 °C from Tenax® TA).
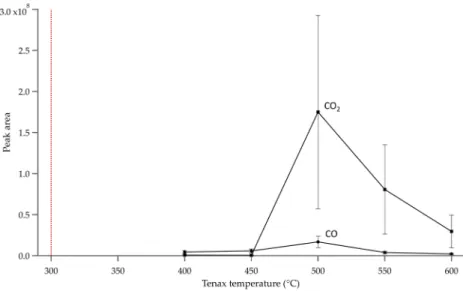
Finally, at 600 °C, the amount of carbon dioxide and carbon monoxide also decreased (Figure 7); thus, it fol-lows that the amount of Tenax® by‐products decreased drastically (Tenax® by‐products are not transformed into carbon oxides). Still, the observation of a dark solid residue for both Tenax® GR deposited inside the
Figure 9. Weight loss (dark grey) and heatflow (light grey) of Tenax® GR and Tenax® TA (10 mg each) measured between 300 and 600 °C. (Tfusand Tdegare respectively defined as the temperature of fusion and the temperature of the onset of
liner seems to indicate the formation of condensate organic compounds in the gaseous phase that are refractory to GC‐MS analysis (Figure 8). Indeed, it had been observed that these residues are not degraded at high temperatures (up to ~600 °C) in inert gas conditions; they can only be removed by a combustion processes (e.g., clean up on ambient air [with O2] at 500 °C). These condensate OMs happened to be soot
(i.e., products of the gas‐phase incomplete combustion of organics) produced in the gaseous phase and sensitive to the presence of oxygen (Hamins, 1993; Moldoveanu & David, 2002; Omidvarborna et al., 2015; Wampler, 2006).
3.1.3. Thermal Properties of Tenax®
Thermal analysis devices included a DSC that measures the energy exchange of the sample (heatflow curve) as well as a thermogravimetric analysis device (TGA) used to detect mass variation of samples at the mg‐scale (weight loss, Figure 9).
Below 500 °C, Tenax® TA and GR were stable (i.e., no mass variation and no heatflow peak observed). Above this temperature, we observed two major phenomena: an endothermic peak around 500 °C and a rapid decrease of sample mass associated with an increase of the heatflow commencing above 530 °C. The exother-mic peak observed at the sample temperature for the two adsorbents (i.e., at 498.17 °C for Tenax® GR and 500.02 °C for Tenax® TA) corresponded to the melting temperature, estimated to be around 500 °C based on previous papers (Gaur & Wunderlich, 1981; Weyland et al., 1970; Wrasidlo, 1971). With regard to the decrease of the mass of samples above 530 °C, we conclude that it resulted from the degradation of the polymer. Thus, the difference between the two adsorbents was visible in terms of temperature of degradation, with the degradation of Tenax® TA starting at a slightly lower temperature (531.87 ± 0.20 °C) than Tenax® GR (543.61±0.20 °C). At 600 °C, Tenax® GR and Tenax® had respectively lost 60% and 69% of their initial sample mass. We also observed that the physical structure of Tenax® was altered. After heating, the adsorbent formed a black solid aggregate.
The variation observed between Tenax® TA and GR can be explained by the composition and the structure of the adsorbents. The Tenax® GR, a mixture of poly(2,6‐diphenylphenylene oxide (PPPO) polymer with graphitic carbon, contains a larger additional source of organic carbon than Tenax® TA, which is completely composed of PPPO. In addition, the specific surface area of Tenax® GR and Tenax® TA are 24 and 35 m3/g,
respectively (Lee et al., 2006). As a result, Tenax® TA is more vulnerable to the temperature because a larger surface is exposed to heat. We note that the variation between TGA‐DSC and GC‐MS analyses can be
Figure 10. Number of molecules (above the three times noise level) produced after short conditioning Tenax® TA (medium grey), short conditioning Tenax® GR (dark grey), and long conditioning Tenax® GR (light grey) as a function of temperature (400 to 600 °C).
explained by the heating rate used for both analyses (5 °C/min and ~20 °C/s, respectively). As the heating rate decreases, it has been shown that decomposition initiation begins at lower temperatures (Sichina, 2011).
One minor phenomenon is noticeable in Figure 9: above the melting temperature, mass lossfluctuation is more important for Tenax® TA and GR. For example, for Tenax® GR, we observed a sudden and temporary increase of mass around 590 °C. Combined with the observation of a dark solid residue in the TGA‐DSC sam-ple holder used to suspend the crucible, we conclude that these variations were caused by the condensation and volatilization of soot.
3.1.4. Effect of Conditioning
As shown in Figure 10, after a long conditioning (24 hr), Tenax® GR released fewer by‐products upon heat-ing, qualitatively speakheat-ing, than after a short conditioning procedure (2 hr). In addition, the quantitative abundance of these by‐products was also reduced, and degradation products were formed at higher tempera-tures after 24 hr of conditioning (with the exception of m‐terphenyl‐2′ol/m‐terphenyl‐4′‐ol, which started to be released at the same temperature (400 °C) regardless of the conditioning duration). In addition, when we compared Tenax® GR conditioned for 2 hr with the Tenax® TA conditioned for 2 hr, we observed that fewer compounds were formed from Tenax® GR regardless of the Tenax® temperature (400 to 600 °C; Figure 10). To summarize, it seems that the decrease of the conditioning duration accentuates the formation of degraded species, and Tenax® TA is more sensitive to thermal degradation than Tenax® GR. Thisfinding is consistent with the results of the TG‐DSC analysis described above.
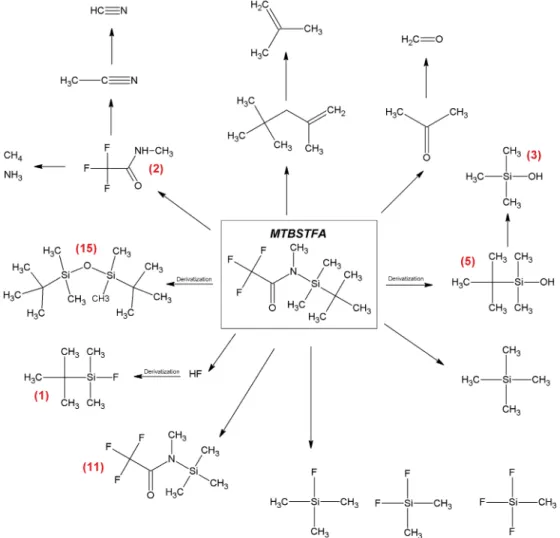
Figure 11. By‐products of the N‐tert‐butyldimethylsilyl‐N‐methyltrifluoroacetamide (MTBSTFA) detected in this study and by Sample Analysis at Mars. Products with a number in brackets correspond to the number of compounds listed in Table 1.
In general, the main by‐products observed from Tenax® were due to the release of residues (impurities intro-duced in the manufacturing process) from the fabrication of Tenax® and also by the degradation of the adsor-bent because of the effect of oxidants (e.g., NOx or O3). Some other by‐products are also due to the emission
of the previous analytes trapped in the Tenax® (Cao & Hewitt, 1994; Lee et al., 2006). The difference between Tenax® GR with short or long conditioning is thought to be due to the better efficiency of the elimination of Tenax® fabrication residues, of Tenax® degradation products at low temperature (<280 °C) and the adsorbed compounds during the storage.
During experiments performed with the SAM instrument on Mars, the maximum temperatures of the injec-tion traps were set at <300 °C, temperatures which are normally below the temperature of degradainjec-tion of Tenax®. However, aromatic chemical species were detected by SAM GC‐MS in various samples, including a large number of molecules likely to be formed from Tenax® ,such as cyclopentene, cyclopentadiene, ben-zene, toluene, chlorobenben-zene, ethylbenben-zene, xylene, phenylethyne, TBDMS‐phenol (from Tenax® and MTBSTFA reaction), styrene, naphthalene, and biphenyl (Ming et al., 2014).
To investigate this further, we also considered factors that may enhance the degradation of Tenax®. First, we analyzed the effect of the derivatization reagent MTBSTFA and solvent DMF. These two reagents are con-tained in SAM derivatization cups and are used for wet chemistry experiments. A leak of MTBSTFA/DMF has been observed in SAM, which could impact the by‐products release of Tenax® (Glavin et al., 2013). Second, we considered the presence of oxidants. It has been demonstrated that the Martian soil contains per-chlorate salts can be decomposed into oxygen, hydrochloric acid, and chlorine (Glavin et al., 2013; Migdał‐ Mikuli & Hetmańczyk, 2008), which also may have an impact on the stability of Tenax® when the molecules come in contact with the adsorbent (Klenø et al., 2002; Lee et al., 2006). While studies have been conducted to define the backgrounds that may be induced by exposure to oxidizing medium on Tenax®, Tenax® has been largely used to analyze atmospheric composition. The experiments reported in the literature thus far focus on the impact of gases and molecules present in the atmosphere, including ozone O3, oxides of nitrogen NOx,
and organic molecules that lead to the production of artifacts. For instance, Jae Hwan Lee (Lee et al., 2006) examined the influence of ozone in contact with the polymer Tenax®, demonstrating the production
Figure 12. Number of detected compounds (above the three times noise level) released by long conditioning Tenax® GR (light grey), long conditioning Tenax® GR mixed with 0.5μl of N‐tert‐butyldimethylsilyl‐N‐methyltrifluoroacetamide (MTBSTFA; medium grey), and long conditioning Tenax® GR with 0.5 μl of mixture of MTBSTFA/dimethylformamide (DMF; 4:1; dark grey) as function of temperature (100–600 °C) and the evolution of the quantity of hydrofluoric (HF) (corre-sponding to the sum of the amount offluorinated compounds formed from HF, that is, TDBMS‐F and diphenyldifluorosilane) detected during Tenax® GR and MTBSTFA experiments.
of some organic compounds similar to those found during our experiments, including phenol and acetophe-none (Klenø et al., 2002; Lee et al., 2006). Finally, the impact of perchlorate on Tenax® was analyzed to deter-mine if this polymer adsorbent could be a source of chlorinated aromatic compounds like the chlorobenzene and dichlorobenzene that have been detected by SAM.
3.2. Impact of the Derivatization Reagent MTBSTFA and the Solvent DMF on Tenax® Degradation at Various Temperatures
As a very reactive reagent, MTBSTFA is able to damage the stationary phase of chromatographic columns by interacting with the silanol groups and increasing column bleed. As the same reactivity is expected when
Figure 13. Possible mechanism of formation of Tri (trimethylsilyl)borate and diphenyldifluorosilane from column stationary phase, borosilicate glass, and N‐tert‐ butyldimethylsilyl‐N‐methyltrifluoroacetamide degradation products.
Table 2
List of the Compounds Detected With GC‐MS Analysis When Heating Mixtures of Tenax® Adsorbents and Perchlorates
No. tR(s) Compound CAS No.
Base peak m/z Long conditioning Tenax® GR Long conditioning Tenax® TA Compounds detected by SAM 1 157.8 Cyclopentene 142‐29‐0 67 N.D. ✓ N.D. 2 243.6 1,3‐Cyclopentadiene 542‐92‐7 66 ✓ N.D. N.D. 3 297 Benzene 71‐43‐2 78 ✓ ✓ ✓ 4 426.6 Toluene 108‐88‐3 91 ✓ ✓ ✓ 5 442.8 1,2,3‐Norcaratriene 4646‐69‐ 9 90 ✓ N.D. N.D. 6 603.6 Benzene, chloro 108‐90‐7 112 ✓ ✓ ✓ 7 637.2 Benzene, ethyl 100‐41‐4 91 ✓ N.D. ✓ 8 657 Xylene 108‐38‐3 95‐47‐6 106‐42‐3 91 ✓ N.D. ✓ 9 676.2 Phenylethyne 536‐74‐3 102 ✓ ✓ ✓ 10 703.8 Styrene 100‐42‐5 104 ✓ ✓ ✓ 11 805.8 Benzene, 1‐ethenyl‐2‐methyl or Benzene, 2‐propenyl or Styrene,α‐methyl or 611‐15‐4 300‐57‐2 98‐83‐9 117 ✓ ✓ N.D 12 840 Benzaldehyde 100‐52‐7 77 ✓ ✓ N.D. 13 885 Phenol, 2‐chloro or Phenol, 3‐chloro 95‐57‐8 108‐43‐0 128 ✓ N.D. N.D. 14 892.8 Benzofuran 271‐89‐6 118 ✓ ✓ N.D. 15 902.4 Phenol 108‐95‐2 94 ✓ ✓ ✓ 16 923.4 951 907.8 Benzene, 1,2‐dichloro or 95‐50‐1 146 ✓ ✓ ✓ Benzene, 1,3‐dichloro or 541‐73‐1 Benzene, 1,4‐dichloro 106‐46‐7 17 945.6 970.2 Benzene, 1‐ethynyl‐3‐methyl or Benzene, 1‐ethynyl‐4‐methyl or 766‐82‐5 766‐97‐2 115 ✓ N.D. N.D. 976.8 Benzene, 1‐propynyl‐ or 673‐32‐5 999 Benzene, 2‐propynyl‐ 10147‐ 11‐2 18 964.8 2‐Chloroethynylbenzene 1483‐82‐ 5 136 ✓ ✓ N.D. 19 1,017 Benzoyl chloride 98‐88‐4 105 ✓ ✓ N.D. 20 997.2 Phenol, 2‐methyl or 95‐48‐7 108 ✓ N.D. N.D. 1,031.4 Phenol, 3‐methyl or 108‐39‐4 Phenol, 4‐methyl 106‐44‐5 21 1,041.6 1,4‐Diethynylbenzene 935‐14‐8 126 ✓ N.D. N.D. 1,159.8 22 1,067.4 2‐Methylbenzofuran or 4265‐25‐ 2 131 ✓ N.D. N.D. 3‐Methylbenzofuran or 21535‐ 97‐7 7‐Methylbenzofuran 17059‐ 52‐8 23 1,083 Benzaldehyde, 2‐chloro or 89‐98‐5 131 ✓ N.D. N.D. 1,092 1,103.4 Benzaldehyde, 3‐chloro or 587‐04‐2 Benzaldehyde, 4‐chloro 104‐88‐1 24 1,099.8 Benzene, 1,2,3‐trichloro or 87‐61‐6 182 180 ✓ ✓ N.D. 1,165.2 Benzene, 1,2,4‐trichloro or 120‐82‐1 1,207.2 Benzene, 1,3,5‐trichloro 108‐70‐3 25 1,117.8 Benzofuran, 5‐chloro‐ or 23145‐ 05‐3 152 ✓ ✓ N.D. Benzofuran, 7‐chloro‐ 24410‐ 55‐7 26 1,138.2 Naphtalène 91‐20‐3 128 ✓ ✓ ✓ 27 1,153.2 1,462.8 Phenol, 2,4‐dichloro or 120‐83‐2 162 ✓ N.D. N.D. Phenol, 2,5‐dichloro or 583‐78‐8 Phenol, 2,6‐dichloro or 87‐65‐0 Phenol, 3,4‐dichloro or 95‐77‐2
No. tR(s) Compound CAS No. Base peak m/z Long conditioning Tenax® GR Long conditioning Tenax® TA Compounds detected by SAM Phenol, 3,5‐dichloro 591‐35‐5 28 1,176 2,2,4‐Trichloro‐1,3‐ cyclopentenedione 88552‐ 47‐0 60 N.D. ✓ N.D. 29 1,178.4 1‐Methylene‐1H‐indene 2471‐84‐ 3 128 ✓ ✓ N.D. 30 1,192.2 Acetophenone 98‐86‐2 105 N.D. ✓ N.D. 31 1,204.2 Benzoic acid 65‐85‐0 105 ✓ ✓ N.D. 32 1,243.2 2,2,4,5‐tetrachlorocyclopent‐4‐ene‐ 1,3‐dione 15743‐ 13‐2 87 ✓ ✓ N.D.
33 1,249.8 Benzoic acid, 4‐chloro 74‐11‐3 139 N.D. ✓ N.D. 34 1,273.2 1,287.6 1,326 Benzaldehyde, 2,3‐ dichloro or 6334‐18‐ 5 139 ✓ N.D. N.D. Benzaldehyde, 2,4‐ dichloro or 874‐42‐0 Benzaldehyde, 2,6‐dichloro or 83‐38‐5 Benzaldehyde, 3,4‐dichloro or Benzaldehyde, 3,5‐dichloro 6287‐38‐ 3 10203‐ 08‐4 35 1,282.2 Benzofuran, 5,7‐dichloro 23145‐ 06‐4 168 N.D. ✓ N.D. 36 1,299.6 2,6‐Dichlorostyrene or 3,4‐Dichlorostyrene 28469‐ 92‐3 2039‐83‐ 0 137 ✓ ✓ N.D. 37 1,309.2 1,386 Acetophenone, 2‐chloro‐ or Ethanone, 2‐(formyloxy)‐1‐phenyl 532‐27‐4 55153‐ 12‐3 105 ✓ ✓ N.D. 38 1,339.8 Naphalene, methyl 90‐12‐0 142 ✓ ✓ N.D. 39 1,355.4 Phthalic anhydride 85‐44‐9 104 ✓ ✓ N.D. 40 1,353 1,357.2 1,415.4 Benzene, 1,2,3,4‐tetrachloro or 634‐66‐2 216 ✓ ✓ N.D. Benzene, 1,2,3,5‐tetrachloro or 634‐90‐2 Benzene, 1,2,4,5‐tetrachloro 95‐94‐3 41 1,364.4 1,638 2,3,6‐Trichlorophenol or 3,4,5‐Trichlorophenol 933‐75‐5 609‐19‐8 196 N.D. N.D. N.D. 42 1,373.4 2‐Chloro‐1,4‐dihydroxybenzene 615‐67‐8 144 ✓ ✓ N.D. 43 1,388.4 2,3,6‐Trichlorophenol 933‐75‐5 196 ✓ ✓ N.D. 44 1,424.4 Biphenyl 92‐52‐4 154 ✓ ✓ ✓ 45 1,452.6 1‐Naphtalenol, 4‐chloro 604‐44‐4 178 ✓ ✓ N.D. 46 1,467.6 2,3,5‐Trichlorobenzaldehyde or 56961‐ 75‐2 207 N.D. N.D. N.D. 2,3,6‐Trichlorobenzaldehyde 4659‐47‐ 6 47 1,479.6 1,540.8 1,552.2 Diphenylmethane or 101‐81‐5 168 ✓ ✓ N.D. 2‐Methylbiphenyl or 643‐58‐3 3‐Methylbiphenyl or 643‐93‐6 4‐Methylbiphenyl 644‐08‐6 48 1,572.6 Pentachlorobenzene 608‐93‐5 250 ✓ ✓ N.D. 49 1,543.8 1,599.6 2,4‐Dichloro‐1‐naphthol or 2050‐76‐ 2 212 ✓ ✓ N.D. 3,4‐Dichloro‐1‐naphthol 5728‐20‐ 1 50 1,576.2 1,777.8 2‐Phenylphenol or 90‐43‐7 170 ✓ ✓ N.D. 4‐Phenylphenol or 92‐69‐3 3‐Phenylphenol 580‐51‐8 51 1,581.6 Dibenzofuran 132‐64‐9 168 ✓ N.D. N.D. 52 1,609.2 Phenylmaleic anhydride 36122‐ 35‐7 102 ✓ ✓ N.D. 53 1,615.2 2,3,4,5‐Tetrachlorophenol 232 ✓ ✓ N.D.
Table 2 (continued)
No. tR(s) Compound CAS No.
Base peak m/z Long conditioning Tenax® GR Long conditioning Tenax® TA Compounds detected by SAM 4901‐51‐ 3 2,3,4,6‐Tetrachlorophenol 58‐90‐2 2,3,5,6‐Tetrachlorophenol 935‐95‐5 54 1,616.4 4‐Chlorophthalic acid 89‐20‐3 138 ✓ N.D. N.D. 55 1,618.8 3,4,5‐Trichlorocatechol 56961‐ 20‐7 212 ✓ ✓ N.D. 56 1,631.4 2‐Chlorobiphenyl 2051‐60‐ 7 188 ✓ N.D. N.D. 3‐Chlorobiphenyl 2051‐61‐ 8 4‐Chlorobiphenyl 20514‐ 62‐9 57 1,650.6 Fluorene 86‐73‐7 166 ✓ N.D. N.D. 58 1,659.6 3‐(4‐Chlorophenyl)‐2,5‐furandione 3152‐15‐ 6 136 ✓ ✓ N.D. 59 1,677 Phenyl‐4‐cyclopentene‐1,3‐dione 51306‐ 96‐8 102 ✓ N.D. N.D. 60 1,685.4 1,851 9H‐Fluoren‐9‐ol 1689‐64‐ 1 181 ✓ N.D. N.D. 61 1,687.8 Diphenylacetylene 501‐65‐5 178 N.D. ✓ N.D. 62 1,693.8 2,5‐Cyclohexadiene‐1,4‐dione, 2‐ phenyl 363‐03‐1 184 ✓ N.D. N.D. 63 1,698 Benzophenone 119‐61‐9 105 ✓ ✓ N.D. 64 1,725 9‐Methylene, 9H‐Fluorene 4425‐82‐ 5 178 ✓ ✓ N.D. 65 1,767 Hexachlorobenzene 118‐74‐1 284 ✓ ✓ N.D. 66 1,777.8 p‐Hydroxybiphenyl 92‐69‐3 170 ✓ ✓ N.D. 67 1,786.2 2‐Hydroxy‐5‐chlorobiphenyl 607‐12‐5 204 ✓ ✓ N.D. 4‐Chloro‐4'‐hydroxybiphenyl 28034‐ 99‐3 2‐Chloro‐4‐phenylphenol 92‐04‐6 68 1,818 Pentachlorophenol 87‐86‐5 266 ✓ ✓ N.D. 69 1,829.4 2‐Phenylindene 4505‐48‐ 0 192 ✓ ✓ N.D. 70 1,837.2 Tetrachlorohydroquinone 87‐87‐6 248 ✓ ✓ N.D. 71 1,892.4 [1,1′‐Biphenyl]‐2,5‐diol [1,1′‐Biphenyl]‐4,4′‐diol 1079‐21‐ 6 92‐88‐6 186 ✓ N.D. N.D. 72 1,916.4 1‐H‐Indene, 1‐(phenylmethylene)‐ 5394‐84‐ 5 203 ✓ ✓ N.D. 73 1,916.4 2,022.6 2‐Phenylnaphtalene 35465‐ 71‐5 204 ✓ ✓ N.D. 74 1,927.8 4‐Hydroxy‐9‐fluorenone 1986‐00‐ 1 196 N.D. ✓ N.D. 75 1,929.6 [1,1′‐Biphenyl]‐2‐ol, 2′,5′‐dichloro 53905‐ 30‐9 238 ✓ ✓ N.D. [1,1′‐Biphenyl]‐3‐ol, 2′,5′‐dichloro 53905‐ 29‐6 [1,1′‐Biphenyl]‐4‐ol, 2′,5′‐dichloro 5335‐24‐ 0 [1,1′‐Biphenyl]‐4‐ol, 3,4′‐dichloro 53905‐ 31‐0 [1,1′‐Biphenyl]‐4‐ol, 3,5‐dichloro 1137‐59‐ 3 76 1,930.8 2‐Dibenzofuranol 86‐77‐1 184 ✓ ✓ N.D. 77 1,948.2 Dichlorodibenzofuran 5409‐83‐ 6 236 ✓ ✓ N.D. 78 1,968 5‐Chloro‐2‐phenylbenzofuran 228 ✓ ✓ N.D.
MTBSTFA is in contact with the Tenax®, we also studied the influence of the MTBSTFA alone versus an MTBSTFA/DMF mixture on the Tenax® GR trap as a function of the trap temperature (100 to 600 °C). 3.2.1. Tenax® and MTBSTFA By‐Products
Thisfirst experiment placed 0.5 μl of MTBSTFA in contact with 10 mg of long‐conditioned Tenax® to observe if the derivatization reagent had any impact on the degradation of Tenax® compared with thermal degrada-tion only when the mixture is heated. The results are presented in Table 1. The heating of the mixture of MTBSTFA and Tenax® lead to the formation of several by‐products of MTBSTFA and Tenax® (thermal degra-dation products and derivatized molecules).
Numerous MTBSTFA by‐products, listed in Figure 11, were formed either by thermal degradation or by reac-tion with water (coming from the ambient atmosphere and from the sample). MTBSTFA dissociated to form 2,2,2‐trifluoro‐N‐methyl‐N‐(trimethylsilyl)‐acetamide (MSTFA); 2,2,‐trifluoro‐N‐methyl‐acetamide;
No. tR(s) Compound CAS No.
Base peak m/z Long conditioning Tenax® GR Long conditioning Tenax® TA Compounds detected by SAM 18761‐ 36‐9 6‐Chloro‐2‐phenylbenzofuran 4521‐05‐ 5 5‐Chloro‐3‐phenylbenzofuran 54923‐ 63‐6 79 2,126.4 2,3‐Diphenylmaleic anhydride 4808‐48‐ 4 178 ✓ ✓ N.D. 80 2,157.6 2,175.6 2,199 p‐Terphenyl 92‐94‐4 230 ✓ ✓ N.D. m‐Terphenyl 92‐06‐8 o‐Terphenyl 84‐15‐1 81 2,184 2,3‐5,6‐Dibenzoxalene 243‐24‐3 218 ✓ N.D. N.D. 82 2,219.4 2,235 2,6‐Diphenylphenol 2432‐11‐ 3 246 ✓ ✓ N.D. 83 2,293.8 2,314.8 2,326.8 Indeno[2,1b]oxine, 2‐phenyl 10435‐ 67‐3 NA NA 244 ✓ ✓ N.D. Dibenzofuran, 4‐Phenyl Dibenzofuran, 1‐Phenyl 84 2,308.8 2,4‐Dichloro‐p‐terphenyl 61576‐ 83‐8 298 ✓ ✓ N.D. 85 2,311.8 4‐Chloro‐p‐Terphenyl 1762‐83‐ 0 264 ✓ ✓ N.D. 86 2,376.6 2,5‐Diphenyl‐1,4‐benzoquinone 844‐51‐9 102 ✓ ✓ N.D. 87 2,400 Cyclopent‐2‐enone NA 279 ✓ N.D. N.D. 5‐benzylideno‐3‐(4‐chlorophenyl)‐ 88 2,455.2 Indeno[2,1b]pyran, 2‐4‐ chlorophenyl)‐ 62096‐ 34‐8 278 ✓ ✓ N.D. 89 2,707.2 2,729.4 m‐Terphenyl, 5′phenyl 612‐71‐5 306 ✓ ✓ N.D. m,m‐Quaterphenyl 1166‐18‐ 3 m,p‐Quaterphenyl 1166‐19‐ 4 o,o′‐Quaterphenyl 641‐96‐3 p,p′‐Quaterphenyl 135‐70‐6 o,p‐Quaterphenyl 1165‐58‐ 8 90 2,761.8 2, 4, 6‐Triphenylphenol NA 322 ✓ ✓ N.D. 91 3,333.6 6,6‐Diphenylfulvene 2175‐90‐ 8 230 N.D. ✓ N.D.
Note. They are presented with their retention times, their CAS numbers, and the base m/z peak of formation detected during experiments concerning the effect of perchlorates salt on the Tenax® adsorbents. A specific column corresponds to the compounds detected by SAM.
trimethylsilanol; 2,2,2‐trifluoro‐N‐methylacetamide; trimethylsilanol; tert‐butyldimethylsilanol; and
1,3‐di‐-tert‐butyl‐1,1,3,3‐tetramethyldisiloxane from 100 °C. In addition, two chemical products were formed as the
result of the reaction of the acidic hydrogens of water with MTSBTFA: tert‐butyldimethylsilanol (mono‐sily-lated water) and 1,3‐bis(1,1‐dimethylethyl)‐1,1,3,3‐tetramethyldisiloxane (bi‐sily(mono‐sily-lated water).
Three other by‐products were observed, tert‐butyldimethylfluorosilane (TBDMS‐F) above 350 °C, diphenyl-difluorosilane above 350 °C, and tris (trimethylsilyl)borate above 100 °C. The detection of the TBDMS‐F sug-gests the formation of hydrofluoric (HF) acid from the thermal degradation of MTBSTFA by‐products (from 350 °C). Indeed, we observed that the abundance of 2,2,2‐trifluoro‐N‐methyl‐N‐(trimethylsilyl)acetamide detected at 600 °C was half the abundance observed at 100 °C. This abundance decrease can be explained by the reactivity of the MTBSTFA and the thermal degradation of MTBSTFA by‐products, which increase with the temperature, leading to the quantitative increase of silylated water compounds and to the produc-tion of other by‐products including HF (see Figure 12). We did not observe the presence of HF (pKa=3.2) by GC‐MS because this compound was too much reactive to be detected, having been derivatized to form tert‐ butyldimethylfluorosilane. We also note that SAM GC‐MS analysis results also indicate the production of TBDMS‐F.
To explain the formation of the diphenyldifluorosilane, we investigated two possible pathways of production. First, we surmised that the diphenyldifluorosilane production could potentially occur though the reaction of HF with diphenyl polysiloxane (from the stationary phase of the column), but this reaction is only possible if a catalyst (e.g., CuF2) is used (Kim & Sieburth, 2007). However, the formation of diphenyldifluorosilane
(Figure 13, right) could also be explained by the reaction between borosilicate glass, diphenyl polysiloxane from the stationary phase of the column, and MTBSTFA by‐products. Borosilicate glass (mostly composed of SiO2‐B2O3) is widely used in chemistry laboratory glassware and was employed to carry the MTBSTFA.
It has been demonstrated that the hydrolysis of the borosilicate glass (e.g., under the action of water) creates a layer of boric acid (H3BO3) on the surface of the glass (Bunker et al., 1986; George, 2015; Leipply et al., 2006;
Peter et al., 2013). The formation of the boric acid has been confirmed in MTBSTFA derivatization experi-ments using borosilicate glass through the detection of derivatized boric acid (e.g., Brault, 2015; Elsila et al., 2008). The borosilicate glass structure was likely altered in contact with atmospheric water, leading to the formation of boric acid. Boric acid could have then reacted with HF formed at 350 °C to produce boron trifluoride (BF3) and tetrafluoroboric acid HBF4(Brotherton et al., 2000). Finally, perflourinated complex
anions like BF4‐ are able to transform many polymers of cyclosiloxanes into diphenyldiflourosilane at 200 °C (Bulkowski et al., 1975; Farooq, 1997, 2000). Hence, diphenylfluorosilane seems to be the result of the reaction between diphenyl polysiloxane andfluoroboric acid.
Concerning the tris(trimethylsilyl)borate, we suspect the boron atom originated from the borosilicate glass used to carry the MTBSTFA (Figure 13), as boric acid B (OH)3is produced from borosilicate glass. In
addi-tion, when boric acid is injected on a Restek Rtx‐20 GC column, it reacted with the stationary phase made of 20% of diphenyl polysiloxane and 80% of dimethyl polysiloxane: tris (trimethylsilyl)borate may be thereby produced (Bünger & Zografou, 2014).
Compared to our experiment on the thermal degradation of long‐conditioned Tenax® GR, only additional molecules, which do not originate directly from the degradation of MTBSTFA, were also formed when MTBSTFA is contacted with long conditioned Tenax (Figure 12). These include cresol, acetophenone, 3‐phe-nyl‐3‐butene‐2‐one, 9‐methylene 9H‐fluorene, and 2,4,6‐triphenylphenol. In addition, the alteration of the conditioned Tenax® GR appeared to be enhanced by the presence of MTBSTFA: the addition of MTBSTFA influences the temperature of release of Tenax® thermal degradation products. In other words, molecules tend to be formed at lower temperatures in the presence of MTBSTFA. This observation might be explained by the aggressive HF formed from the derivatization reagent, which is detected in its derivatized form TBDMS‐F. Indeed, it should be noted that the increase in temperature from 100 to 600 °C increased the quan-tity of silylated HF and that the amount of HF formed could have participated in the degradation of Tenax® GR (Figure 12). Nevertheless, TBDMS‐HF appears only at 350 °C, while the Tenax® degradation starts around 150 °C. Certainly, other mechanisms could stimulate Tenax® degradation in presence of MTBSTFA at lower temperature, but the nature of these processes remains difficult to determinate. Thermal degradation products of Tenax® contain labile hydrogens (i.e., alcohol group), which make them able to react with MTBSTFA via a silylation reaction (i.e., 1‐trimethylsilanol [pKa = 12.5], phenol
[pKa = 9.95], cresol [pKa ~10], and hydroxybiphenyl [pKa ~9]). Nevertheless, the only derivatized Tenax® by‐product detected was TBDMS‐benzoic acid formed between 250 and 600 °C (Table 1). The lack of detection of silylated alcohols could be explained by the low efficiency of the reaction of derivatization of alcohols Indeed, with alcohol, even just 1% of tert‐butyldimethylchlorosilane can act as a catalyzer (Orata, 2012). As the reactivity of alcohol with a silylation reagent follows the order of primary > secondary > tertiary, the reactivity of our alcohol could be decreasing as a result. Then, the detection of derivatized benzoic acid would result from better efficiency of the derivatization reaction of carboxylic acids compared to alcohols under the experimental conditions used or via the contamination of the sample, as the benzoic acid‐TBDMS was detected in the blank but in smaller quantities.
3.2.2. Effect of MTBSTFA/DMF Mixtures on Tenax®
The results of the experiment of exposing Tenax® GR to 0.5μl of a mixture MTBSTFA/DMF (4:1), at various temperatures, are presented in Table 1.
Adding DMF to MTBSTFA slightly decreased the temperature of Tenax® degradation and led to the produc-tion of fewer numbers of molecules from the Tenax® GR alteraproduc-tion compared to the previous experiment with MTBSTFA alone (Figure 12). For instance, the presence of DMF in the mixture inhibited the formation of compounds includingfluorene, 4‐methyl‐2‐phenylphenol, 4‐phenyl‐4‐cyclopentene‐1,3‐dione, 9‐methy-lene‐9H‐fluorene, 1‐benzylnaphthalene, and 2,4,6‐triphenylphenol. The addition of DMF inhibited the impact of MTBSTFA degradation products on Tenax® GR. The polymer appears to be more thermally stable with DMF/MTBSTFA mixture instead of MTBSTFA alone, as its degradation started at 500 °C (versus 200‐ 250 °C for Tenax® GR; see Table 1).
Previous studies using HF and DMF mixtures demonstrate that HF is more reactive in presence of aprotic solvents such as DMF or DMSO (dimethyl sulfoxide) (Harraz et al., 2005; Kim et al., 2009). The aprotic sol-vent increases the dissociation reaction rate of HF, freeing then the anions (F‐and HF2‐) to react are free to
react with Tenax® GR. However, this was opposite of the phenomenon we observed. These results may be because DMF supports the derivatization reaction (Buch et al., 2006), leading to a rise in the conversion of MTBSTFA into 2,2,2‐trifluoro‐N‐methylacetamide and avoiding the formation of HF. This hypothesis was supported by the lack of detection of TBDMS‐F during this experiment.
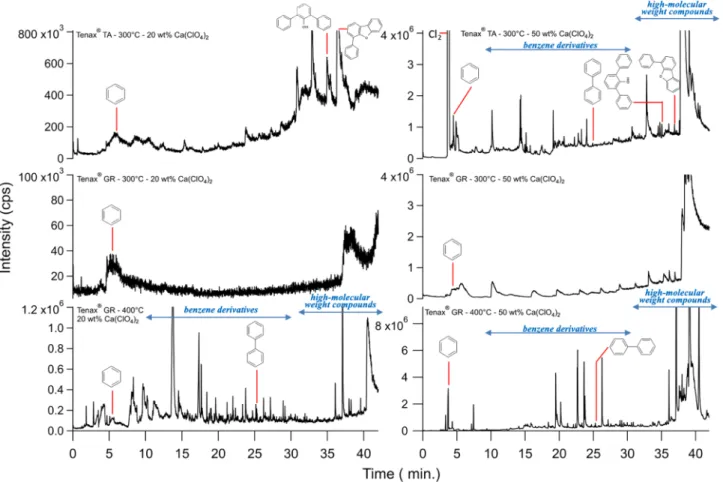
Figure 14. Chromatogram obtained on a RTX‐5sil‐MS (Restek) column after analysis of a mixture of 25 mg of Tenax® TA and 12 mg of calcium perchlorates (32wt%), without the additional oven, at 400 °C (the numbers correspond to those presented in Table 2). The compounds number in red correspond to
chlorinated species. The shaded part corresponds to all the compounds unable to be seen by Sample Analysis at Mars due to their high retention times. Temperature program: 35 °C hold for 8 min then 7 °C/min up to 300 °C. Then isotherm at 300 °C for 10 min.
3.3. Effect of Calcium Perchlorate Salts on Tenax® TA and GR 3.3.1. Tenax® and Calcium Perchlorates By‐Products
The presence of perchlorates and chlorates in the Martian soil has been established at several places on Mars. In order to observe and list all the potential by product of the reaction of perchlorate on Tenax® we have used much more perchlorate that the amount detected on Mars.
Calcium perchlorate salts are decomposed during soil pyrolysis. When they are heated, they are decomposed to form calcium chloride (CaCl2). Then, at high temperature, in contact with water, the CaCl2is transformed
into HCl (Glavin et al., 2013; Migdał‐Mikuli & Hetmańczyk, 2008) as described below: Ca ClOð 4Þ2; 4H2O→ Δ 4H2Oþ Ca ClOð 4Þ2 (1) Ca ClOð 4Þ2 → Δ CaCl2þ 4O2 (2) 4CaCl2 → H2O T>450°Cð Þ Ca4Cl6Oþ 2HCl (3)
Adapted from Glavin et al. (2013) and Migdał‐Mikuli and Hetmańczyk (2008).
The presence of O2 and HCl trigger the Deacon reaction, which produces chlorine (Cl2) and H2O
(Jarmohamed & Mulder, 1983; Lewis, 1906; Magistro & Cowfer, 1986). 2HClþ1
2O2 ↔
Δ
H2Oþ Cl2 (4)
These by‐products of perchlorates have an impact on the degradation products of Tenax®. In the course of the Tenax® and perchlorates direct contact experiments at 400 °C, 30 oxidized molecules and 39 chemical species
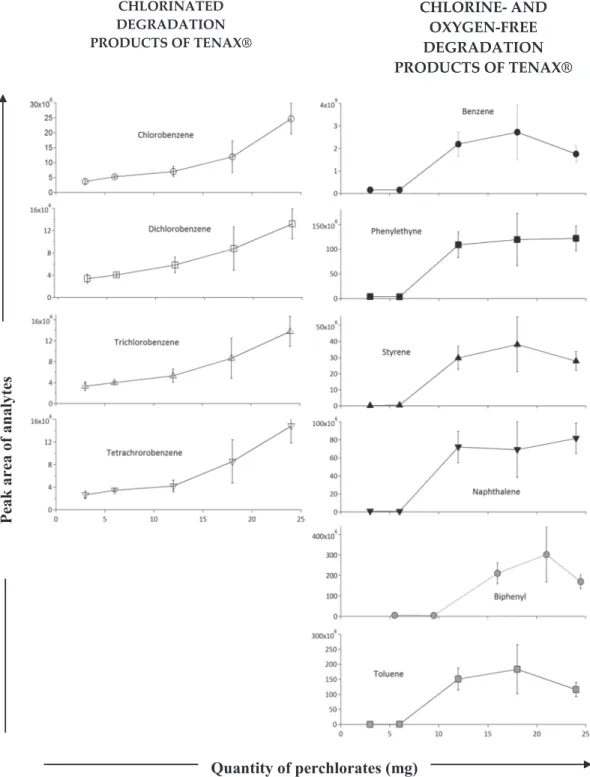
Figure 15. Number of molecules detected (above the three times the background noise level) by the gas chromatograph‐ mass spectrometer analysis of products released by thermal decomposition of Tenax® GR mixed with several amounts of calcium perchlorates at 400 °C. These products have been classified according to the thermal degradation products (light grey), oxidation (medium dark), and chlorination (dark grey).
containing chlorine were detected in addition to 22 products from thermal degradation. From the literature, no HCl is observed at lower temperatures than 450 °C (equation 3) when pure calcium perchlorate is heated alone (Cannon et al., 2012; Migdał‐Mikuli & Hetmańczyk, 2008; Sutter et al., 2015). Here, however, we observe chlorination of Tenax® at lower temperature. The difference with simple degradation of Ca‐perchlorate is that in our experiments we have complex organic compounds (Tenax®) present, which can slightly change the release temperature of HCl in presence of water, shifting it at lower temperature. This, for example, is the case when we compare the O2releasing peak from lab to the O2released peak
from SAM experiment at Gale Crater (Sutter et al., 2015).
The list of all molecules detected in the experiments performed on the chemical reactivity of Tenax® in direct contact with calcium perchlorates is shown in Table 2.
Figure 14 shows a chromatogram of the analysis of 25 mg of Tenax® TA mixed with 12 mg of Ca (ClO4) 2(~32wt%).
During this experiment, a mixture of Tenax® and perchlorates was heated to 400 °C, a higher temperature than used in SAM (300 °C), in order to observe Tenax® and calcium perchlorate by‐products (Table 2). There were three groups of compounds generated by the degradation of Tenax® GR in the presence of cal-cium perchlorates: Tenax® GR degradation by‐products, oxidized molecules and chlorinated compounds. Figure 15 shows the evolution of the number of Tenax® by‐products, above the 3 times the background noise level, as a function of the amount of perchlorates. The more perchlorates there were, the more we observed by‐products from the degradation of Tenax® GR. This observation is explained by both the catalysis of the initiation and propagation of Tenax® GR degradation by perchlorate degradation products and by their reac-tivity with Tenax® GR by‐products.
As seen previously, decomposition products are not only released by the simple decomposition of Tenax®. They could also come from the degradation of the polymer propagated due to the presence of oxygen. Without O2, the propagation of degradation occurred through hydrogen transfer or depolymerization.
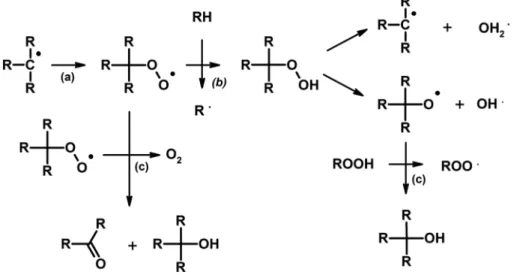
With O2, peroxyl radicals formed (Figure 16a), which supported the propagation of polymer degradation
(Figure 16b) (Ilie & Senetscu, 2009; Yousif & Haddad, 2013). Finally, this decomposition of Tenax® GR led to the formation of molecules by polymer degradation propagation due to the presence of O2(e.g., benzene)
as well as the oxidation of compounds that contain oxygen atoms (e.g., benzoic acid).
In the experiments, we also observed molecules formed by the oxidation of Tenax® degradation products, including alcohols, aldehydes, carboxylic acids, and ethers. The oxidation by O2formed peroxyl radical from
Tenax® polymer that initiated the formation of molecules with alcohol and carbonyl groups as shown on
Figure 16. Mechanism of degradation of organic matter due to the presence of oxygen, which leads to an increase of the propagation of the degradation (a) and to the production of alcohols, carbonyls (b), and phenylperoxyl radical (c).