HAL Id: hal-01292772
https://hal.archives-ouvertes.fr/hal-01292772
Submitted on 8 Dec 2016
HAL is a multi-disciplinary open access
archive for the deposit and dissemination of
sci-entific research documents, whether they are
pub-lished or not. The documents may come from
teaching and research institutions in France or
abroad, or from public or private research centers.
L’archive ouverte pluridisciplinaire HAL, est
destinée au dépôt et à la diffusion de documents
scientifiques de niveau recherche, publiés ou non,
émanant des établissements d’enseignement et de
recherche français ou étrangers, des laboratoires
publics ou privés.
sustainability of natural risk management strategies in
urban areas
A. M. Edjossan-Sossou, O. Deck, M. Al Heib, T. Verdel
To cite this version:
A. M. Edjossan-Sossou, O. Deck, M. Al Heib, T. Verdel. A decision-support methodology for assessing
the sustainability of natural risk management strategies in urban areas. Natural Hazards and Earth
System Sciences, European Geosciences Union, 2014, 14 (12), pp.3207-3230.
�10.5194/nhess-14-3207-2014�. �hal-01292772�
www.nat-hazards-earth-syst-sci.net/14/3207/2014/ doi:10.5194/nhess-14-3207-2014
© Author(s) 2014. CC Attribution 3.0 License.
A decision-support methodology for assessing the sustainability of
natural risk management strategies in urban areas
A. M. Edjossan-Sossou1,2, O. Deck1, M. Al Heib2, and T. Verdel1
1Université de Lorraine, GeoRessources, UMR 7359, Ecole des Mines de Nancy, Campus Artem, CS 14234,
Nancy CEDEX, 54042, France
2INERIS Nancy, c/o Ecole des Mines de Nancy, Campus Artem, CS 14234, Nancy CEDEX, 54042, France
Correspondence to: A. M. Edjossan-Sossou ([email protected])
Received: 5 December 2013 – Published in Nat. Hazards Earth Syst. Sci. Discuss.: 14 January 2014 Revised: 15 October 2014 – Accepted: 3 November 2014 – Published: 4 December 2014
Abstract. This paper attempts to provide a decision support framework that can help risk managers in urban areas to im-prove their decision-making processes related to sustainable management. Currently, risk management strategies should no longer be selected based primarily on economic and tech-nical insight. Managers must address the sustainability of risk management by assessing the impacts of their decisions on the sustainable development of a given territory. These as-sessments require tools that allow ex ante comparisons of the effectiveness and the likely economic, social and ecological impacts of the alternative management strategies. Therefore, this paper reports a methodological and operational frame-work, which aims to incorporate sustainability principles in a particular decision by taking all the dimensions that affect sustainability into account. This paper is divided into two main parts: one on the theoretical aspects of the proposed methodology and the other on its application to a flood risks management case in a municipality located in Meurthe-et-Moselle county (France). The results of the case study have shown how the methodology can be suitable for determining the most sustainable decision.
1 Introduction and background
In this paper, we propose a framework to examine the sus-tainability of risk management measures. The capacity for risk response toward natural hazards exists within soci-eties to different degrees. Various mechanisms like “land-use planning”, “financial compensation and insurance”, “aware-ness raising”, “strengthening of early warning systems”, and
“structural enhancement of buildings” are some of strategies deployed to manage prevalent natural risks. However, not all responses are sustainable (Tompkins and Adger, 2004). Planners continue unsustainable practices because they do not sufficiently factor sustainability principles into their man-agement decisions. Consequently, those decisions engender conflicts between economic and social/environmental inter-ests or prove unacceptable under societal/ecological stan-dards. A consistent use of this framework would improve the adequacy assessments used under different management strategies or combinations of strategies, using sustainability principles.
Urban areas are complex systems through their people concentration, growing population, role as economic activi-ties drivers, architectural structures, water and electric power supply systems, and communications networks. Unfortu-nately, many of these features that define and make cities attractive also constitute their critical problems. These fea-tures contribute to render cities increasingly vulnerable to threats from various kinds of risks (McBean and Henstra, 2003). Cities experienced risks from terrorist attacks, crimi-nal activities, industrial accidents, transportation troubles, in-frastructure failures, public health emergencies, and natural hazards (e.g. earthquakes, floods, grassland fires, landslides, tornadoes).
In recent years, cities have become extremely vulnerable to the latter events (Hansson et al., 2008). They have faced many catastrophic events due to natural hazards, which re-sulted in significant levels of casualties and economic dam-ages. Those events also caused tremendous disruptions to cities socio-economic activities, and/or to their environment.
As such, these disasters have highlighted the vulnerability of urban areas to natural risks all over the world. There is a growth of risks due to natural hazards, and accordingly, the losses created by those hazards have become increasingly serious. Throughout the past years, natural disasters such as floods in Vaison-la-Romaine (France, 1992), European heat wave (2003), hurricane Katrina in United States (2005), earthquake in Haiti (2010), windstorm Xynthia and sea surge in La Faute-sur-Mer (France, 2010), earthquake and tsunami in Japan (2011), and central European flood (2013) remind us the increasing losses, which urban areas are facing from nat-ural hazards. It is evidence that these losses can compromise socio-economic development for years (Faber, 2010; Ni et al., 2010). Consequently, the management of risks due to nat-ural hazards can be considered “a specific element of
sustain-able development” (Peltonen, 2006; Knott and Fox, 2010).
Therefore, one of the key challenges for cities is to reduce their economic, social and ecological vulnerability to natu-ral hazards and to manage their response to those hazards (in order to reduce hazard occurrence as well as to lessen their intensity and/or spatial extent) because their future will depend on strategically planned risk management policies. However, the current approach adopted to manage natural risks only focuses on the financial and technical concerns and appears out-of-date. Critics argue that although this strat-egy may reduce losses in the short term, it has failed to meet this goal in the long term (Degg, 1998; Mileti, 1999) because natural risk is a complex problem that transcends technical and economic issues. A weakness of the traditional way of managing urban natural risks is the static reasoning of most of the methods for assessing management measures impacts while cities are temporal changing areas. Given these obser-vations, innovative substitutes to the technocratic ideology are needed (Mitchell, 1998). A particularly interesting option consists of a comprehensive approach that endows cities at risks with strategic pathways to address sustainability (Degg, 1998; Glavovic, 2010), and the later is an emerging issue in the risk management field.
As sustainability is a term that has quite a broad conno-tation, there is also fuzziness inherent in the concept of sus-tainability related to risk management so that interpretations differ for researchers. In practice, sustainability in the con-text of risk management could mean placing greater empha-sis on integrating the profitable results of risk management with the standards of sustainable development of a given ter-ritory through a holistic perspective. It includes initiatives, which allow management activities to contribute to the min-imisation of risk losses, alleviation of poverty, enhancement of social equity as well as quality of life of people, growth of community engagement and involvement, maintain and im-provement of natural resource base as a whole over long peri-ods of time. Therefore, establishing sustainable risk manage-ment practices has become necessary (Di Mauro et al., 2006). Accordingly, the traditional risk management approach has been rethought through efforts to integrate non-technical
as-pects such as socio-cultural, environmental, and governance-related issues (Wurbs, 1996; Putri and Rahmanti, 2010).
Addressing the sustainability of risk management activ-ities (prevention, mitigation, response, and recovery) has gathered momentum, as indicated by the numerous studies (see for instance Mileti, 1999; Kundzewic, 2002; Galloway, 2004; Scottish Executive, 2005; Werritty, 2006; Agrawala, 2007; Kang et al., 2013) or initiatives (Hyogo Framework for Action, European Flood Directive, different projects such as FLOODsite, LiveWithRisk, CapHaz, etc.). Its significance has been recognised by several nations (Australia, UK, Ger-many, Japan, Bangladesh, etc.), and international organisa-tions (United Naorganisa-tions, European Union, Asian Disaster Pre-vention Centre, etc.) around the world.
Due to this focus on sustainable risk management, man-agers must be able to measure performance in this area be-cause many studies indicate that sustainability assessment is required to increase the diffusion of sustainable activi-ties and sectors. Measuring the degree of sustainability of risk management activities will focus on the assessment of how effective the goals regarding territorial defence against risk, greater economic dynamism, social justice, and preser-vation of natural/cultural resources are or will be achieved. Therefore, to foster their efforts to shift toward this new approach, formal appraisal procedures must be introduced to the decision-making process, requiring “the existence of tools, instruments, processes, and methodologies to mea-sure performance in a consistent manner with respect to pre-established standards, guidelines, factors, or other criteria” (Poveda and Lipsett, 2011).
Finding an accurate framework to assess the sustainabil-ity level of future and the existing decisions has become an important issue. A review of literature shows that some methodologies and tools are available to assist managers in the sustainable risk management field (Turner II et al., 2003; Freedman et al., 2004; Achet and Fleming, 2006; Kang et al., 2013). However, most of these tools are either specific to a hazard (mostly flood and coastal hazards; see McGahey et al., 2009), based on a mono-criterion approach, consid-ering only one aspect of sustainability (e.g. environmental impact assessment, life cycle assessment, social impact as-sessment, cost-effectiveness analysis; see Singh et al., 2012), or do not provide specific criteria and/or indicators among the few methods that account for the different aspects of sus-tainability. At our knowledge, although these tools can guide sustainable risk management, none of them are general, inte-grated theoretical tools that provide the proper set of criteria and indicators for assessing the sustainability of natural risk management in urban areas (Kundzewicz, 2002).
Even characteristics (physical phenomena, measurement, terms associated with, etc.) differ from one hazard to an-other; it is helpful to have a commonly adopted scheme for fostering sustainability in the risk management process. Such a scheme must be an inclusive framework, encompass-ing generic and particular indicators/parameters so that some
of technical indicators/parameters should be specific to the treated hazard.
The specific purpose is to support sustainable natural risk management by guiding the assessment of potential sustain-ability during management decisions. This paper, therefore, proposes a methodological and applicative framework that is built from a review of the sustainability literature. Such a framework is supposed to provide key information that will assist decision-makers in choosing the most sustainable risk management decision. This proposal is within the scope of the INCERDD research project (prise en compte des INCER-titudes pour des Décisions Durables) that seeks to provide a methodology that accounts for the uncertainties within the sustainable decisions in urban areas. The content of this pa-per centres on two key parts. The first part is organized in sequential sections of (Sect. 2) a presentation of the concep-tual framework of sustainable risk management, (Sect. 3) a general introduction to multi-criteria decision-making tech-niques, and (Sect. 4) a description of the proposed methodol-ogy. In the second one, there are two sections, which are de-voted (Sect. 5) to briefly depict the case study, and (Sect. 6) to comment the results of the case study. Then, some conclud-ing remarks and perspectives for further research are drawn in the last section.
Part 1: Theoretical aspects
The following sections discuss theoretical aspects surround-ing the suggested methodology for assesssurround-ing the sustainabil-ity of natural risk management decisions in urban areas.
2 Definition and principles of sustainable risk management
Understanding the sustainable management of risk associ-ated with natural hazards requires foremost the explanation of the key concepts: risk, disaster, hazard, vulnerability, and risk management. Due to the importance of terminology, al-though there is no single definition for those concepts, the following definitions based on the United Nations Office for Disaster Risk Reduction (UNISDR, 2009) terminology on disaster risk reduction should be adopted in this paper. Risk could be defined as the result of the interaction, in space and time, between hazardous events and vulnerability of the ex-posed elements of a territorial system. In such an interac-tion, risk represents the expectation value of potential con-sequences associated with the occurrence of a given hazard, where the characteristics of the hazard and the vulnerability level of the endangered system determine the types and levels of losses. A risk that occurs may trigger a disaster when local capacity to respond to this risk is overwhelmed and outside assistance is needed. Disaster could be defined as a serious disruption of the functioning of the impacted system due to
the amount of damages suffered which exceeds the ability of the system to cope using its own resources.
Hazards, in the context of natural risks, are physical phe-nomena (single, multiple or concatenated) of natural origin that may potentially cause injury or loss of life, property damage, socio-economic disruption, and environmental de-terioration. Floods are the most common and threatening nat-ural hazards for urban areas (Vanneuville et al., 2011). Each year, the greatest natural hazards damages result from flood-ing: their economic impact is valued in the billions of US dollars annually. Vulnerability of exposed systems to natu-ral hazards is an integnatu-ral factor encompassing physical, eco-nomic, social, political and environmental aspects that allows an understanding of the real extent of risk. It depends both on the exposure of people, their livelihoods, their support infras-tructures and services to hazards, and on their tendency (sen-sitiveness, fragility, lack of resilience) to suffer damage when impacted by hazards. Risk management is a systematic pro-cess of preparing a territorial system to cope with the adverse effects of risk through actions for prevention, mitigation, pre-paredness, emergency response, recovery, and lessons learn-ing through feedback. It includes all policies, strategies, and measures that aim to minimise potential losses by either less-ening the intensity as well as the spatial extent of hazards or reducing the vulnerability of the elements at risk.
Nowadays, the challenges for risk-managers are not only to limit the costs of ensuring territorial protection against risk and to reduce the risk to people and their assets; they also relate to the wider consequences of risk management deci-sions to the people’s well-being, the political organisation, and the environment. When considering such neglected as-pects, practitioners could make decisions not only based on the effectiveness and economic viability of measures but also on the assessment of environmental, institutional, and social benefits and costs. Where to locate infrastructural projects, how their construction affects land use, ecological system, and public awareness, which institutional functioning and or-ganisational arrangements for their better social acceptance are some of factors that can significantly influence their ex-pected impacts. The added benefits of the sustainable man-agement approach are to avoid the destruction of the socio-ecological fabric of territories contrary to the current ap-proach that seems to offer less incentive to arouse active par-ticipation of defence structures beneficiaries.
While sustainability is becoming a central goal for policies in the risk management sector, there is no common or stan-dard definition of sustainable risk management. Individuals may understand this concept differently. Even in the liter-ature, definitions are scarce. Consequently, because studies of sustainable natural hazard management are usually flood-specific (this broader emphasis is because flooding is the most important and the costliest natural disaster all around the world), we may first refer to the definition given by the Scottish National Technical Advisory Group on Flooding Is-sues (NTAG). Sustainable flood management is defined as
a management that “provides the maximum possible social and economic resilience against flooding, by protecting and working with the environment, in a way which is fair and affordable both now and in the future” (Scottish Executive, 2004). Sustainable risk management can be defined as the minimisation of damage caused by natural hazards and/or the enhancement of resilience in both people and buildings toward these hazards to promote economic efficiency, social well-being and equity, as well as environmental improve-ments in the long term. This general definition is consis-tent with that adopted by this paper and proposed by Saun-ders (2010b): sustainable risk management “ought to reduce, or at minimum not increase, community vulnerability and disaster recovery costs to levels that do not compromise other public objectives nor burden future generations”. This defini-tion argues that in addidefini-tion to ensuring risk prevendefini-tion, mit-igation or recovery, the additional consequences of imple-mented measures also require careful consideration within the complex economic, technological, political, social, and environmental urban aspects (Kenyon, 2007).
Therefore, this paper adheres to the principles guiding sustainable risk management processes that were proposed by Mileti (1999) regarding the key components for sus-tainable hazard mitigation: (1) maintaining and enhancing the environment; (2) maintaining and enhancing the qual-ity of life; (3) fostering local resilience toward and re-sponsibility for disasters; (4) recognising that vibrant lo-cal economies are essential; (5) identifying and ensuring inter- and intra-generational equality; and (6) adopting a consensus-building approach beginning at the local level through local participation.
Specifically, any sustainable management measure re-quires an interdisciplinary analytical and operational ap-proach that must be combined with a more flexible and participatory institutional framework and involve a wider range of stakeholders. This approach also requires better re-versibility, common acceptance, and environmental friendli-ness (Kundzewicz, 2002). Furthermore, this approach con-siders the historical and institutional perspectives, as well as the socio-economic, environmental, and cultural aspects (Turner et al., 1999). Alternative strategies should focus on reducing natural hazard losses and contribute to the broader goal of sustainable development (Klijn et al., 2009).
The ultimate goal for every sustainable risk management process is to maximise the outcomes because the losses due to natural disasters increase due to human decisions and in-vestments (Hansson et al., 2008). Consequently, this paper introduces a methodology based on an indicator-based tool for examining whether risk management strategies will point toward sustainability during the decision-making process.
3 Multi-criteria decision-making techniques
Decision-making is supported by several techniques clas-sified in two main categories: single criterion (e.g. cost-benefit analysis), and multiple criteria (e.g. multi-criteria de-cision analysis, hereinafter MCDA) techniques. The latter are used when dealing with complex decisions. MCDA guides decision-makers “through an evaluation of potential decision options using explicit profiles of their advantages and dis-advantages across a range of distinct dimensions” (Dolan, 2010). MCDA consists of a set of methods that typically aim at structuring and simplifying complex problems, facilitat-ing dialogue between stakeholders, and legitimisfacilitat-ing the final decision (Roy, 2005). Carrying out MCDA obeys the follow-ing basic path: (1) establish the decision context; (2) spec-ify evaluation criteria/sub-criteria; (3) identspec-ify alternative op-tions; (4) calculate a total performance (including scoring, weighting, aggregation) for each option; and (5) rank options accordingly (Farley et al., 2005).
Sustainable natural risk management is a multi-dimensional concept that involves a number of stakeholders with multiple conflicting objectives or priorities. Using MCDA, a well-acknowledged sustainability assessment technique, will help make better choices when facing such a management decision. However, there are several MCDA methods (analytical hierarchy process – AHP, ELEC-TRE, MACBETH, multi-attribute utility theory – MAUT, PROMETHEE, TOPSIS, etc.), and each of them summarises final results differently. According to the underlying decision rule or theory, some methods indicate an optimal option (optimisation), while some rank options through a pairwise comparison regarding each criterion (outranking), and others identify acceptable or non-acceptable options (aspiration- or goal-oriented perspectives). Choosing one method instead of another depends on users’ requirements and expectations, as well as on the method ease of understanding. The easier it is to understand the method, the better decision-makers will use it.
This paper attempts to offer a framework to sustainable risk management decision-making on the basis of an MCDA conceptual scheme without making the choice of a specific MCDA method. Thus, it is elaborated to be simple, easy to understand, and generic to allow all underlying decision rules ensuring its suitability to assess the sustainability of natural risk management decisions in any context.
4 Methodology for assessing the sustainability of risk management
Sustainability assessment helps to evaluate sustainability level in risk management policies. It is an important tool in estimating overall possible consequences of projected management decisions on local sustainable development. Sustainable assessment advises decision-makers on what
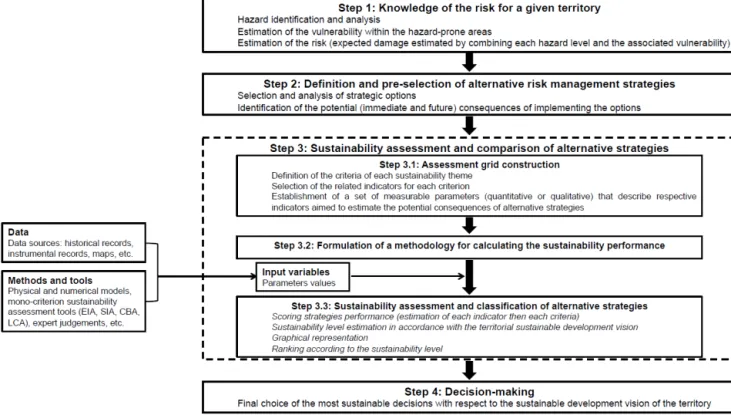
Figure 1. Theoretical overview of the decision-making process for sustainable risk management (source: authors).
decisions should (or should not) be adopted, and under what conditions.
As illustrated in Fig. 1, the standard approach to sustain-able decision-making may be outlined as a sequential pro-cess with four major stages. Moreover, to support sucpro-cessful decisions regarding risk management needs, among other re-quirements, “a common conceptual framework which seeks to understand and formalise the full range of issues that stakeholders may pose” and “a supporting methodological framework which is a translation of the conceptual frame-work into an analysis process containing tangible algorithms, methods and model interactions” must be introduced (McGa-hey et al., 2009). Therefore, the suggested evaluation frame-work should represent the third stage, and its construction can be subdivided into three tasks: (1) selecting sets of cri-teria and indicators, (2) formulating a methodology to evalu-ate the sustainability performance, and (3) defining decision rules for selecting the most sustainable decision.
The methodology followed in this paper is based on a lit-erature review of the indicator-based approaches for sustain-ability assessment, as described below after specifying some methodological choices. These choices concern the relevant spatial and temporal scales considered during the sustainabil-ity assessment while using this tool.
4.1 Spatial and temporal scales
Spatial and temporal scales are very important when “at-tempting to put sustainability into practice, or in gauging the level of sustainability” (Ko, 2005).
The diverse spatial scales have different specific factors that influence the risk management decision process. Ac-cording to Graymore et al. (2010), the current sustainabil-ity assessment methods used at the global, national and state scales are not entirely effective at fulfilling their goal, accord-ing to these spatial scales. The indicators are defined on the chosen spatial scale, and they capture only synoptic aspects for the scale on which they are applied.
As territory is a hierarchical structuring system with dif-ferent spatial scales (neighbourhood, municipality, county, region, nation) delineated by their administrative boundaries so that risks of natural origin are nested at those various lev-els, it is crucial to specify on which scale sustainability of the management is to be evaluated (Fekete et al., 2010; Kien-berger et al., 2013). According to their specific character-istics, each scale (micro-, meso-, and macro-levels) has to be treated separately: a variable with specific strength at one scale could seem inappropriate at another. For instance dam-age estimation mainly relies on assets typology at micro level and land use at meso-level. An explicit description of the spa-tial scale in the conceptualisation of the methodology helps to identify accurate sustainability indicators/parameters, to determine how indicators/parameters on different levels can
benefit from each other, and to detect which constraints of data collection have to be faced. In general, the preciseness of analysis increases at small scale and is more generalised towards the more aggregated scale.
It is observed that small-sized hazardous events are more frequent, as consequences it is at the fine spatial scale where theorising a methodology becomes useful for risk-managers. Hence, this paper uses municipalities, which are a smaller urban spatial unit, as a meaningful or suitable scale that could lead to a more accurate framework and assist the fur-ther adaptation and application to the ofur-ther spatial scales. The focus is on typical French communities with less than 2000 people (INSEE)1and an average area of approximately 20 km2.
According to Fekete et al. (2010), in comparison to the upper scales the main pros of this scale are more detailed information, a better capture of complexity of phenomena, the use of participatory methods for data collection, a higher availability of data related to one item, a lower level of uncer-tainty, etc. Contrariwise, it is limited by loss of information while up-scaling the assessment.
Concerning the temporal orientation, this framework obeys a prospective logic because it is designed for ex ante assessments of decisions; it might be used to examine the sustainability of existing management measures. Because the consequences and impacts of decisions can vary over time, their sustainability must be assessed on different temporal scales. Some effects can occur immediately after implement-ing the decision or only after a longer or shorter interval. First, this paper argues that the temporal scale should involve the entire life or mission span of the risk management deci-sions. Second, planning those decisions within the context of sustainability entails planning beyond 50 or 100 years (Saun-ders, 2010a), requiring plans for future generations. Indeed, the decisions “should not only be taking short- and medium-term into account but also the (very) long-medium-term, thus leading to more sustainable risk decisions” (Genserik, 2012).
Building on the evidence that accounting for different tem-poral perspectives can improve the level of sustainability, this framework is intended to address the assessment as a con-tinuum (ranging from the short to the long term) when pre-dicting the variability of the sustainability over time. This tool should facilitate strategic planning within sustainable risk management in the long term while considering the dy-namic behaviour of the factors that affect the sustainabil-ity over time, such as the expected territorial dynamic; this factor helps determine the future of the territory and estab-lish risk management requirements. In the case study, only one timescale assessment was undertaken. However, sev-eral timescale assessments should be performed in practice to appraise the evolution of the sustainable strategies over
1According to the INSEE (Institut National de la Statistique et
des Etudes Economiques), the average population of the most of French communities is about 1750 inhabitants on 1 January 2008.
time and to determine the most sustainable decision over time, thereby generating relevant sustainable decisions for the future.
4.2 Criteria identification and indicators selection The main objective is to elaborate an indicator-based grid. Criteria and indicators can be selected using a top-down or a bottom-up approach (Franco and Montibeller, 2009; Weiland et al., 2011). Both approaches involve decomposing a com-plex decision into a hierarchical structure that represents the sustainability performance and is built from the input vari-ables situated at the bottom level of the pyramid.
The top-down method is used to break down the sustain-ability concepts into dimensions, criteria and indicators. This deductive approach facilitates the following: the theoretical description of the objectives and the rigorous collection of the corresponding criteria and indicators from the literature. This approach should ensure that the correct conceptual in-formation is retained with the common criteria and indicators of generic sustainability.
The bottom-up approach is used to select criteria and indi-cators that match the contextual requirements from the spe-cific field whose sustainability will be assessed. This induc-tive approach is often rooted in the concerned field and aims to ensure that specific information related to the field at hand is accounted for. It starts with the identification of the po-tential consequences and effects of the field. Once the set of consequences and effects is defined, they can be grouped into indicators based on similarities. Indicators can then be grouped into criteria. Finally, the criteria can be grouped into objectives. The potential consequences and effects serve as benchmarks for the validation of which indicators and cri-teria are suitable to fulfil the sustainability concerns of the targeted field.
In this paper, a hybrid approach has been applied, comple-mentarily combining bottom-up and top-down approaches. The process used to construct the assessment grid involves three steps. The first step involves identifying the criteria based on the objectives of sustainable risk management. The top-down approach was applied to identify the appropriate criteria using a combination of the principles for sustainabil-ity assessment (Gibson et al., 2005; Gibson, 2006) and those for achieving sustainable risk management Mileti (1999). The following five criteria were proposed:
– Technical and functional effectiveness addresses the ca-pability of measures to fulfil the primary function of risk management, providing protection against natural risks and reduce losses from those risks.
– Economic sustainability is used to obtain the most out of measures with fair economic outcomes (efficiency and affordability).
– Social sustainability addresses the social and societal aspects, such as the community benefit and fair distri-bution/contribution.
– Environmental sustainability assesses the implementa-tion of measures relative to all species, habitats, and landscapes.
– Institutional sustainability addresses the issue of gover-nance (norms, values, and practices).
The second step concerns the identification and selection of performance indicators that highlight the different aspects of sustainable natural risk management depicted by the five cri-teria. Sustainability indicators depend strongly on their tar-get field. In this paper, they were suggested according to their ability to describe the pressures of risk management on urban sustainability. The “urban areas” focus of this pa-per involves identifying an explicit set of technical, eco-nomic, social, environmental, and institutional performance indicators, which are able to address urban concerns. Even if each city has its specific characteristics, most cities share some common concerns such as unemployment, energy effi-ciency, housing, governance, transportation, social cohesion, environmental improvements, etc. Typically, regarding nat-ural risks management, these concerns must include land use typology (residential, commercial, recreational, indus-trial parcels) and planning, housing typology (individual or multi-family houses, detached or semi-detached houses), so-cial characteristics of population affected by hazards (age, disability, gender, socio-economic status, ability to recover from a shock), social amenities (schools, hospitals, green spaces) availability and accessibility, etc. Sustainable natural risk management in urban areas aims to identify what aspects of the risk management agenda have implications for urban sustainable development, and to reconcile those aspects with policies for addressing urban sustainability.
The bottom-up approach was exhaustively applied when inventorying the potential (direct and indirect, as well as tangible and intangible) effects and consequences (pros and cons) of risk management decisions over periods that are much longer than the lifetimes of the investments. For the natural risk management policies, the potential consequences could include a decrease/increase in casualties and disabili-ties (direct), a decrease/rise in economic activity (indirect), continuing damage to assets due to the residual2risk (tangi-ble), impacts on human health or natural resources and func-tions (intangible), increased public awareness of local natural hazards (pros), or a transfer of risks to another area (cons). Furthermore, some policies may have positive future conse-quences, but their immediate consequences could be nega-tive, or vice versa. For instance, the development level of a territory might be improved in the future, but there may be significant implementation costs on the short-term scale.
2The residual risk is the irreducible portion of the risk associated
with the potential implementation of management solutions.
These potential effects have shown which considerations are important while assessing risk management decisions; these effects were explored to identify the relevant indicators. Once these effects and consequences were identified, a liter-ature review was completed and a set of potential indicators was created according to their relevance regarding the stud-ied field and based on an overview of existing national and international sustainability assessment methodologies (Singh et al., 2012) and tools.
No specific indicators exist for evaluating the risk manage-ment that are universally or widely accepted (Carreño et al., 2007). Therefore, indicators were selected from various tools used to gauge sustainability in various fields. These tools are Sustainability Reporting Guidelines G4 provided by the Global Reporting Initiative, RST02 grid (France), “Boussole 21” grid (Belgium), International Urban Sustainability Indi-cators List (IUSIL), the reference framework for European sustainable cities, Sustainable Transportation Performance Indicators (STPI), and risk management performance crite-ria proposed through the action framework led by the Inter-national Strategy for Disaster Reduction (ISDR). Amongst those tools, only two refer clearly to natural risks, without making special indication on the type of natural hazards. The IUSIL considers “natural hazards” as an indicator of social criteria when assessing urban sustainability, and the ISDR framework provided a set of goals and criteria for guiding, and monitoring disaster risk reduction. These two tools could be adapted to any natural hazard by defining specifically rel-evant indicators or parameters.
Finally, using a collaborative and multi-disciplinary pro-cess, researchers involved in the INCERDD project shared their knowledge, experience and judgements to validate the set of the proposed indicators with regard to their rele-vance, applicability and other characteristics, such as mea-surability and accessibility to those without specific knowl-edge. Indeed, as the main target of indicators is to reduce the complexity of information needed by decision-makers, they should be “measurable, scientifically valid and capable of providing information for management decision-making” (Donnelly et al., 2007). Sustainability indicators have to ful-fil the following requirements. They have to be: (1) relevant by showing what is essential to be known, (2) easy to under-stand by every actor of risk management even if he is not an expert, (3) reliable so that the information they provided will be trusted, and (4) based on accessible data so that the infor-mation will be available when it is needed. However, indica-tors “can be developed independently of available datasets” (Donnelly et al., 2006) and doing that could help drive pro-duction of needed data.
The experts, when selecting the components of the pro-posed grid, checked all the retained indicators in the light of those requirements. Indicators were retained when they meet the majority of criteria (that is to say three), which inevitably include the criterion “relevant” expressing the importance of the indicator in relation to sustainable risk management.
Although it was difficult for every indicator to conform to all of these requirements, it was important that they com-plied as much as possible. For instance, some effects and as-pects seem to be significant but remain difficult to assess, particularly regarding the social and institutional dimensions (Lekuthai and Vongvisessomjai, 2001 cited by Poulard et al., 2010). Because some of the indicators are related to intan-gible concerns (e.g. recreational value, quality of life), the analysis is very complex; these indicators are often assessed based on subjective assumptions. Subsequently, their estima-tion causes several problems, such as finding consensus on the parameters and how to measure these factors concretely.
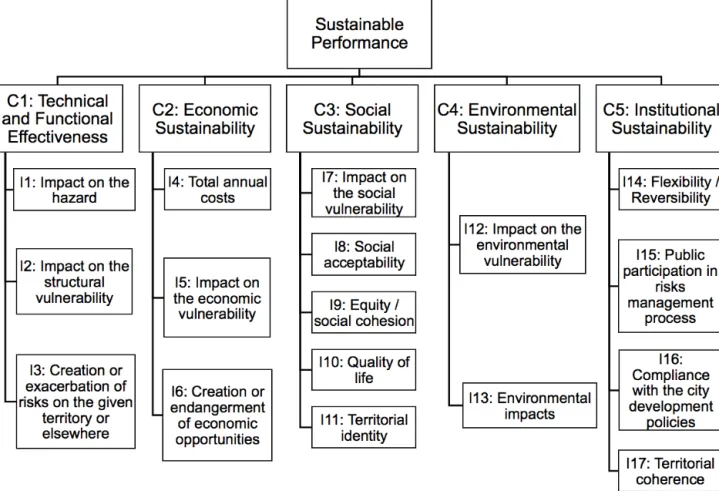
The obtained sustainability assessment grid is constructed using a hierarchical structure that includes seventeen context-specific indicators. This grid is schematically depicted in Fig. 2 and assumes that qualitative indicators3might include numerous sub-indicators called parameters that would enable their assessment. Parameters are the measurable or observ-able variobserv-ables that describe the corresponding indicator (Bra-gança et al., 2010). In accordance with the sequence of tools through which impacts of a plan or policy can be measured (Donnelly et al., 2006), and in the hierarchical structure of the proposed assessment grid, criteria represent “objectives”, indicators represent “general targets” while parameters are the simplest measurable features that can be used to assess and monitor a performance. Commonly indicators are com-posite indices made of a wealth of complex and detailed in-formation aggregated in unique understandable inin-formation. Parameters can be identified and selected on a case-by-case basis by relying on the distinctive characteristics of the territory and its prevailing sustainable development targets. Although the objective of this paper is to provide a more pre-cise and defined framework to assess the sustainability of risk management initiatives, the parameters were informally se-lected. This choice might render the framework more flexible by allowing to users to propose better parameters depending on their particular context, the specific purpose of sustainable development in their urban setting, and data availability.
Even though none of the proposed criteria and indicators is absolute, they were chosen from different domains accord-ing to key considerations briefly depicted as follows. The cri-terion “technical and functional effectiveness” aims to help measure a decision success in achieving damage limitation. To attain this objective, it seems appropriate to consider as in-dicators, hazard characteristics (intensity/magnitude, spatial extend, frequency, speed of onset, etc.), structural or physi-cal vulnerability (typology, value and sensitivity of exposed assets), and the potential of the decision to create or exac-erbate existing or new risks (both hazard and vulnerability measuring variables). The criterion “economic sustainabil-ity” intends to estimate decisions impacts on the economic productivity of the territory. The success of a strategy in
en-3The indicators are not necessarily split into parameters; some
parameters might be split into sub-parameters.
abling continued economic growth while reducing natural risks damages could be checked with indicators such as its costs, its potential avoided damages, and its ability to create or not economic value for society.
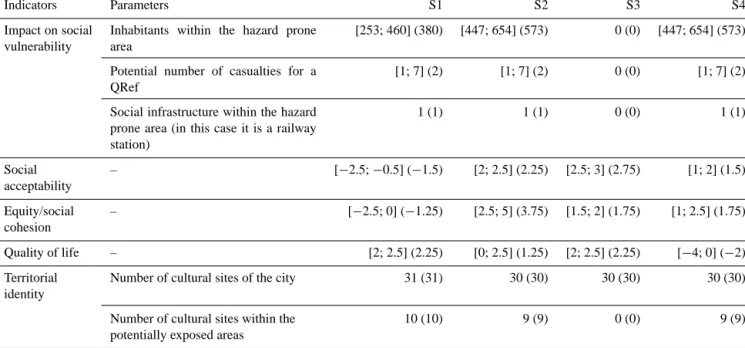
The objective of the criterion “environmental sustainabil-ity” is to appraise the capability to preserve and maintain eco-logical heritage. Related general targets are, at one hand, to reduce environmental vulnerability to risk, and at the other, to avoid strategies that would induce significant adverse ef-fects on ecological heritage. Thus, the retained indicators are: “impact on the environmental vulnerability” and “environ-mental impacts”. To select the parameters on which the in-dicator “impact on the environmental vulnerability” can be split to, the stakes that, when situated in hazard prone zones, could contribute to the environmental sustainability of a ter-ritory were identified. Possible features to consider are: areas of protected natural habitats, sites with pollution potential, drinking water sources, wastewater treatment plants, volume of wastes probably resulting from risks that need to be dis-posed of, etc.
The criterion “social sustainability” could be split into various indicators expressing general targets related to so-cial conditions of people. For the general target of enhanc-ing “quality of life”, some measurable features or parameters could be: average travel time/distance to work/amenities (to show transportation trends induced by the decision), number of amenities such as shops, health care centres, recreational public spaces, etc. (because urban amenities facilitate social contact), etc. The indicators and parameters associated with “institutional sustainability” help check whether the manage-ment strategy is at the expense of another community sus-tainability, and if the decision-making process will actively involve stakeholders.
The multidisciplinary approach developed through IN-CERDD project help ensure less bias in the decision-making process by encompassing all dimensions of sustainabil-ity with a broad spectrum of influential variables. These suggested indicators should be a reference for public institu-tions and the private sector when making sustainable natural risk management decisions. The suggested indicators are not exclusive and should be treated as an indicative checklist of which issues to consider at a minimum when assessing pos-sible solutions with a focus on sustainability. However, one of the challenges remains rendering the grid operational. To address this issue, the following subsection focuses on for-mulating a methodology to assess the sustainability perfor-mance using the grid.
4.3 Sustainability performance assessment
Once the indicators were selected, they needed to be quan-tified or qualified depending on their quantitative and qual-itative nature. Sustainability indicators of natural risk man-agement can be either quantitative (e.g. number of residen-tial buildings within the hazard prone area) or qualitative
Figure 2. Hierarchical structure of the sustainability assessment grid (source: authors).
(e.g. level of recovering from disruptions). The latter may be more suitable for intangible aspects like social, and cul-tural concerns. For instance, “social acceptability” could be considered as a qualitative indicator, which depends on con-siderations such as preferences of people with regard to risk management issues, perceived fairness of decisions impacts, stakeholders’ willingness to support constraints (in terms of financial costs, consistency with social customs, etc.) from decisions. Both of the two types needed to be calculated differently. Quantitative indicators provide information us-ing numbers: they can be evaluated directly from the avail-able data related to measured amounts or from modelling. Qualitative indicators provide information as a description using words: they could be evaluated based on a comparison to a system of references, description, perception or judge-ment regarding their relative importance when accurate data are limited. The obtained descriptions can then be numer-ically scaled using different scaling techniques (e.g. codes, matrices).
As asserted by González et al. (2013), “successful decision support tools provide information in a concise relevant for-mat in order to inform decision-making processes”. To fulfil this objective, a sequenced, understandable and easy-to-use
methodology should be used to evaluate different strategies during natural risk management. For a better understanding of each step of the methodology, the paper presents a ped-agogical example to illustrate calculations regarding each equation. This example serves also as case study to demon-strate how the whole methodology may be used as decision-support tool for selecting the most sustainable risk manage-ment decision.
Assuming that the input data4of the methodology are the parameter values (when dealing with quantitative indicators) and the indicators values otherwise, the calculation process follows almost the steps of the OECD methodology for build-ing composite indices (OECD, 2008) because indicators and criteria are composite indices. Standard procedures such as choosing a representative series of sub-indices (parameters, indicators), verifying whether normalisation is needed and with which method, dealing with weighting concerns, how to
4The data sources (e.g. historical records, instrumental records,
maps) and various methods/tools (e.g. physical and numerical mod-els, existing mono-criterion sustainability assessment tools, expert judgements) might be used to generate input data. This framework does not indicate which methods/tools to use; the primary purpose is to generate the required input data.
aggregate sub-indices were applied. No assessment of multi-collinearity among the sub-indices has been done to check if there are correlations between them. Nonetheless, users have to selects parameters in a way to combine or eliminate those, which could be collinear.
While operating the methodology, users could make data screening tests (removing outliers, identifying erroneous data values, detecting missing data, etc.). Indeed, the problem of input data availability is crucial because in reality there will inevitably be some missing data. It is necessary to supple-ment missing data, if it is possible. An option is simply to exclude the parameters that are suffering missing data from the set of parameters for all the assessed alternatives. Failing that, users could solve this problem through several missing data imputation procedures. They could build plausible data according to similarities of the study case with other cases (external sources) or based on imputation methods such as mean – median – mode substitution, nearest neighbour inter-polation, various regression techniques, etc. (OECD, 2008; Glasson-Cicognani and Berchtold, 2010). Although imputa-tion can help minimise bias, it should always be kept in mind the incompleteness of data because imputed data are not real data. Given this background, the suggested sustainability as-sessment methodology is organised as follows.
4.3.1 Definition of reference values
Sustainability assessment can be performed through two main approaches, one based on a relative evaluation, and the other on an absolute evaluation. The values of the param-eters or indicators are not able to reveal by themselves the sustainability performance level of a decision; a comparison with reference values provides this information (Tugnoli et al., 2008). This process requires reference values to which each parameter/indicator value can be compared. Several val-ues could be taken as reference:
– The desired level of sustainability value for each param-eter/indicator should be included (Van Cauwenbergh et al., 2007). This value could be established on empiri-cal, regulatory, or scientific basis in accordance with the related field, and specificities of the territory (Acosta-Alba and Van der Werf, 2011).
– The fixed thresholds may be expressed either as lower, higher or ranges of acceptable values that should not be exceeded (Wiek and Binder, 2005; Zahm et al., 2006). They may be normative values based on legal or scien-tific norms or expert judgements derived from observa-tions related to the parameters.
– The value for each parameter/indicator resulting from a reference situation that is often the baseline policy considered as the status quo or do-nothing alternative, assuming that no new measures are taken (Klijn et al., 2009).
It is important to clearly define the reference values because there is a linkage between the assessment approach and refer-ence values type. An absolute assessment is based on what is understood by sustainable development (ideal values and/or fixed targets) while a relative one is based on a given situa-tion. The suggested methodology adopts a relative approach. It relies on the estimation of the variation resulting from the studied alternatives compared to the existing natural risk management policy.
4.3.2 Estimation of performance at parameters level when dealing with quantitative indicators
For the quantitative indicators, this estimation consists of three steps. The first step includes the calculation describing the expected performance of a given option in the context of a specific parameter. Equation (1) can be used to assess whether the option is better/worse than the reference situa-tion or contributes to/conflicts with the target/threshold re-garding the considered parameter.
Vdif=Vopt−Vref (1)
where Vdif, Voptand Vrefare the potential performance, the
parameter value for the analysed option and the parameter value for the reference situation, respectively.
The second step involved in the calculation of the im-pact rate or the degree of convergence/compliance to the tar-get/threshold (ImpR). This value represents the ratio5 be-tween the potential performance (Vdif) and the reference
value (Vref), as shown in Eq. (2). This step produces the
relative impact values expressed as percentages and enables the relative values to be combined with several quantitative parameters that are no longer defined by their own specific measurement units. The normalisation of the potential per-formance reveals the magnitude of impacts in relation to the reference value for each parameter (Myllyviita et al., 2014). ImpR =Vdif
Vref
(2) Assuming that for a given alternative option, a parameter value Voptis 21 while reference value Vref is 13, the ImpR
of this alternative relative to the parameter equals +61.53 %. The third step consists of assigning a value score (ImpS) to each impact rate (ImpR) according to its level and its nature (advantage or disadvantage); this process generates ordinal numerical values, facilitating aggregations and simplifying the assessment process (Gafsi and Favreau, 2013). The scor-ing could be performed usscor-ing a bidirectional6 Likert-type
5To simplify the calculations, when the
reference value = 0, the following are true: the value of the impact rate (ImpR) = 0 % when the alterna-tive value = 0; the value of the impact rate = ±100 % when the alternative value 6= 0.
6The plus and minus signs indicate whether the studied option
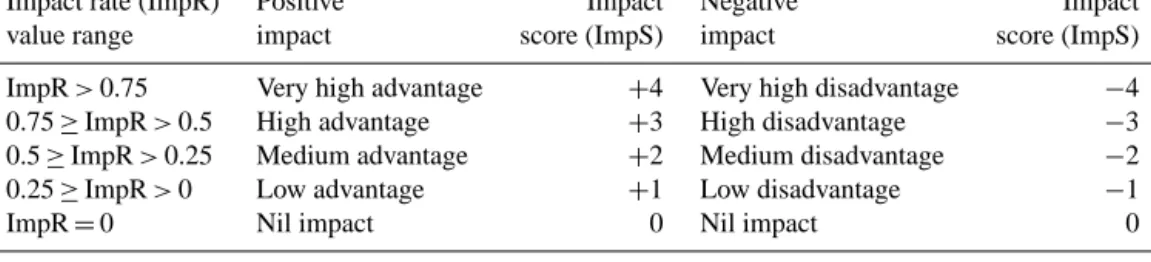
Table 1. A nine-point scale for scoring quantitative impacts.
Impact rate (ImpR) Positive Impact Negative Impact value range impact score (ImpS) impact score (ImpS) ImpR > 0.75 Very high advantage +4 Very high disadvantage −4 0.75 ≥ ImpR > 0.5 High advantage +3 High disadvantage −3 0.5 ≥ ImpR > 0.25 Medium advantage +2 Medium disadvantage −2 0.25 ≥ ImpR > 0 Low advantage +1 Low disadvantage −1
ImpR = 0 Nil impact 0 Nil impact 0
Source: authors.
scale whose range captures the perceived sensitivity of the parameters. The higher the range of the scale7, the more sensitive the parameters are. Therefore, using different rat-ing scales might be possible durrat-ing the same assessment. In this situation, the assessors should ensure a link between the scales, thus facilitating the subsequent calculations. Table 1 presents a nine-point scale. At the central point, zero indi-cates that the alternative has no effect (neither obstructs or supports sustainability attainment). Positive values express different levels of supporting sustainability fulfilment; nega-tive values reveal grades of its obstruction. According to the aforementioned example and the scale shown in Table 1, to the ImpR with a value of +61.53 % corresponds an ImpS equals to +3 because impacts induced by the alternative are beneficial (+) and they belong to the interval ]0.5; 0.75].
The choice of the length of the scale is important because the sustainability performance can vary with the scale used to assess it. For instance, consider two options A and B with impact rates of −19 and −9 %, respectively. Based on a nine-point scale (isometric units of 25 %), both impact scores equal −1, while a twenty-one-point scale (isometric units of 10 %) will assign an impact score of −2 to option A, and an impact score of −1 to option B. Ceiling effects should be considered due to the context of study cases, and the level of preciseness that is expected. Using long scales (small units) might provide more accurate and refined results than short scales, even if performing the calculation using the latter is much easier.
Using the same range might be possible; however, the length of units must be adjusted according to the sensitiv-ity of the parameters. For instance, when handling a more sensitive parameter, instead of using a fixed length between running scores (isometric units), a different length could be applied from one score to another. To illustrate such a possi-bility, for a
– very high impact: ImpR > 0.75 (low sensitivity) or ImpR > 0.3 (high sensitivity)
7The number used for the scale points is derived from a
per-centile value for the impact rate; this value might be 9 (fixed length of 25 %), 11 (length of 20 %), or 21 (for 10 %), etc. The scoring scale depends on the context of the study and might influence the overall sustainability rating.
– high impact: 0.75 ≥ ImpR > 0.5 (low) or 0.3 ≥ ImpR > 0.2 (high)
– medium impact: 0.5 ≥ ImpR > 0.25 (low) or 0.2 ≥ ImpR > 0.1 (high)
– low impact: 0.25 ≥ ImpR > 0 (low) or 0.1 ≥ ImpR > 0 (high)
– nil impact: ImpR = 0 (low or high sensitivity) 4.3.3 Estimation of performance at quantitative
indicators level: aggregation of the parameters There exist many aggregating methods within the MCDA approach (e.g. weighted sum, weighted arithmetic mean, weighted product, weighted geometric mean, non-compensatory outranking methods) and there is a lack of objective criteria for adopting an appropriate one (Zhou et al., 2006). However, the two most commonly used aggregating methods for constructing the composite indexes are weighted arithmetic and weighted geometric means (Juwana et al., 2012). The core difference between these methods is that the geometric approach takes into account the differences in the sub-indexes, while the arithmetic aggregation does not do so and therefore creates perfect compensability among all sub-indexes.
The aggregation of the impact scores for the parameters with those for the synthetic indicators reduces the amount of information provided to the decision-makers, thereby sim-plifying the comparison of the performance of the evaluated alternatives and facilitating the ranking process. In this pa-per, this aggregation was achieved using the weighted arith-metic mean of the impact scores related to each indicator. This method was chosen because, in contrast to the weighted geometric mean, sub-indexes do not have to be strictly pos-itive. The use of the geometric method under the proposed scheme needs to transform all impact scores for parameters into positive values. Since this methodology is tailored to public use, the aggregation of sub-indexes should be kept as clear as possible. In this sense, the weighted arithmetic mean that is simple and easy to understand was chosen, although it assumes that there is complete compensation among the performance of the parameters/indicators.
The calculation for the indicator performance index (IPI) is shown in Eq. (3) (where xi=weight of the parameter i).
IPI = P xi∗ImpSi
P xi
(3) Parameters are weighted according to their relevance and setting the weight of each parameter is inconvenient. The weighting is critical because the weight of parameters is es-sentially a value judgement that depends on the context of the risk management project, the sustainability priorities of the territory and the relative importance of each parameter within the composite indicator value. Higher weights are assigned to the most important parameters (Bragança et al., 2007). How-ever, when information regarding the preference of parame-ter or indicator over another is unavailable, assigning equal weights seems to be the norm (Zhou et al., 2007).
Therefore, while using this framework, the decision-makers must assign weights to the parameters or indicators that account for the specific needs and societal preferences of the territory. Monetising (willingness to pay, budget al-location process, etc.), and rating (distance to targets, panel methods for eliciting preferences such as analytic hierarchy process) are the two main approaches that can be used to set weighting factors. Instead of using a proper weighting pro-cess, decision-makers could refer to generic sets of weights, which belong to recognised schemes or are taken from pre-vious studies or are derived from relative importance of spe-cific concerns, leading thereby to less subjectivity and more transparency.
For the indicator named “impact on the environmental vulnerability”, parameters weights may be derived from the territorial coherence scheme (schéma de cohérence territoriale – SCOT) according to the prioritized environ-mental issues for the given territory. The SCOT is a French document describing urbanism that allows municipalities in a given territory to remain consistent in their policies between various areas to achieve sustainability. This docu-ment integrates an environdocu-mental diagnostic and an impact assessment regarding environment to underline and rank the stakes. An example could be found at http://www. developpement-durable.gouv.fr/IMG/pdf/F12_MEDDTL_ Fiches_Guide_Ev_Env_Doc_Urba_BD_nov2011.pdf, (MEDDTL, 2011). Parameters related to “environmental impacts” can be aggregated using the weights provided by environmental rating systems, such as the Leadership in Energy & Environmental Design (LEED) system, while analysing structural alternatives. LEED is a scoring system developed by the US Green Building Council to evaluate the environmental friendliness of buildings.
Once the impact scores for parameters have been quan-tified, they are aggregated to obtain a composite index that summarises the performance of each indicator. Aggregation involves joining many individual values to form a more co-hesive and concise value. When assessing sustainability, ag-gregation may occur in sequential stages to gather the
perfor-Table 2. A sample of qualitative impacts scoring matrix.
Impact score (ImpS)
Impact Positive Negative
level impact impact
Negligible impact* 0 0
Low impact +1 −1
Medium impact +2 −2
High impact +3 −3
Very high impact +4 −4
* Negligible impact is an impact expected not to occur. Source: authors inspired by the work of Zihri (2004) and Mdaghri (2008).
mance of the parameters and obtain the performance of the indicators; the latter are then combined to obtain the criteria indexes.
4.3.4 Estimation of performance at qualitative indicators level
When a quantitative impact assessment is impossible8, a qualitative assessment might be conducted using various methods based on expert judgements, subjective information, scientific, or legal references. When utilising qualitative data, ordinal scales are routinely used for conversion into numbers. Therefore, the qualitative indicators can be scored using the fully described level of the estimated consequences of a de-cision through assessment matrices, rating scales, and score-cards. Their construction must be of a meaning in order to precisely justify scores awarded. They should be clearly un-derstandable, and should explain under which circumstances an option will get a certain score or how to fill them in; even if experts, which assign notes, are supposed to be people pos-sessing knowledge in this specific field.
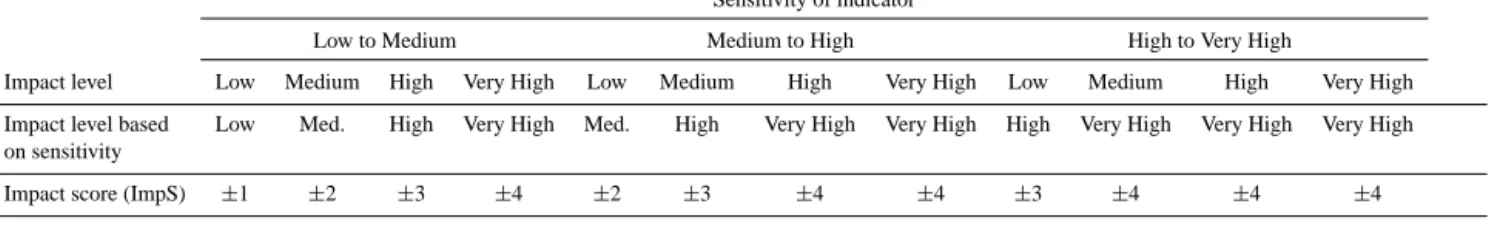
Regarding a nine-point bidirectional scale, Table 2 shows an example of a simplified matrix for assessing the qualita-tive impacts within the developed framework. The scores are assigned based on a −4 to +4 scale, referring to the quanti-tative impact scores scale presented above (Table 1). As for the quantitative parameters, assessment matrices could also capture the sensitivity of parameters. Table 3 shows an ex-ample of a possible interaction matrix between impact level and indicator sensitivity. After granting a score to each quali-tative indicator, the indicator performance index (IPI), which expresses the marginal impact of options relatively to the ref-erence situation, is directly obtained by subtracting the score of the option under study (Vopt0 )from the score of the refer-ence situation (V0
ref)as shown in Eq. (4).
IPI = V0opt−V0ref (4)
8This situation occurs for some of the parameters for the selected
Table 3. A sample of qualitative impacts scoring matrix based on the sensitivity of the indicator.
Sensitivity of indicator
Low to Medium Medium to High High to Very High
Impact level Low Medium High Very High Low Medium High Very High Low Medium High Very High Impact level based Low Med. High Very High Med. High Very High Very High High Very High Very High Very High on sensitivity
Impact score (ImpS) ±1 ±2 ±3 ±4 ±2 ±3 ±4 ±4 ±3 ±4 ±4 ±4 Source: authors.
Table 4. Some illustrative impact scores with the resulting IPIs and
CPI.
Parameters Indicators Criterion performance performance performance ImpS111=0 IPI11=0 CPI1=0.666 ImpS112=0 ImpS121=0 IPI12=2 ImpS122=2 ImpS123=3 ImpS124=3 ImpS131=1 IPI 13=0 ImpS132= −1 Source: authors.
4.3.5 Estimation of performance at criteria level: aggregation of the indicators
After the IPIs are estimated, they are aggregated to form the criterion performance index (CPI). The scheme for calculat-ing CPIs is similar to that mentioned above for evaluatcalculat-ing the IPIs. Similarly, the aggregation is based on equally weighted values. Theoretically, indicators should have the same impor-tance; even when there is total compensation, aggregation oc-curs within a specific dimension. Nonetheless, while assess-ing the options within this framework, users could attribute different weights to the indicators when calculating the CPI, as outlined in Eq. (5) (where kj indicates the weight of the
indicator j ).
CPI = P kj∗IPIj
P kj
(5)
The results from aggregating the IPIs might reveal the sus-tainability performance for all five specific sussus-tainability cri-teria, thus enabling comparisons between the different mea-sures within each criterion. The most sustainable option for the desired goals must then be selected. Therefore, the fulfil-ment of the sustainability goals should be interpreted. Table 4 presents some impact scores with the resulting IPIs, and CPI of the sample alternative.
4.3.6 Comparative assessment of alternative options
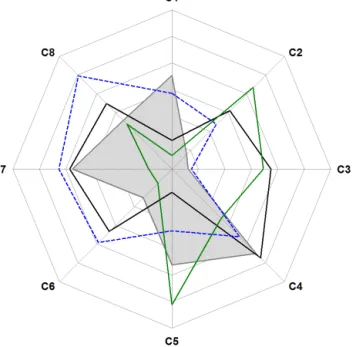
To capture the interactions between the contributions of the criteria toward sustainability, the results are graphically displayed. Graphical representations are a useful starting point (Gomiero and Giampietro, 2005) during the compar-ative assessment because they provide a global performance overview for the alternative strategies in the context of the sustainability goals through the sustainable profiles. This general overview clearly displays the performance of the op-tions at the level of each criterion.
In the proposed framework, the five CPIs were plotted onto a five-axis spider-gram illustrating the trade-offs. These in-dexes are mapped over axes, beginning at the interior and moving outward (the external limit denotes increasing level of sustainability). They are drawn relative to the adopted ref-erence situation (target, thresholds or baseline strategy): the 0 level of the scale corresponds to the minimum sustainability level according to the reference and represents the compo-nent points of the reference graph.
Negative impacts are located inside the referential situa-tion graph while positive ones are on the external side. There-fore, identifying which criteria perform better/worse or fall short/exceed the target/threshold is easy. A bigger diagram indicates that an option is more sustainable. Moreover, this type of graphical representation facilitates comparisons be-tween two or more options, matching the basic goal of this paper, which is to propose a tool to assess and compare one or more option.
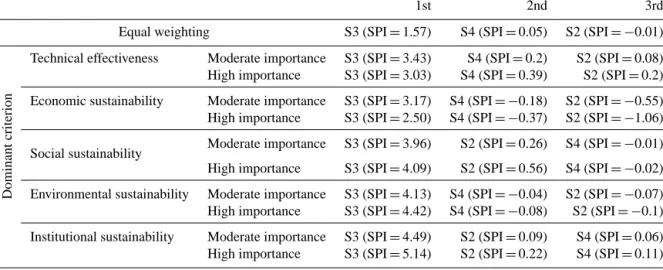
After the sustainability profile for the options is visu-alised, the decision rules must be assigned to guide the se-lection of the most sustainable options and propose under-standable and transparent justifications for these decisions. The CPIs will rank the options according to the different decision rules; these rules reflect the diverse visions of sus-tainable development. The alternative options during rank-ing may vary dependrank-ing on the compromises made between the different aspects of sustainability. To handle the trade-offs between the sustainability criteria, some rules have been proposed for decision-making regarding sustainability as-sessment (Gibson et al., 2005). No specific decision rules (MCDA methods) have been established within this assess-ment framework. This feature is studied in the case study
to demonstrate the potential variability in the option rank-ings in accordance with the adopted decision rules, possibly producing options that are ranked differently between rules. The decision-makers using this framework must choose the appropriate rule or combination of rules from the following possibilities.
Rule 1: maximum net gains (optimisation logic)
This rule delivers the most sustainable option based on the levels of cumulative contribution from each criterion toward global sustainability, selecting the option that offers the most positive net effects. Maximum net gains leads to an overall score for sustainability that incorporates all criteria in order to be able to rank alternatives and select the optimal one. The performance of the options toward sustainability might be estimated as follows:
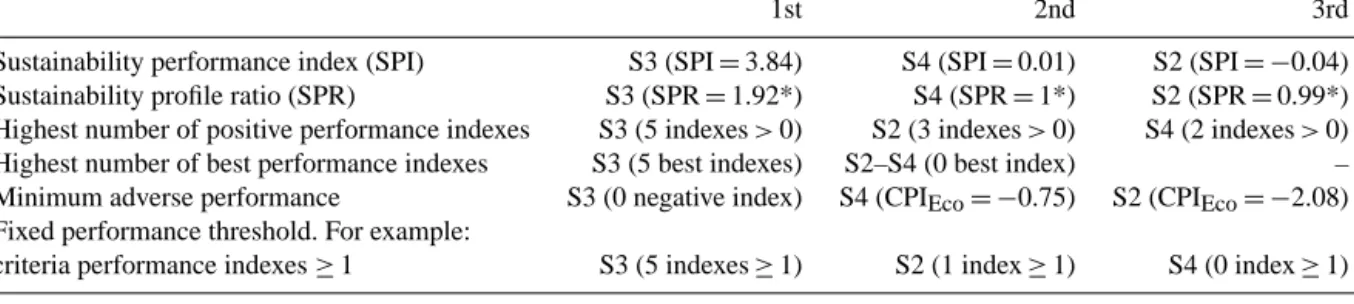
a. Calculating a composite index of sustainability The CPIs are collapsed into a composite index. To re-main consistent with the indicators and the criteria per-formance calculation scheme, the Sustainability Perfor-mance Index (SPI) is a weighted average obtained using the following Eq. (6):
SPI =P wn∗CPIn
P wn
(6)
where wn=weight of criterion n and CPIn=
perfor-mance of criterion n
To remain consistent with sustainability principles, equal importance would be ideally assigned to the CPIs during the sustainability performance assessment. However, because this framework aims to be generic, decision-makers could apply different weights, depend-ing on their territorial specificities and sustainable development priorities. If the sample alternative ob-tained the following values: CPI1=0.67, CPI2=0.6,
CPI3=0.05, CPI4=0.16, and CPI5=1.88, its global
sustainability shown by SPI will equal to 0.67.
In this type of composite index, a criterion could com-pensate for the lower performance of another criterion. Theoretically, when the five dimensions are equal, they cannot be substituted for one another. Further, the re-quired similarities in the performance of all five sustain-ability dimensions seem too optimistic. Imagining a nat-ural risk management decision that can simultaneously minimise all negative effects is difficult. Therefore, each criterion should be required to deliver net gains that pos-itively contribute to the risk management sustainability.
b. Computing the sustainability profile area
The options could be ranked according to the size of their sustainability profile. The sustainability profile ra-tio (SPR) could be calculated by dividing the sustain-ability coverage area of the option by that of the refer-ence situation, as defined by Eq. (7), for a nine-point scale.
SPR = 1
80∗ (a∗b + b∗c + c∗d + d∗e + e∗a) (7) where a, b, c, d and e are the lengths of the axes relative to the performance of each criterion.
With a nine-point scale, CPIs range from −4 to +4. Thus, the calculations proceeded by considering the five triangles defined by the axes of the diagram and adding
+4 to the value of each CPI so that the length of each arm of the star described by the criteria can be measured from the centre of the diagram where the indexes value is equal to −4. Consequently, for the reference situation, the value of the five lengths equals 4. The central angle of each of the five triangles is one-fifth of 360 degrees (72◦) and the formula used to estimate the sustainability area (SA) of a diagram is as follows:
SA =1
2∗ (a∗b + b∗c + c∗d + d∗e + e∗a) ∗Sin(72 ◦
) (8)
Using the equation 8, the SA of the reference situ-ation equals to 40 ∗ Sin (72◦) and equation 6 is ob-tained by dividing the sustainability area of the option by that of the reference situation. For the sample alter-native, SA = 52.7 and SPR = 1.38 as SA (reference sit-uation) = 38.04.
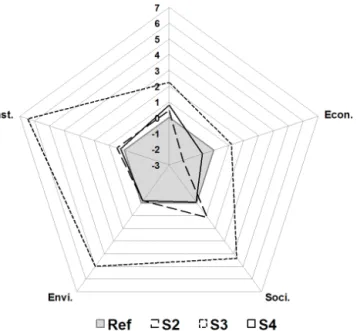
Hereby, two ways of maximum net gains measure-ment have been proposed to give the opportunity to a decision-maker to choose depending on the manner one wishes to present the results. As a composite index (one of the most common approaches to assess overall sus-tainability), SPI allows for a quick assessment of the absolute sustainability performance of a given policy. Besides, the readability of the sustainability profile de-creases with the number of considered criteria and al-ternatives. With the example of Fig. 3, it is impossible to precisely determine the biggest area among the four alternatives. To avoid a potential misinterpretation, SA and SPR quantify the absolute and relative (compared to reference situation) values of the sustainability profile. However, the rankings provided by the multi-criteria spider-gram cumulative surface area method might be biased by the arbitrary order of the criteria (Dias and Domingues, 2014). The major weakness of maximum net gains estimation is the compensatory logic. In the