HAL Id: hal-00304774
https://hal.archives-ouvertes.fr/hal-00304774
Submitted on 1 Jan 2003HAL is a multi-disciplinary open access archive for the deposit and dissemination of sci-entific research documents, whether they are pub-lished or not. The documents may come from teaching and research institutions in France or abroad, or from public or private research centers.
L’archive ouverte pluridisciplinaire HAL, est destinée au dépôt et à la diffusion de documents scientifiques de niveau recherche, publiés ou non, émanant des établissements d’enseignement et de recherche français ou étrangers, des laboratoires publics ou privés.
dynamic spatial pattern of rainfall within a small humid
tropical catchment
K. Bidin, N. A. Chappell
To cite this version:
K. Bidin, N. A. Chappell. TECHNICAL NOTE: First evidence of a structured and dynamic spatial pattern of rainfall within a small humid tropical catchment. Hydrology and Earth System Sciences Discussions, European Geosciences Union, 2003, 7 (2), pp.245-253. �hal-00304774�
First evidence of a structured and dynamic spatial pattern of rainfall within a small humid tropical catchment Hydrology and Earth System Sciences, 7(2), 245–253 (2003) © EGU
Technical Note:
First evidence of a structured and dynamic spatial pattern of rainfall within a
small humid tropical catchment
K. Bidin
1and N.A. Chappell
21School of Science and Technology, University Malaysia Sabah, 88999 Kota Kinabalu, Sabah, Malaysia 2Institute of Environmental and Natural Sciences, Lancaster University, Lancaster LA1 4YQ, UK
Email for corresponding author: [email protected]
Abstract
In a study of the spatial variability of rainfall across a network of 46 raingauges in a 4 km2 rainforest catchment in the interior of northeastern Borneo, seasonal rainfall totals were correlated with raingauge separation distance, aspect and relief. A very high degree of spatial variability in seasonal totals across a very small area was found, even in comparison with other regions experiencing convective rainfall. Moreover, it shows systematic, stochastic structure in rainfall is present over scales of 10s to 100s metres; these patterns change from the southwest monsoon (May-October) to the northeast monsoon (November-April). Local associations with aspect and relief are present but the seasonal changes in rainfall pattern over the whole 4 km2 catchment must relate to more complex local topographic effects on the regional windfield.
Keywords: catchment, Malaysia, monsoon, rainfall, spatial variability
Introduction
The topographic controls on rainfall patterns are well understood at the scale of several 10s or 100s of kilometres (e.g. Basist et al., 1994; Thielen and Gadian, 1996; Lyons and Bonell, 1994; Weston and Roy, 1994; Cosma et al., 2002). Outside the humid tropics, Goodrich et al. (1995), Shah et al. (1996) and Sharon and Arazi (1996) have shown that topography may also affect rainfall patterns at the very fine scale of a few 10s or 100s of metres. There are, however, no studies examining very fine scale rainfall patterns within the humid tropics.
This study assessed the presence of systematic, stochastic structures in the rainfall pattern at very fine scales with a 4 km2 humid tropical catchment by determining the correlation between rainfall totals and raingauge separation distances. The potential effects of aspect and relief on rainfall pattern because of differential heating and uplift (Thielen and Gadian, 1996; Cosma et al., 2002), were examined with further correlation analyses. Given the changes in dominant wind direction from the south-west to north-east monsoon in this part of the SE Asian region of the humid tropics
(Estoque et al., 2000), seasonal changes in rainfall pattern were also examined. The site chosen for the work is the 4-km2 Sapat Kalisun Experimental Catchment (Fig. 1) in Sabah, Malaysian Borneo which contained a network of 46 storage raingauges.
Site and raingauge network
The Sapat Kalisun Experimental Catchment (4o58’N and 117o48’E) lies within the Brassey Range of hills in eastern Sabah, approximately 50 km west of the eastern coast of Sabah, Malaysian Borneo. The altitudinal range within the Sapat Kalisun Experimental Catchment itself is 132 to 436 m, the highest point being the summit of Atur Hill (Bukit Atur or BA; Fig.1). The natural vegetation within the catchment is lowland, evergreen dipterocarp forest, disturbed by selective forestry during 1988–89 (Greer et
al., 1995). Some 80% of the rainfall received in the Sapat
Kalisun Experimental Catchment is in relatively low intensity (< 10 mm hr–1), short duration (< 5 minute) convective events (Bidin, 2001) occurring in the late
OP35 OP34 OP36/RG 5 OP33 OP37 RG1 RG3 OC15 OP40 OP39 OP1 OP2 OP3 OP4/RG
4 OP5 OP6 OP7 OP8 OP9 OP10 OP11 OP12 OP13 OP14 BA3 BA4/RGB A BA2 BA1 OP15 OP16 OP17 OP18 OP19 OP20 OP21 OP22 OP23 OP24 OP25 OP26 OP27 OP28/RG 6 OP29OP30 OP31 OP32 OP38/RG 4 0.9 1.4 1.9 2.4 2.9 3.4 1.55 2.05 2.55 3.05 3.55 4.05 4.55 5.05 Relative east (km) R el at iv e nor th ( k m )
Danum Valley Field Centre (DVFC) Bukit Atur 150 180 310 210 180 150 240 220 180 280 400 340 370 250 180 210 210 240 210
Sapat Kalisun River
Palum Tambun River
______ 500 m Sapat Kalisun Catchment
Baru Catchment
Fig. 1. Distribution of the storage raingauges (OP, BA, OC) and the recording raingauges (RG) monitoring rainfall within the 4-km2 Sapat
Kalisun Experimental Catchment. The gauge number begins with a symbol, where OP is a haulage road site, BA is an canopy opening on Atur Hill (Bukit Atur) and OC is canopy gap away from haulage roads.
afternoon (Chappell et al., 2001). The two principal Southeast Asian monsoon wind directions — the south-west monsoon (May–October) and north-east monsoon (November–April) both deliver relatively similar 6-month rainfall totals (Bidin, 2001; Chappell et al., 2001).
Within the catchment, 51 storage raingauges were installed
within the Sapat Kalisun Experimental Catchment (equivalent to one gauge for every 7.8 ha) and the point measurement errors for weekly rainfall totals were shown to be less than 5% (Bidin, 2001). The records from five of these gauges were not used, because of gauge damage by elephant and wild boar. Most of the gauges were located
First evidence of a structured and dynamic spatial pattern of rainfall within a small humid tropical catchment
along forestry haulage roads on the inner edge of the catchment divide, typically at a distance of 250 to 400 m apart. Gauges were located within large canopy openings (at least 20–40 m wide) to minimise the canopy sheltering component of the 5% catch error. Fifteen of the raingauges were clustered within the 44 ha Baru Experimental Catchment (equivalent to 1 gauge for every 3 ha); this subcatchment of the Sapat Kalisun (Fig. 1) has been subject to intensive studies of hydrology, erosion and evaporation (e.g. Greer et al., 1995; Chappell et al., 1999; Bidin, 2001). The precise positions of all these gauges were determined by closed-loop traverses using a Leica TC400 Total Station (a combined electronic theodolite and laser distance system) to both quantify and minimise the location errors. The minimum slope distance between a pair of gauges was 17 m, the average was 1.52 km and maximum 3.3 km. The gauges were monitored approximately weekly during the water year 1st May 1997 to 30th April 1998. A UK Meteorological Office Mark II (storage) raingauge is located at the local meteorological station (Danum Valley Field Centre) was used to place the Sapat Kalisun data within a longer-term (i.e. inter-annual) setting (Bidin, 2001).
Fine-scale spatial variability:
coefficient of variation
During the 1997–8 water-year, the data distribution of weekly rainfall totals across Sapat Kalisun Experimental Catchment was Gaussian for both 6-month and 12-month integration periods (Fig. 2; Bidin, 2001). The catchment-average rainfall totals for the south-west monsoon differed statistically (P < 0.001) from those for the north-east monsoon of the 1997/98 water-year but were not statistically different (P < 0.1) when the 13-year records for the Danum Valley Field Centre were examined (Bidin, 2001).
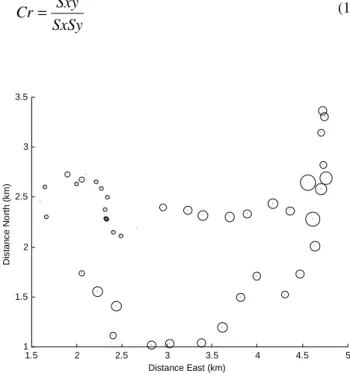
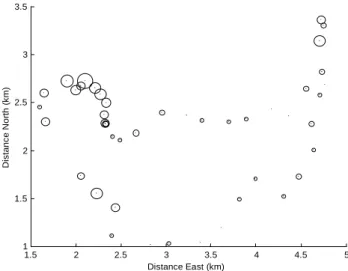
The coefficient of variation (CV) for the rainfall totals in the Sapat Kalisun Experimental Catchment varies between the 6-month integration periods. The south-west monsoon has a CV of 12.1%, while the north-east monsoon has a CV of only 8.7% (Bidin, 2001). The range of rainfall for the south-west monsoon was also larger, with the highest catch of 1098.4 mm (raingauge OP17: Fig. 1) receiving 64.2% more rainfall than the lowest catch of 669.0 mm at gauge OP25. The CV over the whole year is 6.2% (Bidin, 2001). Figures 3a and 3b are maps of raingauge locations, where circle diameter is proportional to the rainfall totals collected during the Southwest and Northeast monsoons, respectively. There is clearly some similarity in catch recorded by gauges in close proximity, i.e. qualitatively, a structured pattern in rainfall appears to be present (Sharon and Arazi, 1997) and has been examined quantitatively.
Fine-scale spatial variability: distance
effects
Spatial statistics show that many environmental variables become more dissimilar as distance between sampling points increases. Following the rainfall studies of Hershfield (1965), Sharon (1972) and Jackson (1974) the correlation between all combinations of raingauge pairs (Cr) was calculated using:
SxSy Sxy
Cr= (1)
M o n ito rin g p e rio d s
Ra in fa ll to ta ls ( m m ) 5 0 0 1 0 0 0 1 5 0 0 2 0 0 0 2 5 0 0 S o uth -w e st N o rth-e as t M a y 97 -A pr 9 8 M in -M ax 2 5% -75 % M ed ia n va lu e
Fig. 2. Box-and-whisker plots (Wrinkler and Hays, 1975) of the
statistical distribution of 6-month and 12-month rainfall totals during the Southwest monsoon (1 May 1997 to 31 October 1997), Northeast monsoon (1 November 1997 to 30 April 1998) and water
year 1 May 1997–30 April 1998.
1.5 2 2.5 3 3.5 4 4.5 5 1 1.5 2 2.5 3 3.5 Distance East (km) D is ta n c e N o rt h ( k m)
Fig. 3a. Map of raingauge locations, where circle diameter is
proportional to the rainfall totals collected during the south-west monsoon
where
∑
[
(
)(
)
]
(
)
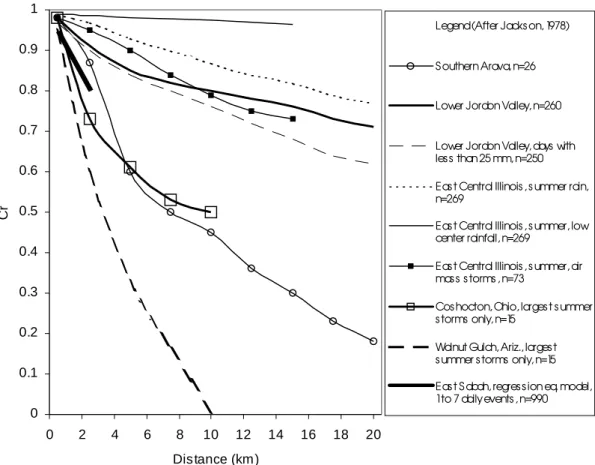
= − − − = n i n Y Yi X Xi Sxy 1 1 / (2)and Sxy is the sample covariance, Sx and Sy are the sample standard deviations for variable X and Y respectively and n is number of samples (McPherson, 1990). This spatial autocorrelation in rainfall is examined for the 12-month study period and for the two monsoon periods separately, and the results are shown within Fig. 4. A linear model can be fitted to the inter-gauge correlation for separation distances in the measurement range of 0.017 and 3.3 km. Figure 4 shows that rainfall totals remain more similar with increasing gauge separation during the north-east monsoon than during the south-west monsoon. This may mean that rainfall in north-eastern Borneo during the south-west monsoon is more localised or ‘patchy’ than that in the north-east monsoon. Against correlation-distance functions for non-tropical regions with convective rainfall, the Sapat Kalisun data show relatively steep relationships (Fig. 5); the rainfall variability across the catchment is more highly localised than for other regions of the globe dominated by convective rainfall. A simple measure of the degree of localisation of rainfall is the distance where the inter-gauge correlation (Cr) equals 0.9 (Hershfield, 1965; Hendrick and Comer, 1970; Hutchinson, 1972). For the 12-month monitoring period, the gauge separation distance within the Sapat Kalisun where Cr = 0.9 is 1.155 km (Table 1). This indicates a high degree of localisation relative to other areas with convective rainfall. Indeed, the 6- and 12-month rainfall totals from the Sapat Kalisun have as high or a greater degree of localisation as much shorter-period totals (i.e. daily) for
1.5 2 2.5 3 3.5 4 4.5 5 1 1.5 2 2.5 3 3.5 Distance East (km) D is tanc e N o rt h ( k m)
Fig. 3b. Map of raingauge locations, where circle diameter is
proportional to the rainfall totals collected during the north-east monsoon
South-w est monsoon
Cr = -0.0751D + 0.9795 R2 = 0.65 (Cr = -0.0885D + 0.9991) (R2 = 0.77) 0.2 0.3 0.4 0.5 0.6 0.7 0.8 0.9 1.0 1.1 0.0 0.5 1.0 1.5 2.0 2.5 3.0 3.5
Distance betw een gauges pair, D (km)
C r North-east monsoon Cr = -0.0364D + 0.9759 R2 = 0.308 (Cr = -0.0526D + 0.9974) (R2 = 0.525) 0.2 0.3 0.4 0.5 0.6 0.7 0.8 0.9 1.0 1.1 0.0 0.5 1.0 1.5 2.0 2.5 3.0 3.5
Distance betw een gauges pair, D (km)
C
r
12-month (May 97-A pr 98)
Cr = -0.0711D + 0.9821 R2 = 0.67 (Cr = -0.0814D + 0.9991) (R2 = 0.79) 0.2 0.3 0.4 0.5 0.6 0.7 0.8 0.9 1.0 1.1 0.0 0.5 1.0 1.5 2.0 2.5 3.0 3.5
Distance betw een gauges pair, D (km)
C
r
Fig. 4. Correlation (Cr) amongst point rainfalls as a function of distance between gauges (D) for different periods of monitoring. Equations and r2 of the relationships in brackets exclude the data
from the Bukit Atur raingauges.
other areas with convective rainfall (Table 2). The lag distance at which Cr = 0.9 for the south-west monsoon (1.059 km) is slightly lower than that for the north-east monsoon (1.119 km): this indicates a slightly larger degree of localisation during the south-west monsoon.
First evidence of a structured and dynamic spatial pattern of rainfall within a small humid tropical catchment 0 0.1 0.2 0.3 0.4 0.5 0.6 0.7 0.8 0.9 1 0 2 4 6 8 10 12 14 16 18 20 Distance (km) Cr
Legend (After Jacks on, 1978)
S outhern Arava, n=26
Lower Jordon Valley, n=260
Lower Jordon Valley, days with les s than 25 mm, n=250 Eas t Central Illinois , s ummer rain, n=269
Eas t Central Illinois , s ummer, low center rainfall, n=269
Eas t Central Illinois , s ummer, air mas s s torms , n=73
Cos hocton, Ohio, larges t s ummer s torms only, n=15
Walnut Gulch, Ariz., larges t s ummer s torms only, n=15 Eas t S abah, regres s ion eq. model, 1 to 7 daily events , n=990
Table 1. Values of inter-gauge correlation (Cr), percentage of gauge
pairs having Cr values ≥ 0.90, and distance between gauges in
pair (D) from the regression lines when Cr0.9 for different period
of rainfall measurements across Sapat Kalisun Catchment.
Data periods 1st6-mon. 2nd6-mon 12-mon
(SW (NE (May 97
monsoon) monsoon) –Apr 98)
Mean Cr 0.865 0.920 0.874
Coeff. of variation Cr (%) 8.90 5.87 8.24
% Cr ³ 0.90 42 71 41
Distance (km) at Cr0.9 1.059 1.119 1.155
Fig. 5. Inter-station (gauge) correlation (Cr) against distance between gauges for different regions with convective rainfall (after Sharon, 1972; Jackson, 1974) and comparison with the present study in eastern Sabah (Sapat Kalisun Experimental Catchment). Number of gauge
pairs (n) is given in the legend.
Fine-scale spatial variability: aspect
and relief effects
Winds lifting air over topographic obstacles can trigger rainfall. In areas of larger relief, rainfall maxima typically occur on upwind slopes (Cosma et al., 2002) but, in areas of shallow relief, maxima can occur just downwind of
obstacles (Sharon and Arazi, 1997). Monsoonal changes in the regional wind direction may, therefore, result in different sides of topographic obstacles receiving the greater rainfall at different times of the year. Aspect will also effect rainfall, with east-facing slopes being heated more, giving greater uplift and hence greater rainfall just downwind (Barry, 1981; Theilen and Gadian, 1996). To determine the presence of aspect and relief effects on the rainfall across the Sapat Kalisun Catchment, rainfall totals have been correlated with aspect and then independently with altitude.
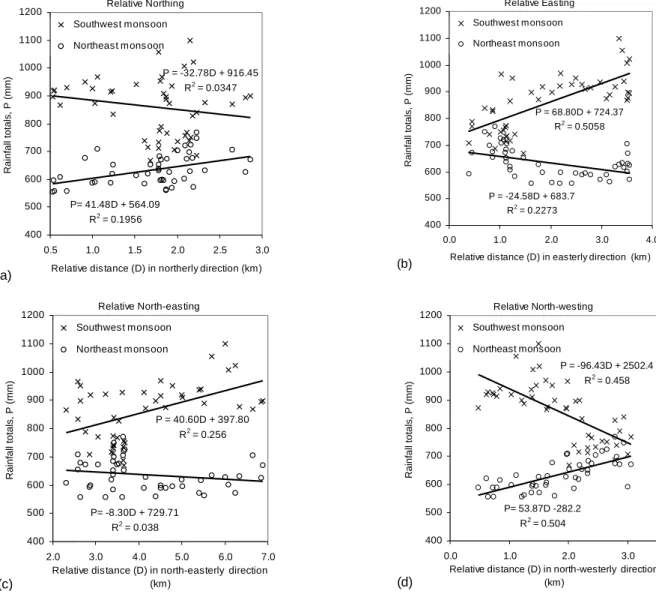
The effect of aspect on rainfall distribution was analysed by correlation with bearing for each monsoon period (Table 3, Fig. 6). During the south-west monsoon, rainfall increases in an easterly and south-easterly direction, with some 50.58% and 45.80% of the variance being explained by a linear correlation with distance (Fig. 6b and 6d; Table 3). During the north-east monsoon, however, rainfall increases in a north-westerly direction (R2 = 50.40%; Fig. 6d; Table 3). If differential heating of east-facing relative to west-facing slopes were the dominant control on local instability in this catchment, then the marked seasonal changes in the bearing:rainfall relationship would not be expected.
rainfall over most areas of the catchment is positively correlated with altitude, as expected from the mechanism of orographic enhancement. Rainfall is, however, negatively correlated with altitude during the north-east monsoon (Fig 7a). This change in the direction of the correlation between the seasons is also seen if separate weeks are examined (Bidin, 2001). Typical correlations for single weekly sampling periods in the south-west and north-east monsoons are shown in Fig 7b. No simple orographic enhancement mechanism can explain the negative correlation between altitude and rainfall during the north-east monsoon, so an additional or alternative mechanism must be involved in regulating rainfall pattern. Further, rainfall measurements on the upper sections of the prominent hill in the north-east corner of the catchment, i.e. the 436 m Atur Hill (or BA; Fig.1), show a different relationship (see BA-labelled region of Fig 7a). This also negates the idea that orographic enhancement of purely regional south-westerly airflows during the south-west monsoon and purely regional north-easterly airflows during the north-east monsoon is the only significant control on rainfall pattern.
Neither differential heating nor orographic enhancement of regional airflows can explain the marked local patterns
of rainfall, so the relatively modest relief in the Sapat Kalisun Catchment (i.e. 132 to 436 m) must alter the local windfield significantly from the direction of the regional windfield. A more complex windfield involving local, lateral convergence–divergence of airflows around small topographic obstacles might explain the complex relationship between rainfall pattern and its controls (cf. Sharon and Arazi, 1997). Such a hypothesis could be investigated if a network of above-canopy anemometers were installed to complement the raingauges.
Conclusions
The presence and nature of systematic local patterns of rainfall within a small humid tropical catchment has been examined within a region known to experience seasonal reversal of the regional windfield.
A very large spatial variability or ‘localisation’ in rainfall was observed within the 12-month and 6-month seasonal totals at very fine scales. Moreover, a systematic, stochastic structure was found in 12 and 6-month totals over these scales of only 10s to 100s metres. This could be the first such published observation within the humid tropics.
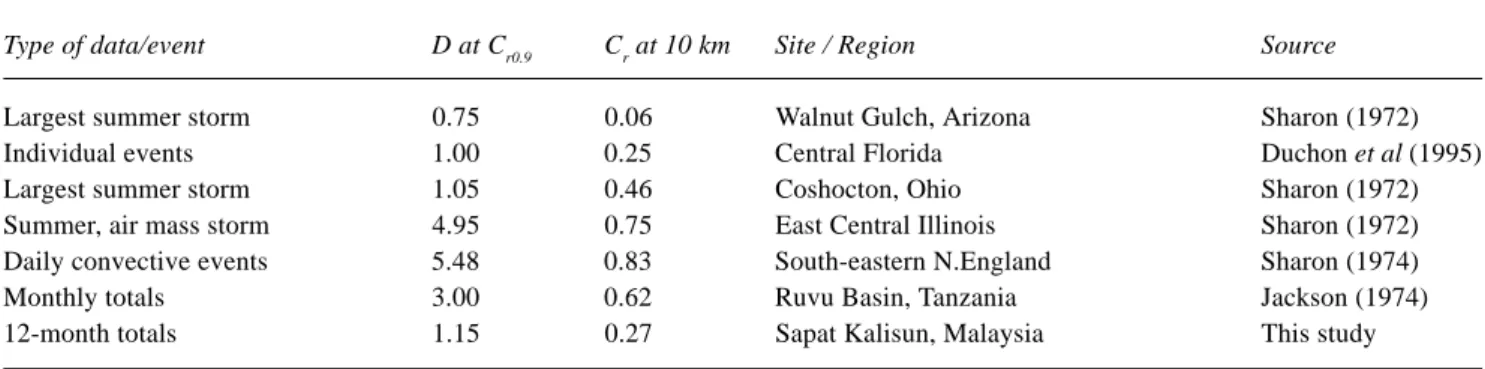
Table 2. Distance (D) for Cr 0.9 and Cr for D = 10 km of for inter-gauge correlation estimates in different climatic regions. All values
estimated (re-analysed) from the Cr -distance regression lines or equations reported by the individual authors.
Type of data/event D at Cr0.9 Cr at 10 km Site / Region Source
Largest summer storm 0.75 0.06 Walnut Gulch, Arizona Sharon (1972)
Individual events 1.00 0.25 Central Florida Duchon et al (1995)
Largest summer storm 1.05 0.46 Coshocton, Ohio Sharon (1972)
Summer, air mass storm 4.95 0.75 East Central Illinois Sharon (1972)
Daily convective events 5.48 0.83 South-eastern N.England Sharon (1974)
Monthly totals 3.00 0.62 Ruvu Basin, Tanzania Jackson (1974)
12-month totals 1.15 0.27 Sapat Kalisun, Malaysia This study
Table 3. Basic statistics of regression analysis for integration periods of rainfall totals against their relative directions
(n=46) showing the marked changes in the rainfall distribution trends between the two monsoon periods.
Directions South-west monsoon North-east monsoon
Plevel Trend r2 P
level Trend r
2
Easting 0.001 +ve 0.51 0.001 –ve 0.23
North-easting 0.001 +ve 0.26 NS* –ve 0.13
Northing NS –ve 0.04 0.01 +ve 0.20
North-west 0.001 –ve 0.46 0.001 +ve 0.50
Notes:
NS – not significant
First evidence of a structured and dynamic spatial pattern of rainfall within a small humid tropical catchment Relative Easting P = -24.58D + 683.7 R2 = 0.2273 P = 68.80D + 724.37 R2 = 0.5058 400 500 600 700 800 900 1000 1100 1200 0.0 1.0 2.0 3.0 4.0 Relative distance (D) in easterly direction (km)
R ainfall totals, P (mm ) Southwest monsoon Northeast monsoon (b) Relative North-easting P= -8.30D + 729.71 R2 = 0.038 P = 40.60D + 397.80 R2 = 0.256 400 500 600 700 800 900 1000 1100 1200 2.0 3.0 4.0 5.0 6.0 7.0 Relative distance (D) in north-easterly direction
(km) R ainfall totals, P (mm ) Southwest monsoon Northeast m onsoon (c) Relative North-westing P= 53.87D -282.2 R2 = 0.504 P = -96.43D + 2502.4 R2 = 0.458 400 500 600 700 800 900 1000 1100 1200 0.0 1.0 2.0 3.0 Relative distance (D) in north-westerly direction
(km) R ainfall totals, P (mm ) Southwest monsoon Northeast monsoon (d) Relative Northing P= 41.48D + 564.09 R2 = 0.1956 P = -32.78D + 916.45 R2 = 0.0347 400 500 600 700 800 900 1000 1100 1200 0.5 1.0 1.5 2.0 2.5 3.0 Relative dis tance (D) in northerly direction (km)
Rainfall totals, P (mm
)
Southwest monsoon
Northeast m ons oon
(a)
Fig. 6. Rainfall delivered within the Southwest and Northeast monsoon periods as a function of their relative bearing as shown. Four
bearings are examined, viz: (a) northing, (b) easting, (c) northeasting, and (d) northwesting.
P = 2.214E + 314.59 (R2 = 0.4663) P = -0.88E + 848.9 (R2 = 0.2709) P = 0.91E + 625.39 R2 = 0.22 P = -0.211E + 689.62 R2 = 0.0417 400 500 600 700 800 900 1000 1100 1200 1300 160 210 260 310 360 410 460
Elevation above sea level, E (m)
R
ainfall totals, P (mm
)
Southwest Northeast
BA Gauges
Fig. 7.Altitude versus point rainfall total for: (a) 6-month periods, and (b) (overleaf) an example weekly sampling period that contains a large
rainstorm. The solid regression line and R2 value outside of the brackets is based upon all data, while the broken regression line and R2 in
brackets excludes data from those raingauges on Atur Hill or Bukit Atur (BA).
These patterns were also very different in the two monsoon periods: this must relate in part to the reversal of the regional windfield. Local associations with aspect and relief are present, but explanation of the direction of the correlations present over the whole 4 km2 catchment must also include lateral convergence–divergence of airflows around the relatively modest relief of the local area. It is hoped that these new findings promote a more comprehensive study of seasonal rainfall patterns at very fine (i.e. experimental catchment) scales within the humid tropics, and that such investigations include a parallel programme of above-canopy windflow measurements over the same fine scale.
Acknowledgements
The authors would like to thank Rahman Merami for help in the collection of the rainfall data and Ismail Abd. bin Samat and Shaidih Abd. bin Samat for their detailed electronic survey of the raingauge locations. The Danum Valley Management Committee are thanked for their permission to conduct research in the Danum Valley area. Financial support for this work has been provided by Universiti Malaysia Sabah (UMS) and the South East Asia Rainforest Research Programme of the Royal Society of London (publication reference A/362).
References
Barry, R.G., 1981. Mountain weather and climate. Methuen, London.
Basist, A., Bell, G.D. and Meentemeyr, V., 1994. Statistical relationships between topography and precipitation patterns. J.
Climate, 7, 1305–1315.
Bidin, K., 2001. Spatio-temporal variability in rainfall and
wet-canopy evaporation within a small catchment recovering from selective tropical forestry. Unpublished Ph.D. thesis, Lancaster
University, UK.
Chappell, N.A., McKenna, P., Bidin, K., Douglas, I. and Walsh, R.P.D., 1999. Parsimonious modelling of water and suspended-sediment flux from nested-catchment affected by selective tropical forestry. Phil.Trans. Roy. Soc. London, Series B, 354, 1831–1845.
Chappell, N.A., Bidin, K. and Tych, W., 2001. Modelling rainfall and canopy controls on net-precipitation beneath selectively-logged tropical forest. Plant Ecology, 153, 215–229.
Cosma, S., Richard, E. and Miniscloux, F., 2002. The role of small-scale orographic features in the spatial distribution of precipitation, Quart. J. Roy. Meteorol. Soc., 128, 75–92. Estoque, M.A., Sta. Maria, M.V. and Villarin, J.T., 2000.
Climatology of rainfall and wind for the Philippine-south Sea region: 1. Monthly variations. Scientific Report No.1, Manila
Observatory, Manila.
Goodrich, D.C., Faures, J.M., Woolhiser, D.A., Lane, L.J. and Sorooshian, S., 1995. Measurement and analysis of small-scale convective storm rainfall variability. J. Hydrol., 173, 283–308. Greer, T., Douglas, I., Bidin, K., Sinun, W. and Jadda, S., 1995. Monitoring geomorphological disturbance and recovery in commercially logged tropical forest, Sabah, East Malaysia, and implications for management. Singapore J. Tropical Geogr. 16, 1–21.
Hendrick, R.L. and Comer, G.H., 1970. Space variations of precipitation and implications for raingauge network design. J.
Hydrol., 10, 151–163.
Hershfield, D.M., 1965. On the spacing of raingauges. Symposium Design of Hydrological Networks, In IAHS publ. 67, 72-79. Hutchinson, P., 1972. Comment on “the relative efficiency of the
density of raingauge networks” by Ph. Th. Stol. J. Hydrol., 17, 243–246.
Jackson, I.J., 1978. Inter-station rainfall correlation under tropical condition. Catena, 1, 235–256.
Lyons, W.F. and Bonell, M., 1994. Regionalization of daily mesoscale rainfall in the tropical wet dry climate of the Townsville area of Northeast Queensland during the 1998-1989 wet season. Int. J. Climatol., 14, 135–163.
McPherson, G., 1990. Statistics in scientific investigation. Its
Basis, application, and interpretation. Springer, Heidelberg,
Germany.
Shah, S.M.S., O’Connell, P.E. and Hosking, J.R.M., 1996. Modelling the effects of spatial variability in rainfall on catchment response. 1. Formulation and calibration of a stochastic rainfall field model. J. Hydrol., 175, 67–88. Sharon, D., 1972. Spatial analysis of rainfall data from dense
networks. Hydrolog. Sci. Bull., 17, 291–300.
P = 1E-10E4.5634 (R2 = 0.6385) P = -0.456E + 169.83 (R2 = 0.718) 0 10 20 30 40 50 60 70 80 90 100 160 210 260 310 360 410 460
Elevation above sea level, E (m)
R ainfall totals, P (m m) 13/03/98 (Northeast) 18/6/97 (Southwest) BA Gauges (b)
First evidence of a structured and dynamic spatial pattern of rainfall within a small humid tropical catchment
Sharon, D. and Arazi, A., 1997. The distribution of wind-driven rainfall in a small valley: an empirical basis for numerical model verification. J. Hydrol., 201, 21–48.
Thielen, J. and Gadian, A., 1994. Influence of different wind directions in relation to topography on the outbreak of convection in Northern England. Ann. Geophysicae, 14, 1078– 1087.
Weston, K.J. and Roy, M.G., 1994. The directional-dependence of the enhancement of rainfall over complex orography.
Meteorol. Applications, 1, 267–275.
Wrinkler, R.L. and Hays, W.L., 1975. Statistics: Probability,
Inference and Decision. Second Edition. Holt, Rinehart and