HAL Id: hal-00299386
https://hal.archives-ouvertes.fr/hal-00299386
Submitted on 30 Nov 2006
HAL is a multi-disciplinary open access
archive for the deposit and dissemination of
sci-entific research documents, whether they are
pub-lished or not. The documents may come from
teaching and research institutions in France or
abroad, or from public or private research centers.
L’archive ouverte pluridisciplinaire HAL, est
destinée au dépôt et à la diffusion de documents
scientifiques de niveau recherche, publiés ou non,
émanant des établissements d’enseignement et de
recherche français ou étrangers, des laboratoires
publics ou privés.
coast of Thailand
F. Løvholt, H. Bungum, C. B. Harbitz, S. Glimsdal, C. D. Lindholm, G.
Pedersen
To cite this version:
F. Løvholt, H. Bungum, C. B. Harbitz, S. Glimsdal, C. D. Lindholm, et al.. Earthquake related
tsunami hazard along the western coast of Thailand. Natural Hazards and Earth System Science,
Copernicus Publications on behalf of the European Geosciences Union, 2006, 6 (6), pp.979-997.
�hal-00299386�
www.nat-hazards-earth-syst-sci.net/6/979/2006/ © Author(s) 2006. This work is licensed under a Creative Commons License.
and Earth
System Sciences
Earthquake related tsunami hazard along the western coast of
Thailand
F. Løvholt1,4, H. Bungum2,4, C. B. Harbitz1,4, S. Glimsdal1,4, C. D. Lindholm2,4, and G. Pedersen3,4 1Norwegian Geotechnical Institute, Oslo, Norway
2NORSAR, Kjeller, Norway
3University of Oslo, Dept. of Mathematics, Norway 4International Centre for Geohazards, Oslo, Norway
Received: 26 September 2006 – Revised: 21 November 2006 – Accepted: 21 November 2006 – Published: 30 November 2006
Abstract. The primary background for the present study was
a project to assist the authorities in Thailand with develop-ment of plans for how to deal with the future tsunami risk in both short and long term perspectives, in the wake of the dev-astating 26 December 2004 Sumatra-Andaman earthquake and tsunami. The study is focussed on defining and analyz-ing a number of possible future earthquake scenarios (mag-nitudes 8.5, 8.0 and 7.5) with associated return periods, each one accompanied by specific tsunami modelling. Along the most affected part of the western coast of Thailand, the 2004 tsunami wave caused a maximum water level ranging from 5 to 15 m above mean sea level. These levels and their spatial distributions have been confirmed by detailed numerical sim-ulations. The applied earthquake source is developed based on available seismological and geodetic inversions, and the simulation using the source as initial condition agree well with sea level records and run-up observations. A conclusion from the study is that another megathrust earthquake gener-ating a tsunami affecting the coastline of western Thailand is not likely to occur again for several hundred years. This is in part based on the assumption that the Southern Andaman Microplate Boundary near the Simeulue Islands constitutes a geologic barrier that will prohibit significant rupture across it, and in part on the decreasing subduction rates north of the Banda Ache region. It is also concluded that the largest credible earthquake to be prepared for along the part of the Sunda-Andaman arc that could affect Thailand, is within the next 50–100 years an earthquake of magnitude 8.5, which is expected to occur with more spatial and temporal irregular-ity than the megathrust events. Numerical simulations have shown such earthquakes to cause tsunamis with maximum water levels up to 1.5–2.0 m along the western coast of Thai-land, possibly 2.5–3.0 m on a high tide. However, in a longer time perspective (say more than 50–100 years) the potentials
Correspondence to: F. Løvholt
(flo@ngi.no)
for earthquakes of similar magnitude and consequences as the 2004 event will become gradually larger and eventually posing an unacceptable societal risk. These conclusions ap-ply only to Thailand, since the effects of an M 8.5 earthquake in the same region could be worse for north-western Suma-tra, the Andaman and Nicobar Islands, maybe even for Sri Lanka and parts of the Indian coastline. Moreover, further south along the Sunda arc the potentials for large ruptures are now much higher than for the region that ruptured on 26 December 2004.
1 Introduction
The 26 December 2004 Indian Ocean tsunami is the most destructive tsunami in modern times; it caused in the range of 2–300 000 casualties. The tsunami was generated by the gigantic magnitude 9.1–9.3 Sumatra-Andaman earthquake (Stein and Okal, 2005; Kanamori, 2006) caused by propa-gating stress release on the subduction zone created by the steadily ongoing northeast subduction of the Indo-Australian plate under the Burma/Sunda plate, along the Sunda arc. The earthquake caused vertical seabed movements of up to 4–5 m (Banerjee et al., 2005; Subarya et al., 2006) over a total area of about 1200 km by 300 km. A large number of papers have already been published on this earthquake and on its tectonic setting (e.g., Lay et al., 2005; Ammon et al., 2005).
The largest destruction caused by the 2004 Indian Ocean tsunami is found in the Ache region closest to the earth-quake epicentre, with maximum tsunami run-up values of more than 30 m, and with run-up of 10–20 m along large sec-tions of the coastline (Japanese survey team, 2006a; Yalciner et al., 2005; Borrero et al., 2006; Jaffe et al., 2006). More-over, devastating effects are found over an enormous geo-graphical area, with dominating run-up and maximum water level of 5–10 m along the shorelines of Andaman, Nicobar, Sri Lanka, and western Thailand, and several meters along
most of the eastern Indian coastline, Myanmar, Malaysia, the Maldives, and parts of eastern Africa (Synolakis and Kong, 2006; Japanese survey team, 2006a; Yalciner et al., 2005; Pa-padopoulos et al., 2006). An extensive collection of field sur-veys reporting the run-up, maximum water levels, and dam-age for most affected countries in the Indian Ocean is given in a special issue of Earthquake Spectra (see Iwan, 2006).
The 2004 Indian Ocean tsunami raised a number of ques-tions on how to deal with tsunami hazard and risk, including early warning. Evaluating the risk for all the countries poten-tially affected by tsunamis generated by earthquakes along the Sunda arc is a formidable task. Hence as a small con-tribution to this end, we limit our study on potential tsunami hazard to western Thailand, using a scenario based approach. The present paper is based on a project to assist the author-ities in Thailand with evaluating the future tsunami risk and to develop plans for how to deal with the risk, with main purpose to establish practical guidelines for land use and re-habilitation of the exposed areas. The results of this project are presented by NGI (2006), and also briefly presented by Karlsrud et al. (2005).
Benefit is also made from the experience gained by Glims-dal et al. (2006), which studied sensitivity to earthquake sources and dispersion. However as opposed to Glimsdal et al. (2006) this paper also includes a hazard study of poten-tial earthquake generated tsunamis. In addition, the present simulation of the 2004 Indian Ocean tsunami is based on up-dated information about the earthquake, and we compare our results with a larger amount of measured sea level and run-up data.
The first part of this paper describes the rupture process and how this is represented in our modelling of the 26 De-cember 2004 Sumatra-Andaman tsunami. Next, our numer-ical modelling of the 2004 Indian Ocean tsunami is docu-mented in more detail, including comparison with observa-tions and energy calculaobserva-tions. Then the locaobserva-tions and magni-tudes of scenarios for possible future earthquakes, and their respective return periods are presented. The earthquake sce-narios are then used as input to numerical tsunami simula-tions, and tsunami design criteria for Thailand based on these simulations are presented. Based on NGI (2006), this paper concludes with a brief discussion of tsunami risk, including some proposed mitigation measures along the coast of Thai-land.
2 The 26 December 2004 Sumatra-Andaman earth-quake
2.1 The rupture process
The 26 December 2004 Sumatra-Andaman earthquake is still known only to a first order, in particular with respect to the distribution of stress, asperities and dislocations in the focal region. These factors largely govern the patterns of surface
rupture along the fault as well as the spatial (and temporal) distribution of seabed dislocations, which in turn controls the generation of the tsunami. Even so, there are already a large number of papers which are addressing this (e.g., Ammon et al., 2005; Banerjee et al., 2005; Bilham et al., 2005; Ishii et al., 2005; Park et al., 2005; Lay et al., 2005; Stein and Okal, 2005; Subarya et al., 2006; Titov et al., 2005; Vigny et al., 2005), and many more will appear in the near future.
The earthquake rupture initiated west of the northern tip of Sumatra, near the Simeulue Island. Within ten minutes after initiation, the earthquake slip had propagated about 1200 km northwards from the epicentre, but in a very complicated way and with significant variations along the way in terms of rupture velocity, slip, and energy release, as shown by Ni et al. (2005) and Kr¨uger and Ohrnberger (2005). The rup-ture velocity was highest in the south, slowing down further north according to Bilham (2005). However, Wang and Liu (2006) suggested that the rupture speed may have sustained northwards.
2.2 Earthquake source model
For the simulation of the 2004 Indian Ocean tsunami, the earthquake source is established through an iterative process to ensure that it largely complies with the available seismic and geodetic information described above, and at the same time produces tsunami heights and arrival times in agree-ment with observations. The earthquake source is a simpli-fied version of, but still largely consistent with, published results, and it is composed of individual segments described in Table 1. For each segment the position, dip angle, dip-slip, strike-dip-slip, width, and sea depth over the fault are spec-ified. It has been assumed here that the average rigidity on the rupture plane for the megathrust event is 40 GPa (Bilek and Lay, 1999), which for the segments combined gives a re-leased seismic moment corresponding to a magnitude (MW)
of 9.28. The constant shear modulus is yet another simplifi-cation for a parameter which in the real case should be ex-pected to vary considerably both horizontally and vertically. A method based on an analytical model (Okada, 1992) is used to convert composite earthquake slip motions to seabed displacements, and the response of a number of segments that are treated as independent faults is computed. Okada’s model has been applied differently in literature with respect to ex-tending the fault to the seabed surface. Initially, the tip of the fault segment was located a few kilometres below the seabed, which however resulted in artificial displacements that dom-inated locally above the tip of the fault in the proximity of the trench. The artificial displacements had typical wave-lengths of the same order as the distance from the fault tip to the seabed, hence orders of magnitude smaller than the dominating seabed displacement length. Moreover, the ini-tial maximum surface elevation was doubled. Because of the artificial effect, the model is not considered reliable when the fault is buried; consequently the average slip motion values
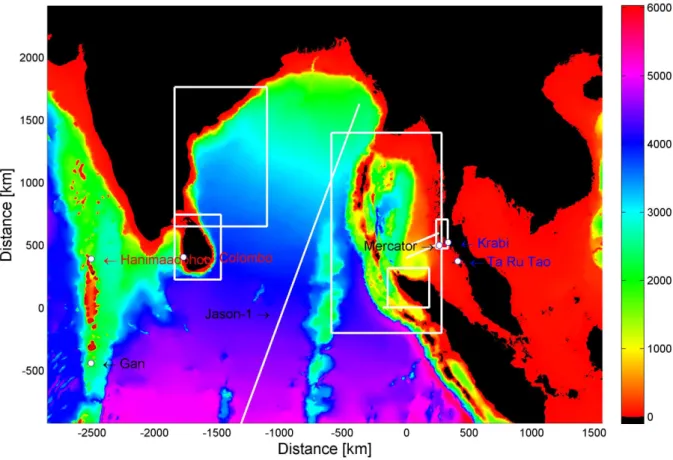
Fig. 1. Water depths in the Indian Ocean. The white boxes indicate the extent of the maps in Fig. 2, and in Figs. 6 through 8. The white lines indicate the cross sections used in the one-dimensional numerical model, and the trajectory of the satellite Jason-1. The locations of the sea level gauges given in Fig. 4 are shown as white circles. The colourbar indicating the water depth in meters, are also used subsequently in Figs. 6 through 8.
are transferred unchanged to the surface instead. A linear variation is assumed along the fault segment. The computa-tion of the seabed displacement is not implying any energy loss mechanisms, which is a conservative assumption.
The initial sea surface displacement is copied from the bot-tom deformation, except near discontinuities at the fault line where a two-dimensional solution of the Laplace equation es-tablished by application of matched asymptotics is employed in cross-sections as a kind of “stripe” theory to give a smooth surface with finite gradients (Pedersen, 2001).
The proposed source is in general agreement with differ-ent reconstructions of the earthquake slip distribution us-ing geodetic data (e.g. Subarya et al., 2006; Chlieh et al., 2006); however, the uniform slip in the dip direction is an im-portant simplification compared to the geodetic reconstruc-tions. Nevertheless, this assumption was maintained, partly because the method should be used for modelling smaller earthquake scenarios as well, and partly because the detailed slip distribution is still not known. Finally, the northward delay of rupture along the fault is not included. This might marginally affect the arrival times and the spatial distribution of run-up heights, see Glimsdal et al. (2006) and Wang and Liu (2006) for discussions.
3 Simulation of the 2004 Indian Ocean tsunami
3.1 Applied model and grid
A linear shallow water (LSW) numerical model is used for the two-dimensional (depth-averaged with two horizontal di-mensions) simulation of the 2004 Indian Ocean tsunami. In the LSW model, the shore line is represented by a vertical and impermeable wall (no-flux boundary conditions), pro-viding a doubling of the surface elevation due to reflection. It is found that the longest waves encountered are shorter than the Rossby radius (see e.g. Gill, 1982), and neglect-ing the rotational Coriolis effect is therefore considered ac-ceptable. The LSW model is solved numerically on a stag-gered grid in time and space, often referred to as the Arakawa C-grid (Mesinger and Arakawa, 1976). Model stability is ensured by adjusting the time step through the CFL crite-rion. It should moreover be noted that effects of dispersion is not included in the LSW model. The study by Glimsdal et al. (2006) concludes that effects of dispersion are not impor-tant for the open ocean propagation. For further details on the numerical LSW model, see Harbitz and Pedersen (1992).
Table 1. Scenario earthquake segmentation and parameterization for use in tsunami modeling. The columns denote rigidity, segment length, width and slip in both ends of each segment (from S to N), seismic moment and corresponding magnitude. The last line gives the total numbers for each event.
Rigidity L W1–S W2–N S1–S S2–N Moment Mag. (GPa) (km) (km) (km) (m) (m) (Nm) MW 40 182.5 210 160 17.5 18 2.07 E+22 8.82 40 181.2 210 160 17 17.5 2.00 E+22 8.81 40 94 160 140 5 5 2.82 E+21 8.24 40 185 140 155 19 15 1.84 E+22 8.78 40 185 155 170 12 19 1.88 E+22 8.79 40 185 170 210 9.2 11.1 1.44 E+22 8.71 40 189 210 210 6 4 7.94 E+21 8.54 M 9.28 1200 1.09 E+23 9.28 30 160 100 100 7.25 0 1.74 E+21 8.10 30 160 100 100 7.25 7.25 3.48 E+21 8.30 30 160 100 100 0 7.25 1.74 E+21 8.10 M 8.5 480 6.96 E+21 8.50 20 50 30 30 3.625 0 5.44 E+19 7.10 20 50 30 30 3.625 3.625 1.09 E+20 7.30 20 50 30 30 0 3.625 5.44 E+19 7.10 M 7.5 150 2.17 E+20 7.50 15 28 17.5 17.5 2.625 0 9.65 E+18 6.60 15 28 17.5 17.5 2.625 2.625 1.93 E+19 6.80 15 28 17.5 17.5 0 2.625 9.65 E+18 6.60 M 7.0 84 3.86 E+19 7.00
The bathymetric grid used for the two-dimensional sim-ulations is shown in Fig. 1; based on the General Bathy-metric Chart of the Ocean (GEBCO), with 1 min resolution (1.84 km×1.85 km). Transformation into a Cartesian grid co-ordinate system is performed using a cylindrical projection. This linearization gives no error for north-south and insignif-icant errors for east-west directions within our computational domain. The error at 15◦N (i.e. 1300 km north of epicentre)
is less than 3% within the Bay of Bengal, decreasing to zero at the latitude of the epicentre.
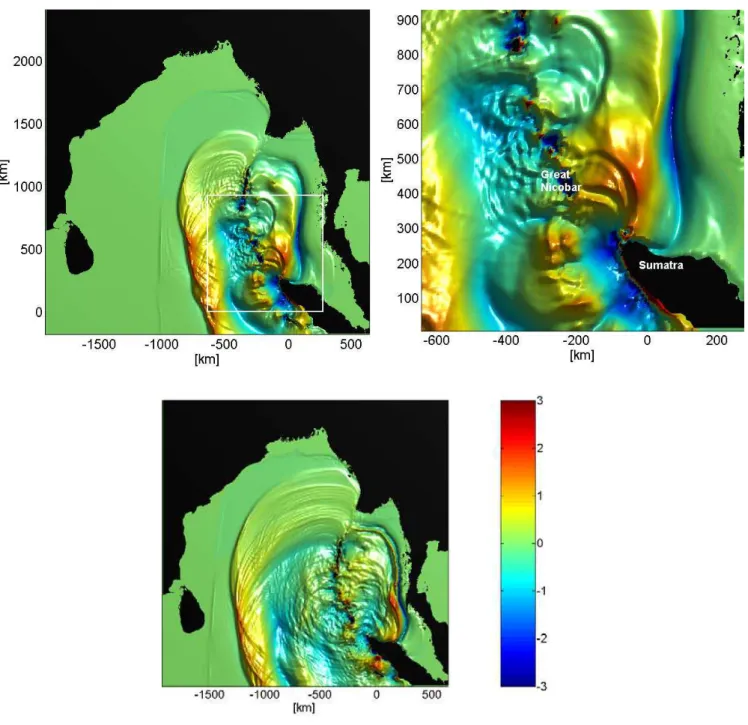
Using the two-dimensional LSW model described above, we performed a simulation of the 2004 Indian Ocean tsunami using the initial condition shown in Fig. 2. Snapshots of the calculated surface elevations in the Bay of Bengal after 40 and 80 min are shown in Fig. 3.
To investigate convergence, we compare simulated time series on the 1′ grid with simulated time series on coarser
grids with resolutions of 2′ and 4′. For example, at Bang
Niang, Thailand, with depth 33 m, we find for the first wave pulse a discrepancy of 25% between the 2′and 4′grids, and
8% between the 1′and the 2′grids. For the location of
Mer-cator (see Fig. 1) at a depth of 13 m, the discrepancy between the 1′and the 2′grids for the first wave pulse is 12%. Other
time series locations gave similar results. Because the con-vergence rate for the numerical model is quadratic, we can roughly expect errors less than 3% between 0.5′and 1′grids
for depths larger than 10 m. For the regional study performed
here, we therefore find the grid resolution and accuracy of the map projection to be sufficient, as also supported by earlier investigations (Glimsdal et al., 2006).
3.2 Comparison with sea level measurements
The two-dimensional simulation is compared to correspond-ing tide-gauge records at Ta Ru Tao and Krabi (south-ern Thailand), Gan and Hanimaadohoo (Maldives), and Colombo (Sri Lanka), (see e.g. Merrifield et al., 2005; Japanese survey team, 2006b), and sea-level recordings from the yacht Mercator located about 2 km outside Nai Harn Bay, Phuket Island (KNMI web page, 2005), as shown in Fig. 4. Geographical co-ordinates were not found for several of the sea level records and when they were found, they often corre-sponded to erroneous locations in the computational grid due to coarse grid resolution and small projection errors. There-fore, the locations of the sea level records are corrected man-ually. In addition, sparse sampling rates limit detailed com-parisons for some of the sea level records. The sea level records are mostly located near the coast (Merrifield et al., 2005), and one should preferably make use of local bathyme-tries for capturing local effects. However, studying local ef-fects is beyond the scope of this paper.
The time series in Fig. 4 show several wave cycles, with dominating wave periods in the range of 20 to 40 min. In-deed, keeping in mind various sources of errors (elaborated
below), and the geographical spread of the observations, the computed wave characteristics (i.e. amplitudes and periods) agree reasonably well with the sea level observations as a whole. However, a more detailed investigation of the time series in Fig. 4 reveals discrepancies that need further atten-tion. From Fig. 4, we see that:
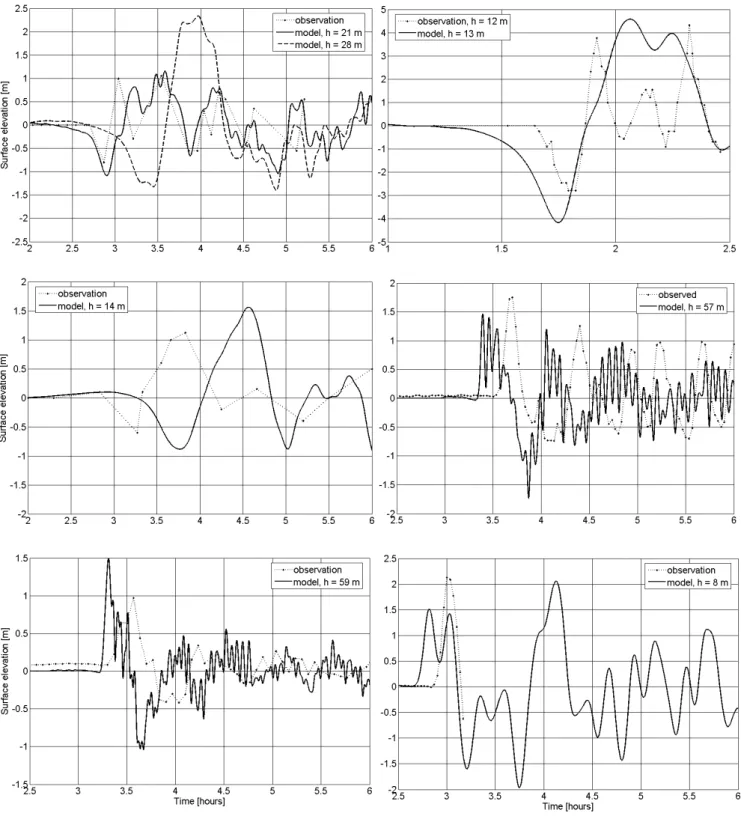
1. Two computed time series located approximately 10 km from each other, are compared with one sea level ob-servation at Ta Ru Tao. Only one of them (solid line) gives good correspondence with the sea level data, the other one (dashed line) gives a longer wave period and a larger maximum surface elevation. The difference be-tween the two computed time series shows that local ef-fects can cause large differences in the wave evolution within short distances.
2. The dominating wave period is overestimated for the lo-cation of Mercator. The discrepancy may be due to a combination of local effects not captured in the tsunami model, and short wave components that are not included in the synthetic earthquake source model.
3. Computed arrival times deviate from observed ones in most locations. Because all the time series are located in shallow water, the arrival time is sensitive to the lo-cation of the time series, as well as to grid effects. In particular, the deviation of 30 min at the Krabi location appears as strange, as the wave shape is mimicked well in the computations. A possible reason for the devia-tion may be errors in the applied bathymetry, but most likely this is due to errors in reference time as reported by Tsuji and Satake (2006).
4. Pronounced short-period wave components are found in the computed time series at Hanimaadohoo and Gan. The periods are approximately 5 min, resulting in wave-lengths of approximately 5 km that are only covered by 3 grid cells in each horizontal direction, and are there-fore not properly resolved. The short-period compo-nents may be caused by grid effects, or more precisely stair case boundaries (Pedersen, 1995).
5. The withdrawal amplitude is slightly overestimated in most of the computed time series. The overestimation might be a result of lack of damping in the earthquake dislocation model and the Okada parameterization, giv-ing too large amplitudes for the negative surface dis-placements.
By chance, the Jason-1 satellite (see e.g. Smith et al., 2005) recorded the tsunami as it passed over the Indian Ocean. The recording started approximately 1 h 55 min after the tsunami was generated, and used about 8 min to traverse the path from south to north. A comparison with the data from the Jason-1 satellite is shown in Fig. 5 for three different simulation
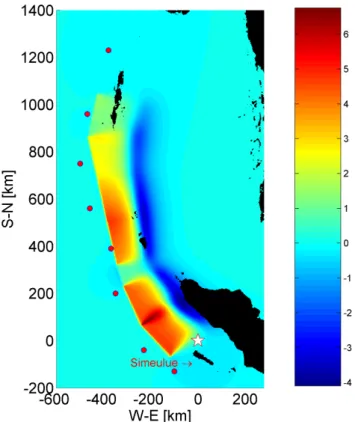
Fig. 2. The initial sea surface elevation used for the simulation of the 2004 Indian Ocean tsunami. The white star indicates the epi-centre. The boundary between the Indian Plate and the Burma plate is indicated with red bullets.
times. Along the southernmost part of the profile, the simu-lation taken at 1 h 55 min compare rather well with Jason-1. Northward, the results are not matching as well, which can be explained from several reasons. First, the calculated sur-face elevation is evaluated exactly at one given time along the trajectory. Next, parts of the wave crests (approximately be-tween latitudes 5–15◦north) are almost parallel to the
trajec-tory of Jason-1, which means that a slight spatial or temporal shift gives a large effect on the surface elevation. Sensitivity is also illustrated by evaluating the surface elevation 3 min before and 3 min after the start of the recording, giving errors in the surface elevation up to 100% even along the southern-most part of the profile, caused by a shift in phase of ap-proximately 30′ (i.e. about 50 km). Moreover, the increased
discrepancy northward could be explained by a non-uniform slip distribution in the dip direction, as suggested by Wang and Liu (2006). In addition, the waves observed along the northernmost part of the Jason-1 path are strongly influenced by reflections from islands, as shown already after 80 min of propagation (Fig. 3), making the wave field hard to mimic.
Fig. 3. Simulation snapshots of the 2004 Indian Ocean tsunami in the Bengal Bay and the Andaman Sea. Upper left panel: surface elevation after 40 min; Upper right panel: close-up of the inner frame of the upper left figure; Lower panel: surface elevation after 80 min.
3.3 Comparison with run-up heights and maximum water levels
The two-dimensional simulations have been compared with observations of run-up heights and maximum water lev-els (according to the definitions of the Intergovernmental Oceanographic Commission of UNESCO, 2006) along the coastlines of western Thailand, eastern India (Fig. 6), north-ern Sumatra (Fig. 7) and Sri Lanka (Fig. 8). Run-up data
are taken from the Japanese survey team (2006a), University of Poznan (2005), Yalciner et al. (2005) for Thailand and Sumatra, and from Geological Survey of India (2005) and Yeh et al. (2006) for south-eastern India. Maximum water levels for Sri Lanka are taken from Liu et al. (2005). The fig-ures do not cover all data points in the various investigations, but represent typical data used for comparison with the sim-ulations mentioned above, as the run-up may vary on local scales that are below the grid resolution in the model. Their
Figure 4. Comparison of computed surface elevation time series of the 2004 Indian Ocean
Fig. 4. Comparison of computed surface elevation time series of the 2004 Indian Ocean tsunami with observations at Ta Ru Tao (upper left panel), Mercator (upper right panel), Krabi (mid left panel), Hanimaadohoo (mid right panel), Gan (lower left panel), and at Colombo (lower right panel). The times series at Ta Ru Tao and Krabi are taken from Japanese survey team (2006b); Hanimadohoo, Gan, and Colombo from Merrifield et al. (2005); and Mercator from KNMI web page (2005).
Table 2. Total wave energies of ancient and historical tsunamis.
Tsunami Source Estimated tsunami Background data energy [J]
2004 Indian Ocean Earthquake 3.5×10¹⁵ This paper
1998 Papua New Guinea Landslide 8×10¹³ Okal and Synolakis (2003) 1964 Alaska Earthquake 2×10¹⁵ Kajiura (1981)
1960 Chile Earthquake 1×10¹⁶ Kajiura (1981) 1886 Krakatau Volcano 1×10¹⁶ Choi et al. (2003) 8100 BP Storegga Landslide 4×10¹⁶ Bondevik et al. (2005) 142 MY BP Mjølnir Asteroid impact 2×10¹⁸ Glimsdal et al. (2006)
−5 0 5 10 15 −1 −0.8 −0.6 −0.4 −0.2 0 0.2 0.4 0.6 0.8 1 latitude ° Surface elevation [m] Jason−1 Model, 1 h 55 min Model, 1 h 52 min Model, 1 h 58 min
Fig. 5. Comparison of the simulation of the 2004 Indian Ocean tsunami with the recordings of Jason-1 (Smith et al., 2005) for three different times of simulation.
positions along the coastline are plotted manually together with the simulated maximum surface elevations (ηmax) in
Fig. 6 through Fig. 8.
For the coastlines investigated here, the wave lengths are in general long compared to the run-up zone. Hence, the ampli-fication is limited and fairly well described by no-flux bound-ary conditions along the shoreline. This is supported by run-up profiles in Thailand and Sumatra, indicating that the in-undation levels did not increase inland from the shore (NGI, 2006, page B5; Jaffe et al., 2006). For the regional study per-formed here, it was decided to compare the maximum sur-face elevations close to the shoreline instead of performing explicit run-up simulations, partly because a large number of run-up simulations are hardly feasible, and partly because a run-up model capturing the effects of the muddy flow ob-served on videos (http://www.asiantsunamividoes.com) far onshore is not available.
The maximum surface elevations considered in this study are restricted to ocean depths larger than 10 m. The sensi-tivity to the limit depth was tested for depths of 5 and 20 m, as illustrated for Thailand in Fig. 6. A distinct increase in ηmaxfrom 20 to 10 m depth is shown; however ηmaxdoes not
increase similarly for depths from 10 to 5 m. The same
con-clusion has also been reached for other locations. In addition, the amplification due to shoaling at different depths com-pares favourably with Green’s law (see e.g. Mei, 1989). The typical surface elevation-to-depth ratios defined as α=ηmax/h
are then in the range of 0.1–1 for depths larger than 10 m, ex-cept for the coastline of northern Sumatra where the largest α values are close to 2. Although values of α>0.1 represent data above the validity of the linear model, using the results beyond the linear limit has been proven useful in a similar investigation by Løvholt et al. (2005). The limit value of 10 m is therefore a reasonable compromise to ensure that the shoaling effect is taken into account, that the artificial grid effects are kept reasonably low, and that the violation of the linear limit is restricted.
Figures 6 through 8 show that the spatial distributions of the calculated maximum surface elevations correspond re-markably well with the observed run-up distribution, and in several locations also with the run-up height. However, our regional study fail to capture all details of the run-up distri-bution, as should be expected since the model lacks a fine grid, local bathymetries, and run-up calculations. For exam-ple, the extreme run-up of +30 m at Lhoknga (Borrero et al., 2006) at northern Sumatra is not captured. Next, the simula-tion gives smaller elevasimula-tions along south western Sri Lanka than reported in the field investigation of Liu et al. (2005), who reports that the largest destructions in western Sri Lanka were caused by the third positive wave. This is obviously not properly captured in our simulation. Finally, ηmax close to
Banda Ache is generally about one half of the observed run-up heights. One likely reason for the small values of ηmax,
is that wave propagation through the strait between Sumatra and the islands to the north is prohibited in the applied grid.
Figure 6 shows that the run-up distribution along Thailand is reasonably well represented by ηmaxin the simulation,
al-though ηmaxis slightly larger than the observed run-up north
of Bang-Niang, and along parts of central Phuket. However, previous investigations with several other earthquake mod-els gave results with a markedly more even distribution of ηmax, failing to reproduce the observed northward increase
Figure 6. Simulation of the 2004 Indian Ocean tsunami. Left panel: Maximum computed
Fig. 6. Simulation of the 2004 Indian Ocean tsunami. Left panel: Maximum computed surface elevation in western Thailand using the LSW model for depths larger than 5 m (green line), 10 m (blue line), and 20 m (red line), compared with observed run-up heights (black bars Japanese survey team, 2006a; red bar University of Poznan, 2005). The mid left panel shows the water depth in western Thailand, where the colourbar gives water depths in m. The mid right panel shows the maximum computed surface elevation in south-eastern India using the LSW model for depths larger than 10 m (blue line), compared with observed run-up (black bars, Geological Survey of India, 2005; red bars Yeh et al., 2006). The right panel shows the water depth in south-eastern India (colourbar given in Fig. 1).
Figure 7. Left panel: Maximum computed surface elevation in northern Sumatra using the
Fig. 7. Left panel: Maximum computed surface elevation in northern Sumatra using the LSW model for depths larger than 10 m (blue line), compared with observed run-up (black bars, Japanese survey team, 2006a; red bars Yalciner et al., 2005). Mid panel: Water depth at northern Sumatra (colourbar given in Fig. 1), where the white box indicates the extent of the lower right map of Banda Ache. Upper right panel: Maximum computed surface elevation in Banda Ache using the LSW model for depths larger than 10 m (blue line), compared with observed run-up (bars) of Japanese survey team (2006a). Lower right panel: Water depth in northern Banda Ache (colourbar given in Fig. 1).
wave emerging between northern Sumatra and Great Nico-bar, being responsible for the main damage along Thailand. Moreover, this wave is interfering with a wave emerging be-tween the Nicobar and Andaman Islands, which finally give the complicated distribution of ηmaxalong western Thailand
as shown in Fig. 6. Northwards from Phuket, the slope
in-clination of the continental margin decreases, which could in addition explain some of the increase in run-up.
3.4 Energy of the 2004 Indian Ocean tsunami
The potential energy E0 of the initial surface elevation of
Fig. 8. Maximum computed surface elevation using the LSW model for depths larger than 10 m (blue line) compared with observed maximum water levels (bars) of Liu et al. (2005) at the western (upper left panel), eastern (upper right panel) and southern (lower panel) coastlines of Sri Lanka. The upper central panel shows the water depth aournd Sri Lanka (colour bar is given in Fig. 1).
squared surface elevation over the whole computational do-main according to the expression
E0= 1 2ρg ZZ η2d. (1)
Integrating the initial condition given in Fig. 2, we find for the 2004 Indian Ocean tsunami E0≈3.5×10¹⁵J. Even so, the
energy of the 2004 Indian Ocean tsunami is still only 0.3% of the total radiated earthquake energy suggested by Lay et al. (2005). In Table 2, we also compare the 2004 Indian Ocean tsunami with other historical and ancient tsunamis. The table shows that although the energy of the 2004 In-dian Ocean tsunami is approximately 40 times higher than Papua New Guinea tsunami, there are certainly historical tsunamis with considerably higher energies. Moreover, Ta-ble 2 indicates that tsunamis caused by other sources, e.g. the 8100 BP Storegga slide and the 142 My BP Mjølnir
as-teroid, have caused much higher tsunami energies. It is also noted that even though there are orders of magnitude less casualties resulting from the both the 1883 Krakatau explo-sion tsunami and the M 9.5 1964 Chile earthquake tsunami, their energies may have been higher than the energy of the 2004 Indian Ocean tsunami. Furthermore, the 1964 Alaska tsunami had approximately the same energy as the 2004 In-dian Ocean tsunami, but in comparison it caused very few casualties. This illustrates that factors other than the tsunami energy are important for the extent of destruction, e.g. the displaced water volume, the population patterns close to the generation area, and the vulnerability.
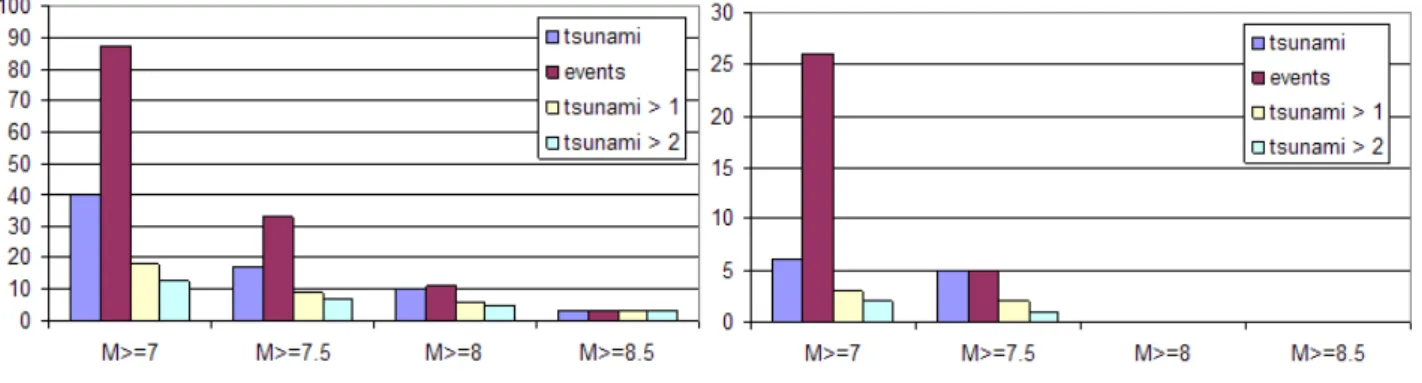
Fig. 9. Tsunami statistics from the South American and Sunda arc subduction zones, for magnitudes above 7.0, 7.5, 8.0 and 8.5, respectively. The red column is the total number of shallow events reported, the blue is the total number of tsunamis reported, and the yellow and green are the number of tsunamis reported above 1 and 2 m, respectively. The data are obtained from the Pacific Tsunami Warning Center data base (http://www.prh.noaa.gov/ptwc/) and Engdahl et al. (1998).
Table 3. Scenario earthquakes used in this study with calculated maximum characteristic surface elevations along western Thailand. Scenario Location of epicenter Calculated surface
eleva-tion [m] M 9.3 26 December 2004 earthquake, Simeulue island 5–10 M 8.5 south Between Sumatra and Nicobar
NicbarNicobar
1–2
M 8.5 north Between Nicobar and Andaman 1–2 M 7.5 south Between Sumatra and Nicobar ∼0.5 M 7.5 mid Between Nicobar and Andaman ∼0.5 M 7.5 north North of Andaman Less than 0.2
(behind Andaman) M 7.0 Between Sumatra and Nicobar ∼0.2
4 Potential future seismic scenarios
4.1 Assumptions, scaling relations and source parameters The assessment of potential future tsunamis is approached through scenarios, treating the probabilism through return periods. A starting point here was found through an analysis of empirical tsunami data from the Pacific Tsunami Warn-ing Center data base, showWarn-ing that for South America, Japan and the Sunda arc combined 34% of the shallow events with M≥7 are reported to have generated a tsunami, 71% for M≥7.5 and 84% for M≥8.0. Most of these tsunamis are small, since less than 20% of them have reported maximum water levels or run-up heights of 3 m or more. The numbers for South America and the Sunda arc are shown separately in Fig. 9 indicating that significant tsunamis from earthquakes below M 8 are very rare. The selection of the scenario mag-nitudes are in part based on this empirical assessment, in part
on tsunami modelling efforts that show the same, and in part on the fact that events above M 8.5 are not likely to occur for a very long time (see the assessment below of return periods). The process of defining scenarios also included an assess-ment of both contemporary (Engdahl et al., 1998; Engdahl and Villase˜nor, 2002) and historical seismicity (e.g., Bilham et al., 2005), as well as the presumed stress situation in the region where earthquakes potentially generating tsunamis af-fecting western Thailand can occur. The M 8.5, M 7.5, and M 7.0 scenarios listed in Table 3 and shown in Fig. 10, re-flect a gradually decreasing potential for large ruptures north-wards along the Sumatra-Nicobar-Andaman segment; the subduction rates are northward decreasing from about 50 to about 10 mm/year (Petersen et al., 2004; Lay et al., 2005; Bilham et al., 2005). The scenarios are located to be worst case with respect to tsunamis affecting the coastal regions of Thailand, in the sense that they are placed between the main
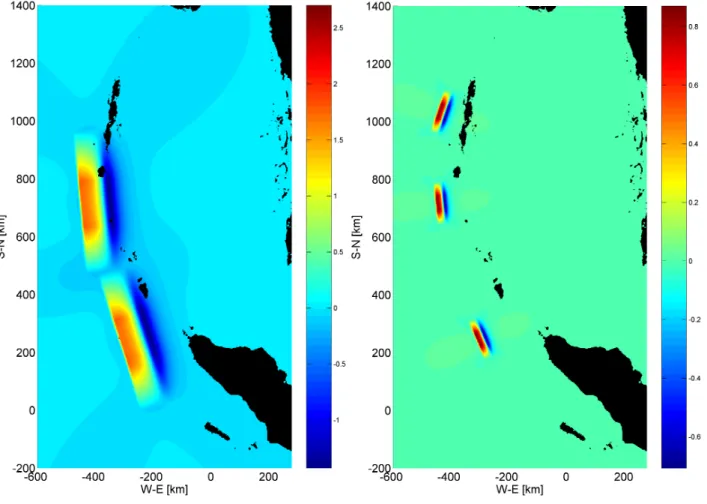
Fig. 10. Initial surface elevation for the M 8.5 south and north scenarios (left panel), and the M 7.5 south, mid, and north scenarios (right panel), cfr. Table 1 and Table 3. The central location of the M 7.0 scenario is identical to the M 7.5 south scenario, and the central location of the M 7.5 mid scenario is identical to the M 8.5 north scenario. The colour bars indicate the surface elevations in m.
island chains with open access eastwards (note that this is neither specifically supported nor excluded tectonically).
Another assumption behind the scenarios is that there is a tectonic barrier near the Simeulue island which is expected to cause north-westward ruptures on the northern side and south-eastward ruptures on the southern side (Singh et al., 2005; DeShon et al., 2005), making it unlikely that a megath-rust earthquake can start south of this barrier region and rupture in a north-westerly direction far enough to gener-ate tsunamis affecting Thailand. Further southeast along the subduction zone, however, the 26 December 2004 event may even have increased the risk for large earthquakes (Stone and Kerr, 2004; Schiermeier, 2005), in a similar way as for the Great Sumatra Fault (McCloskey et al., 2005; Nalbant et al., 2005).
The source parameters for the scenarios are shown in Ta-ble 1 together with the M 9.28 event. While the scenarios are very simple and uniform, they are at the same time based on scaling properties guided by a combination of theoretical (Aki and Richards, 1980) and empirical relations (Wells and
Coppersmith, 1994). For subduction zone events the width can grow more than it can do in plate margin areas, where the sensitivity to magnitude becomes more critical since larger earthquakes (say, above M 6.7) that reach the depth of the seismogenic (brittle) zone can grow only in the horizontal direction (e.g., Scholz, 2002). This means, for example, that the fault length of the scenario earthquakes (Table 1) de-creases with decreasing magnitude somewhat more rapidly than the slip, which in part is related to decreasing rigidi-ties and in part to non-linearirigidi-ties in scaling relations for large earthquakes. In a scaling sense this means that the tsunami-genic potentials decrease less rapidly than the seismic mo-ment of the causative earthquake.
The scaling properties used for the scenario events were also guided by available analyses for the 28 March 2005 Nias M 8.6 earthquake (Ammon et al., 2005; Walker et al., 2005), where the slip was highest in the central parts of the fault zone, consistent with the tapering of the sources in Table 1. The epicentre of the Nias earthquake was 2–300 km south from the epicentre of the 26 December 2004 earthquake and
the main part of the rupture extended south-eastwards from there.
The fault lengths for the M 8.5, 7.5 and 7.0 scenario events in Table 1 are seen to be 480, 150, and 84 km, the widths are 100, 30 and 17.5 km, and the slips are peaking at 7.3, 3.6, and 2.6 m. The average rigidities are set in Table 1 to 30 GPa (M 8.5), 20 GPa (M 7.5), and 15 GPa (M 7.0), reflecting the decreasing depths of the ruptures with decreasing mag-nitudes. The rupture models have been tapered down to zero slip at both ends, maintaining the moment release and the corresponding magnitude. The decreasing rigidity for more shallow ruptures is important since this results in relatively larger dislocations for the smaller events, provided they are so shallow that they rupture through less consolidated sed-iments. These dislocations are averages, however, while in reality they should be expected to follow a distribution which allows for both smaller and larger slips for any given magni-tude, with a similar variation in seabed dislocations. 4.2 Return periods
The M 8.5 event is in subsequent sections shown to represent a crucial magnitude in terms of tsunami effects for Thailand, therefore a key issue in the subsequent risk assessment will be to estimate the return period for such magnitude earth-quakes, even though such estimates are not normally done for scenarios. This problem has been approached along two paths, through magnitude-frequency regressions on available seismicity catalogues, and through tectonic considerations, related to average slip rates for the different parts of the sub-duction zone. The former approach is very uncertain in this case because of the short observational period, and it gives much longer return periods than the tectonic approach, which is based on the assumption that the fault is locked and that the seismic coupling is complete, which we know is true only to some extent. There are, moreover, greatly varying conditions along the trench, including asperities, adding uncertainty also to the tectonic approach.
Using seismological data from 1964 through 2002 (En-gdahl et al., 1998; En(En-gdahl and Villase˜nor, 2002; http: //earthquake.usgs.gov/research/data/centennial.php), we find for the Sumatra Trench a magnitude-frequency relation which yields a return period of 195 years for M 8.5 and 1140 years for M 9.3. Due to the decreasing convergence rates northwards this is, however, less relevant as a reference for the Nicobar-Andaman subduction zone, where we find a seis-micity based return period of 1100 years for M 8.5, and even lower when the zone is further segmented northwards. It is obvious that 36 years of seismicity data is totally insufficient for estimating return times that are much longer than this, especially since temporal variations in seismicity can be sig-nificant also in subduction zones.
Return times as inferred from subduction rates provide in contrast lower bound estimates, assuming complete cou-pling. An average subduction rate of 30 mm/year (average
of 48 in the southern segment and 14 mm/year at the north-ern segment, Bilham et al., 2005; Vigny et al. 2005) for the trench perpendicular convergence on the southern segment, combined with an assumption that a M 8.5 event will release 6 m of slip, gives a return period of 200 years for the south-ern segment, while a rate of 14 mm/year for the northsouth-ern seg-ment gives 430 years. For a megathrust event of M 9+ along the entire northern Sumatra subduction zone an average slip of 13 m and a rate of 48 mm/year will give a tectonically-derived lower bound return period of 270 years, while the seismicity indicated as much as 1140 years. The seismic pling factor can explain some of this difference, since a cou-pling value below 1.0 will give a longer tectonically inferred return period. It is therefore not unreasonable to assume also that an overestimated seismic coupling will increase the megathrust return time to well above 270 years, providing a basis for adjusting the value to about 400 years for a M 9+ event along the northern part of the Sumatra trench. Another reason for this upward adjustment of the subduction-based recurrence interval is the fact that the Sumatra trench con-sidered here includes parts of the zone (south of Simeulue) that is considered to have potentials for rupturing only south-wards.
A similar reasoning for an M 8.5 event on the southern Nicobar-Andaman segment, where the return periods were 200 and 2700 years as derived from subduction and seismic-ity, respectively, will lead to an adjusted value of 400 years. For the northern segment, where subduction rates give 430 years and the seismicity 1800 years, we have adjusted to a value of 800 years. Admittedly, these adjustments include a clear element of expert judgement in a situation with con-siderable uncertainties. When applying this adjustment, a lot more confidence has been given to the tectonically-derived estimates than to the earthquake catalogue which admittedly covers only 36 years of reasonably unbiased data.
At the megathrust level, the only viable scenario for an event affecting the coastal areas of Thailand is one which starts in the northern part of the Sumatra trench and ruptures northwards similar to the 2004 earthquake, not the least be-cause of the tectonic barrier near the Nias 2005 earthquake. Singh et al. (2005) maintain that this barrier is in the form of a lithospheric-scale boundary which starts near the Simeulue Island and continues up to the east of the Nicobar Islands, eventually joining the Sumatra Fault in the north.
In a risk context it should be noted that it is the combined occurrence rates of a megathrust earthquake with the rates of more “local” M 8.5 earthquakes that define the M 8.5+ re-turn periods related to tsunami potentials for Thailand. For the southern segment both of these return periods were 400 years, leading to a combined return period of 200 years (two events over 400 years). For the northern segment the two return periods were 400 and 800 years, so the combined re-turn time in this case will be 270 years (three events over 800 years). These numbers reflect the occurrence rates of the earthquakes, and it is important to keep in mind here that all
Figure 11. Left panel: Snapshot of the M 8.5 south scenario tsunami surface elevation 80
Fig. 11. Left panel: Snapshot of the M 8.5 south scenario tsunami surface elevation 80 min after the earthquake. The cross sections indicate the location of the depth profiles used for the one-dimensional numerical simulations. Right panel: Maximum surface elevations for the M 8.5 south scenario during the whole computational time of 6 h for the Thailand coast. Both colour scales are elevations in m.
of those below megathrust level will not necessarily cause tsunamis, in particular since this requires shallow ruptures.
There is a remaining issue which is equally important as the return period, namely when these events are likely to occur within the occurrence cycle. Paleoseismological research in different subduction zones (e.g., Satake et al., 1996; Clague, 1997; Cisternas, 2005) has indicated that the megathrust events are relatively regular in their occurrence. The implication of this is that another M 9+ event in the Sumatra subduction zone with potential tsunami effects on Thailand is not likely to occur before at least 400 years after the 2004 megathrust earthquake. For the M 8 to 8.5 tsunami-genic events, however, the cyclicity is less predictable (i.e., more Poisson distributed), but even for such events the prob-ability of occurrence will be quite low for a long time after 2004, increasing gradually with time. The reason for this is that the 26 December 2004 rupture covered the entire sub-duction zone up to north of Andaman, thereby releasing ac-cumulated stress over the whole region where the present scenarios are located.
5 Modelling of tsunami scenarios
Using the method described in Sect. 2.2, the slip values given in Table 1 were used to calculate initial sea surface elevations generated by the potential earthquake scenarios as shown for the M 8.5 and M 7.5 scenarios in Fig. 10. The initial sea surface elevations of the scenarios were used as initial condi-tions for the two-dimensional (depth-averaged with two hor-izontal dimensions) tsunami simulations, as documented in the following. In addition, one-dimensional (depth-averaged with one horizontal dimension) simulations along the
pro-files given in Fig. 1 and Fig. 11 were performed. The two-dimensional and the one-two-dimensional models are described in Sects. 3 and 5.1, respectively. It should be noted that for earthquake scenarios with magnitudes less than 9, the gen-erated waves will be more affected by wave dispersion than the 2004 Indian Ocean tsunami was. Effects of dispersion are only accounted for in the one-dimensional simulations.
The results were analysed along the western coast of Thai-land using time series and snapshots. Particular emphasis is given to the locations Patong and Bang Niang, as results with both one-dimensional and two-dimensional models are pro-vided at those locations. Moreover, maximum surface eleva-tions for the whole simulation time were analysed along the coast. The maximum surface elevation maps did not reveal fluctuations along the coast, partly because shorter earth-quake segments limit effects of wave interference. Hence, the results obtained at Patong and Bang Niang represent reasonable values for the maximum surface elevation along western Thailand from Phuket and northwards.
The maximum surface elevations obtained for the differ-ent scenarios are summarised in Table 3, which shows that for the M 8.5 scenarios maximum surface elevations of 1.5– 2 m are generated along western Thailand. For the scenarios with M≤7.5, waves with surface elevation larger than 0.5 m are not produced along western Thailand. It is noted that the M 7.0 scenario produces larger waves than the northern M 7.5 scenario along the coasts of Thailand since the latter earthquake is mainly shielded by the Andaman Islands with regard to Thailand. Detailed results for all the scenarios anal-ysed are too extensive to be presented here; however, details for the M 8.5 south scenario are given as an example in the following.
100 110 120 130 140 150 160 −1.5 −1 −0.5 0 0.5 1 1.5 2 Time [minutes] Surface elevation [m] 1D model, h=31.8m 1D model, h=5.8m 2D model, h=11.3m 100 110 120 130 140 150 160 −1.5 −1 −0.5 0 0.5 1 1.5 2 Time [minutes] Surface elevation [m] 1D model, h=28.2m 1D model, h=15.7m 2D model, h=9.4m
Fig. 12. Time series of the surface elevation at different depths for the M 8.5 south scenario with two- and three-dimensional models; left panel close to Patong, right panel close to Bang Niang.
5.1 Magnitude 8.5 scenario results
The M 8.5 south scenario serves as an example of a possible future tsunamigenic earthquake and it also represents a de-sign tsunami for the western coast of Thailand, for reasons elaborated in Sect. 6. A snapshot of the surface elevation af-ter 80 minutes for the southern M 8.5 scenario together with the maximum surface elevation during a time period of 6 h af-ter the rupture time is given in Fig. 11. The lataf-ter shows max-imum surface elevations of 1–2 m along the coast of Thailand from the Phuket Island and northwards.
Effects of non-linearity and dispersion are modelled with a standard one-dimensional (depth averaged with one horizon-tal dimension) Boussinesq model (Peregrine, 1972), solved on a staggered, non-uniform grid (keeping the Courant num-ber constant) using finite differences, where the shoreline is represented as an impermeable wall. The one-dimensional simulations are performed along the cross-sections towards Patong and Bang Niang shown in Figs. 1 and 11. The depth profiles along the cross-sections are first extracted from the two-dimensional grid by bi-linear interpolation, and then refined to give the finest resolution of 25 m near the coast. Assuming uni-directional wave propagation land-ward along the cross-section, the surface elevations from the two-dimensional simulations are used as initial condi-tions for surface elevation and wave current speeds in the one-dimensional simulations, as described by Glimsdal et al. (2006). It is emphasised that two-dimensional effects in-cluding radial spread, reflections from surrounding islands, refraction, focussing, and interference are neglected. The re-sulting time series along the Patong and Bang Niang cross sections are shown in Fig. 12. Convergence of the results from the one-dimensional numerical model was confirmed by grid refinements, generally showing discrepancies of less
than 1% in the surface elevation. The gentle characteristics of the waves shown in Fig. 12 could indicate that in contrast to the 2004 Indian Ocean tsunami, a magnitude 8.5 or smaller earthquake is not likely to provide breaking waves.
It is noted that the one-dimensional model gives somewhat larger surface elevations than the two-dimensional model for comparable depths. Because the tsunami front is more or less perpendicular to the cross sections (see Fig. 11), the three di-mensional effects listed above are not assumed to have a large effect for the first wave pulse arriving. Moreover, the one-dimensional model includes higher order effects and a grid resolution of about one hundredth of the two-dimensional one, which suggest that the one-dimensional model repre-sents the first pulse better than the two-dimensional model.
For this scenario, which is recommended as design basis on short to medium term, the best estimate of the maximum tsunami surface elevation is found in the range 1.5–2 m above mean sea level as shown in Figs. 11 and 12. These elevations do not take into account variations in tides. The normal high tide in the area of interest is approximately +0.80 m above the mean sea level, and twice a month, during the spring tide, the water level is as much as +1.5 m above this level.
6 Risk assessment and mitigation measures
The risk associated with potential tsunamis towards Thailand is treated in detail by NGI (2006), and by Nadim and Glade (2006). They reported that the 2004 Indian Ocean tsunami caused very few casualties (none recorded in the available databases) in the coastal areas of Thailand where the maxi-mum water level was less than 3 m, and that almost all the fatalities in Thailand occurred in areas where the maximum water level was more than 5 m above mean sea level. It is
noted that in Sri Lanka many casualties occurred at water levels less than 3 m. The latter illustrates the importance of settlement patterns for the risk assessment. The numerical tsunami simulations above show that the maximum surface elevation along the western coast of Thailand for the mag-nitude 8.5 scenario is 1.5–2 m, and possibly 2.5–3.0 m if the tsunami occurs at high tide (the probability of the simultane-ous occurrence of two independent extreme events, a design tsunami and an extreme high tide or a storm, is so low that it contributes very little to the total risk). Hence, very few casualties in Thailand should be expected from a magnitude 8.5 scenario.
NGI (2006) as well as Nadim and Glade (2006) con-cluded that the largest credible earthquake that could cause a tsunami towards western Thailand within the next 50 to 100 years is a magnitude 8.5 earthquake, and the potential risk from tsunamis to human life and property in Thailand can be regarded as tolerable within this time frame. They reached this conclusion through an iterative process combin-ing; (i) return periods and uncertainty in cyclicity of major tsunami-triggering events; (ii) the results of the numerical tsunami simulations; (iii) settlements and damage patterns; (iv) probabilistic evaluations; and (v) comparisons with suit-able societal risk acceptance criteria. It is, however, noted that the tsunami risk will gradually increase from tolerable to highly unacceptable with time, because the seismic hazard increases.
One cannot influence the earthquake and tsunami hazard, but one can mitigate their consequences. To this end, sev-eral mitigation measures are proposed by NGI (2006, exec-utive summary). The most important of these measures are: (i) new requirements to land-use planning and new building codes to reduce exposure to and/or consequences of future tsunamis; (ii) escape routes that lead to areas or places safe from the tsunami; (iii) artificial walls or dikes to limit the im-pact and inundation level of tsunamis; (iv) raising the ground level (vertical land reclamation) where buildings are to be constructed in the future; (v) ensuring that future buildings will not be damaged and that sleeping areas are at a level that is safe from tsunamis; and (vi) ensuring public awareness for many generations.
7 Concluding remarks
The 2004 Sumatra-Andaman earthquake rupture initiated west of the northern tip of Sumatra, near the Simeulue Is-land. Within ten minutes, the earthquake slip propagated about 1200 km northwards from the epicentre, generating the most destructive tsunami in recorded history.
Reconstructing the complex earthquake slip distribution using available seismic and geodetic information, and sim-ulating the following 2004 Indian Ocean tsunami, has been attempted by numerous authors. In the present paper, the method for describing the slip of the Sumatra-Andaman
earthquake involves several simplifications (e.g. uniform slip in the dip direction), as the method is applicable also to fu-ture scenarios. Yet, the earthquake source largely complies with the available seismic and geodetic information in liter-ature. In addition, both the sea level records and the run-up height distribution agree well with the results of the tsunami simulation, which indicates that the slip distribution of the Sumatra-Andaman earthquake is satisfactorily incorporated in the model. Nevertheless, discrepancies due to the syn-thetic source, grid effects, and local effects are present.
The Sunda arc is an active fault zone with frequent quakes that will generate tsunamis again. Our study of earth-quake statistics and plate tectonics concludes that it will take at least 300 to 400 years before an event of similar magni-tude and destructions as the Sumatra-Andaman earthquake will occur again north of the tectonic barrier near Simelulue, as much of the energy that was accumulated along the north-ern part of the Sunda arc subduction zone is now released. For earthquake scenarios of magnitude 8.5, and with the po-tential for generating tsunamis impacting western Thailand, the lower bound return period is found to be 200 years, how-ever, the cyclicity is less predictable.
The 2004 Indian Ocean tsunami shows the possibly dev-astating effects of tsunamis generated by megathrust earth-quakes. The largest credible earthquake that can cause tsunamis towards western Thailand within the next 50–100 years is a magnitude 8.5 earthquake (NGI, 2006; Nadim and Glade, 2006). Limiting our investigation of tsunami haz-ard to western Thailand, we show that future earthquakes of magnitudes less than or equal to 8.5 are not likely to generate waves with maximum surface elevations larger than 3 m on high tide. Because the 2004 Indian Ocean tsunami caused very few casualties in Thailand where the maximum water level was less than 3 m, few casualties should also be ex-pected in Thailand from a magnitude 8.5 scenario.
NGI (2006) as well as Nadim and Glade (2006) concluded that the potential risk from tsunamis to human life and prop-erty in Thailand can be regarded as tolerable within the next 50 to 100 years, but that the tsunami risk will gradually in-crease with time.
Acknowledgements. The paper is based on a project to assist the
authorities in Thailand with evaluating the future tsunami risk. This project was financed by the Royal Norwegian Ministry of Foreign Affairs, and conducted in cooperation with the Department of Mineral Resources in Thailand (DMR) and the Coordinating Committee for Geoscience Programs in East and South East Asia (CCOP). This work was supported by the Research Council of Norway (RCN) under grant 154831, and by the International Centre for Geohazards partly financed by RCN, NGI, and NORSAR. We would like to thank K. Karlsrud and F. Nadim for helpful comments on this paper. We also would like to thank project leader K. Karlsrud and co-workers B. V. Vangelsteen, F. Nadim, P. Gauer, K. Atakan, M. B. Sørensen, B. Heyerdahl, A. Tennøy, L. McNeill, T. Henstock, A. Tørum, Ø. Arntsen, and S. Bjørdal for helpful assistance throughout the project preceding this paper. The authors
are indebted to B. Gjevik and P. Heinrich for assistance regarding the coupling between seismology and tsunami generation. Finally, we thank F. Schindele and two anonymous referees for constructive reviews of this paper. The present article is contribution No. 130 from the International Centre for Geohazards, Oslo, Norway. Edited by: E. Pelinovsky
Reviewed by: F. Schindele and two other referees
References
Aki, K. and Richards, P. G.: Quantitative seismology, Freeman, San Francisco, California, 1980.
Ammon, C. J., Ji, C., Thio, H.-K., Robinson, D., Ni, S., Hjortleifs-dottir, V., Kanamori, H., Lay, T., Das, S., Helmberger, D., Ichi-nose, G., Polet, J., and Wald, D.: Rupture process of the 2004 Sumatra-Andaman earthquake, Science, 308, 1127–1133, 2005. Banerjee, P., Pollitz, F. F., and B¨urgmann, R.: The size and dura-tion of the Sumatra-Andaman Earthquake from Far-Field Static Offsets, Science, 308, 1769–1772, 2005.
Bilek, S. L. and Lay, T.: Rigidity variations with depth along inter-plate megathrust faults in subduction zones, Nature, 400, 443– 446, 1999.
Bilham, R.: A flying start, then a slow stop, Science, 308, 1126, 2005.
Bilham, R., Engdahl, R., Fedl, N., and Satyabala, S. P.: Partial and complete rupture of the Indo-Andaman plate boundary 1847– 2004, Seis. Res. Lett., 76(3), 299–311, 2005.
Bondevik, S., Løvholt, F., Harbitz, C. B., Mangerud, J., Dawson, A., and Svendsen, J. I.: The Storegga slide tsunami – comparing field observations with numerical simulations, Mar. Petroleum Geology, 22, 195–208, 2005.
Borrero, J. C., Synolakis, C. E., and Fritz, H.: Northern Sumatra Field Survey after the December 2004 Great Sumatra Earthquake and Indian Ocean Tsunami, Earthquake Spectra, 22(3), 93–104, 2006.
Choi, B. H., Pelinovsky, E., Kim, K. O., and Lee, J. S.: Simula-tion of the trans-oceanic tsunami propagaSimula-tion due to the 1883 Krakatau volcanic eruption, Nat. Hazards Earth Syst. Sci., 3, 321–332, 2003,
http://www.nat-hazards-earth-syst-sci.net/3/321/2003/.
Cisternas, M., Atwater, B. F, Torrejon, F., Sawai, Y., Machuca, G., Lagos, M., Eipert, A., Youlton, C., Salgado, I., Kamataki, T., Shishikura, M., Rajendran, C. P., Malik, J. K., Rizal, Y., and Husni, M.: Predecessors of the giant 1960 Chile earthquake, Na-ture, 437, 404–407, 2005.
Clague, J. J.: Evidence for large earthquakes at the Cascadia sub-duction zone, Rev. Geophys., 35, 439–460, 1997.
Chlieh, M., Avouac, J.-P., Hjorleifsdottir, V., Song, T.-R. A., Ji, C., Sieh, K., Sladen, A., Hebert, H., Prawirodirdjo, L., Bock, Y., and Galetzka, J.: Coseismic Slip and Afterslip of the Great Mw 9.15 Sumatra-Andaman Earthquake of 2004, Bull. Seismol. Soc. Am., 97-A, in press, 2006.
Collection of videos of the 26th December Indian Ocean tsunami: http://www.asiantsunamivideos.com, 2005.
DeShon, H. R., Engdahl, E. R., Thurber, C. H., and Brudzinski, M.: Constraining the boundary between the Sunda and Andaman subduction systems: Evidence from the 2002 Mw 7.3 North-ern Sumatra earthquake and aftershock relocations of the 2004
and 2005 great earthquakes, Geophys. Res. Lett., 32, L24307, doi:10.1029/2005GL024188, 2005.
Engdahl, E. R., van der Hilst, R. D., and Buland, R. P.: Global teleseismic earthquake relocation with improved travel times and procedures for depth determination, Bull. Seism. Soc. Am., 88, 722–743, 1998.
Engdahl, E. R. and Villase˜nor, A.: Global Seismicity: 1900–1999, in: International Handbook of Earthquake and Engineering Seis-mology, edited by: Lee, W. H. K., Kanamori, H., Jennings, P. C., and Kisslinger, C., Part A, Chapter 41, pp. 665–690, Academic Press, 2002.
GEBCO: The General Bathymetric Chart of the Oceans, http:// www.ngdc.noaa.gov/mgg/gebco/gebco.html, 2006.
Geological Survey of India: A report on the Sumatra-Andaman earthquake and tsunami of 26 December 2004, Institute report, 2005.
Gill, A. E.: Atmosphere-Ocean Dynamics, International Geo-physics Series, 30, Academic Press Inc., ISBN: 0-12-451450-2, 1982.
Glimsdal, S., Pedersen, G. K., Atakan. K., Harbitz, C. B., Lang-tangen, H. P., and Løvholt, F.: Propagation of the Dec. 26 2004 Indian Ocean Tsunami: effects of dispersion and source charac-teristics, Int. J. Fluid Mech. Res., 33(1), 14– 33, 2006.
Glimsdal, S., Pedersen, G. K., Dypvik, H., Langtangen, H. P., and Shuvalov, V.: Tsunami generation and propagation from the Mjølnir asteroid impact, Meteorit. Planet. Sci., in press, 2006. Harbitz, C. and Pedersen, G.: Model Theory and Large Water
Waves, Due to Landslides, Preprint Series, vol. 4, Department of Mathematics, University of Oslo, 1992.
Intergovernmental Oceanographic Commission of UNESCO: Tsunami glossary, available at: http://ioc3.unesco.org/itic/, 2006. Ishii, M., Shearer, P. M., Houston, H., and Vidale, J. E.: Extent, duration and speed of the 2004 Sumatra-Andaman earthquake imaged by the Hi-Net array, Nature, 435, 933–936, 2005. Iwan, W. D.: Preface to the Special Issue on the Great Sumatra
Earthquakes and Indian Ocean Tsunamis of 26 December 2004 and 28 March 2005, Earthquake Spectra, 22(3), xi–xii, 2006. Jaffe, B. E., Borrero, J. C., Prasetya, G. S., Peters, R., McAdoo,
B., Gelfenbaum, G., Morton, R., Ruggiero, P., Higman, B., Dengler, L., Hidayat, R., Kingsley, E., Kongko, W., Lukijanto, Moore, A., Titov, V., and Yuliantom, E.: Northwest Sumatra and Offshore Islands Field Survey after the December 2004 Indian Ocean Tsunami, Earthquake Spectra, 22(3), 105–135, 2006. Japanese survey team: The 2004 Indian Ocean Tsunami Disaster
Survey Report, Web page http://www.tsunami.civil.tohoku.ac.jp/ sumatra2004/report.html, 2006a.
Japanese survey team: Compilation of web links, http://www.drs. dpri.kyoto-u.ac.jp/sumatra/index-e.html, 2006b.
Kajiura, K.: Tsunami energy in relation to parameters of the earth-quake fault model, Bull. Earthearth-quake Res. Institute, 56, 415–440, 1981.
Kanamori, H.: Seismological Aspects of the December 2004 Great Sumatra-Andaman Earthquake, Earthquake Spectra, 22(3), 1– 12, 2006.
Karlsrud, K., Bungum, H., Harbitz, C. B., Løvholt, F., Vangelsten, B. V., and Glimsdal, S.: Strategy for re-construction in Thailand following the 26 December 2004 tsunami event, in: International Conference on Geotechnical Engineering for Disaster Mitigation & Rehabilitation, edited by: Chu, J., Phoon, K. K., and Yong, K.
Y., World Scientific Publishing Company, ISBN 981-256-469-1, 2005.
KNMI web page: Tsunami Observations by the Echo-Sounder on Yacht Mercator, Phuket, http://www.knmi.nl/VinkCMS/ newsdetail.jsp?id=19222, 2005.
Kr¨uger, F. and Ohrnberger, M.: Tracking the rupture of the Mw=9.3 Sumatra earthquake over 1,150 km at teleseismic distance, Na-ture, 435(7044), 937–939, 2005.
Lay, T., Kanamori, H., Ammon, C., Nettles, M., Ward, S. N., Aster, R. C., Beck, S. L., Bilek, S. L., Brudzinski, M. R. , Butler, R., DeShon, H. R., Ekstr¨om, G., Satake, K., Sipkin, S.: The great Sumatra-Andaman earthquake of December 26, 2004, Science, 308, 1127–1133, 2005.
Liu, P.-L. F., Lynett, P., Fernando, H., Jaffe, B. E., Fritz, H., Hig-man, B., Morton, R., Goff, J., and Synolakis, C.: Observations by the International Tsunami Survey Team in Sri Lanka, Science, 308(5728), 1595–1595, 2005.
Løvholt, F., Harbitz, C. B., and Haugen, K. B.: A parametric study of tsunamis generated by submarine slides in the Ormen Lange/Storegga area off western Norway, Mar. Petroleum Geol-ogy, 22, 219–231, 2005.
McCloskey, J., Nalbant, S. S., and Steacy, S.: Earthquake risk from co-seismic stress, Nature, 434, 291, 2005.
Merrifield, M. A., Firing, Y. L., Aarup, T., Agricole, W., Brun-drit, G., Chang-Seng, D., Farre, R., Kilonsky, B., Knight, W., Kong, L., Magori, C., Manurung, P., McCreery, C., Mitchell, W., Pillay, S., Schindele, F., Shillington, F., Testut, L., Wijer-atne, E. M. S., Caldwell, P., Jardin, J., Nakahara, S., Porter, F.-Y., and Turetsky, N.: Tide gauge observations of the Indian Ocean tsunami December 26, 2004, Geophys. Res. Lett., 32, L09603, doi:10.1029/2005GL022610, 2005.
Mei, C. C.: The applied dynamics of ocean surface waves, Adv. Series on Ocean Engineering, 1, World Scientific, London, 1989. Mesinger, F. and Arakawa, A.: Numerical methods used in
atmo-spheric models, GARP, Publ. Ser. WMO 17, 64 pp, 1976. Nadim, F. and Glade, T.: On tsunami risk assessment for the west
coast of Thailand, edited by: Nadim, F., P¨ottler, R., Einstein, H., Klapperich, H., and Kramer, S., ECI Symposium Series, 7, http://services.bepress.com/eci/geohazards/28, 2006.
Nalbant, S. S., Steacy, S., Sieh, K., Natawidjaja, D., and Mc-Closkey, J.: Earthquake risk on the Sunda trench, Nature, 425, 756–757, 2005.
Ni, S., Kanamori, H., and Helmberger, D.: Energy radiation from the Sumatra earthquake, Nature, 434, 592, 2005.
NGI (Norwegian Geotechnical Institute): Tsunami Risk Re-duction Measures with Focus on Land Use and Rehabilita-tion, available at: http://www.ngi.no/files/060215-thail-tsunami summary report-complete.pdf, NGI report no. 20051267-1, 2006.
Okada, Y.: Internal Deformations due to shear and tensile faults in half-space, Bull. Seismic Soc. of Am., 82(2), 1018–1040, 2005. Okal, E. A. and Synolakis, C. E.: Field Survey and Numerical
Sim-ulations: A Theoretical Comparison of Tsunamis from Dislo-cations and Landslides, Pure Appl. Geophys., 160, 2177–2188, 2003.
Pacific Tsunami Warning Center data base: http://www.prh.noaa. gov/ptwc/, 2005.
Papadopoulos, G. A., Caputo, R., McAdoo, B., Pavlides, S., Karas-tathis, V., Fokaefs, A., Orfanogiannaki, K., and Valkaniotis, S.:
The large tsunami of 26 December 2004: Field observations and eyewitnesses accounts from Sri Lanka, Maldives Is. and Thai-land, Earth Planets Space, 58(2), 233–241, 2006.
Park, J., Song, T.-R. A., Tromp, J., Okal, E., Stein, S., Roult, G., Clevede, E., Laske, G., Kanamori, H., Davis, P., Berger, J., Braitenberg, C., van Kamp, M., Lei, X., Sun, H., Xu, H., and Rosat, S.: Earth’s Free Oscillations Excited by the December 2004 Sumatra-Andaman Earthquake, Science, 308, 1127–1133, 2005.
Pedersen, G.: Grid effects on tsunamis in nearshore regions, Uni-versity of Oslo, Preprint Series nr. 1, ISSN: 0809-439, 1995. Pedersen, G.: A note on tsunami generation by earthquakes.
Preprint Series in Applied Mathematics 4, Dept. of Mathemat-ics, University of Oslo, Norway, 2001.
Petersen, M. D., Dewey, J., Hartzell, S., Mueller, C., Harmsen, S., Frankel, A. D., and Rukstales, K.: Probabilistic seismic haz-ard analysis for Sumatra, Indonesia and across the Southern Malaysian Peninsula, Tectonophysics, 390, 141–158, 2004. Peregrine, D. H.: Equations for water waves and the
apprtoxima-tions behind them, in: Waves on Beaches, edited by: Meyer, R. E., Academic Press, New York, 357–412, 1972.
Satake, K., Shimazaki, K., Tsuji, Y., and Ueda, K.: Time and size of a giant earthquake in Cascadia inferred from Japanese tsunami records of January 1700, Nature, 379, 246–249, 1996.
Schiermeier, Q.: The chaos to come, Nature, 438, 903–906, 2005. Scholz, C. H.: The mechanics of Earthquakes and Faulting, 2nd
Edition, Cambridge University Press, pp 471, 2002.
Singh, S. C., Sibuet, J. C., Malod, J., Rangin, C., Chauhan, A., Car-ton, H., Apprioul, R., Aryanto, N. C., Begot, J., Cattaneo, A., Creach, R., Crozon, J., Domzig, A., Falleau, N., Graindorge, D., Harmegnies, F., Haryadi, Y., Klingelhoefer, F., Krishna, S. K., Landur´e, J.-Y., Le Lann, C., Normand, A., Oggian, G., Restuning Galih, D., Schneider, J.-L., Sultan, N., Taufik, M., Umber, M., and Yamaguchi, H. (Sumatra Aftershocks Team): Sumatra earth-quake research indicates why rupture propagated northward, Eos, 86, 48, 497, 502, 2005.
Smith, W. H. S., Scharroo, R., Titov, V. V., Arcas, D., and Arbic, B. K.: Satellite Altimeters Measure Tsunami, Oceanography, 18(2), 11–13, 2005.
Stein, S. and Okal E.: Speed and size of the Sumatra earthquake, Nature, 434, 581–582, 2005.
Stone, R. and Kerr, S. A.: Girding for the next killer wave, Science, 310, 1605–1605, 2005.
Subarya, C., Chlieh, M., Prawirodirdjo, L., Avouac, J.-P., Bock, Y., Sieh, K., Meltzner, A. J., Natawidjaja, D. H., and McCaffrey, R.: Plate-boundary deformation associated with the great Sumatra-Andaman earthquake, Nature, 440, 46–51, 2006.
Synolakis, C. E. and Kong, L.: Runup Measurements of the De-cember 2004 Indian Ocean Tsunami, Earthquake Spectra, 22(3), 67–91, 2006.
Titov, V., Rabinovich, A. B., Mofjeld, H. O., Thomsom, R. E., and Gonzalez, F. I.: The global reach of the 26 December 2004 Sumatra tsunami, Science, 309, 2045–2048, 2005.
Tsujii, Y. and Satake, K.: Tsunami source of the 2004 Sumatra-Andaman earthquake inferred from tide gauge and satellite data, Bull. Seismol. Soc. Am., 97-A in press, 2006.
University of Poznan: Post-tsunami Field Survey Report, Bangkok, 20 February 2005.
C., Choosakul, N., Subarya, C., Socquet, A., Omar, K., Abidin, H. Z., and Ambrosius, B. A. C.: Insight into the 2004 Sumatra-Andaman earthquake from GPS measurements in southeast Asia, Nature, 436, 201–206, 2005.
Walker, K. T., Ishii, M., and Shearer, P. M.: Rupture details of the 28 March 2005 Sumatra Mw 8.6 earthquake imaged with teleseismic P waves, Geophys. Res. Lett., 32, L24303, doi:10.1029/2005GL024395, 2005.
Wells, D. L. and Coppersmith, K. J.: New empirical relationships among magnitude, rupture length, rupture width, rupture area, and surface displacement, Bull. Seism. Soc. Am., 84, 974–1002, 1994.
Wang, X. and Liu, P. L.-F.: An analysis of 2004 Sumatra earth-quake fault plate mechanisms and Indian Ocean tsunami, J. Hy-drol. Res., 44(2), 147–154, 2006.
Yalciner, A. C., Perincek, D., Ersoy, S., Presateya, S. G., Hidayat, R., and McAdoo, B.: December 26, 2004 Indian Ocean tsunami, Field Survey (Jan. 21–31, 2005) at north of Sumatra Island, Re-port for UNESCO IOC, 2005.
Yeh, H., Chadha, R. K., Francis, M., Katada, T., Latha, G., Peter-son, C., Raghuraman, G., and Singh, J. P.: Tsunami runup sur-vey along the southeast Indian coast, Earthquake Spectra, 22(3), 173–186, 2006.