HAL Id: hal-02330254
https://hal.archives-ouvertes.fr/hal-02330254
Submitted on 23 Oct 2019
HAL is a multi-disciplinary open access
archive for the deposit and dissemination of
sci-entific research documents, whether they are
pub-lished or not. The documents may come from
teaching and research institutions in France or
abroad, or from public or private research centers.
L’archive ouverte pluridisciplinaire HAL, est
destinée au dépôt et à la diffusion de documents
scientifiques de niveau recherche, publiés ou non,
émanant des établissements d’enseignement et de
recherche français ou étrangers, des laboratoires
publics ou privés.
A short electromagnetic profile across the Kane Oceanic
Core Complex
Rob L. Evans, Javier Escartin, Mathilde Cannat
To cite this version:
Rob L. Evans, Javier Escartin, Mathilde Cannat. A short electromagnetic profile across the Kane
Oceanic Core Complex. Geophysical Research Letters, American Geophysical Union, 2010, 37 (15),
pp.L15309. �10.1029/2010GL043813�. �hal-02330254�
A short electromagnetic profile across the Kane Oceanic
Core Complex
Rob L. Evans,
1Javier Escartín,
2and Mathilde Cannat
2Received 29 April 2010; accepted 6 May 2010; published 14 August 2010.
[1] A short seafloor electromagnetic profile across part of the
Kane Oceanic Core Complex shows a large variation in seafloor electrical properties (uppermost 30m) with a sharp transition from conductive to resistive seafloor over a distance of less than 350m. The transition is in a location consistent with a sharp, but deeper, lateral gradient in seismic velocity, inferred to mark a transition from serpentinized peridotite to either gabbro or pristine mantle rocks, and is close to a mapped outcrop of serpentinized peridotites. We relate this variability in shallow structure primarily to changes in porosity related to composition. Citation: Evans, R. L., J. Escartín, and M. Cannat (2010), A short electromagnetic pro-file across the Kane Oceanic Core Complex, Geophys. Res. Lett., 37, L15309, doi:10.1029/2010GL043813.
1.
Introduction
[2] Oceanic core complexes (OCCs), are widespread
features along the mid‐Atlantic Ridge and other slow and ultra‐slow spreading ridges [e.g., Escartín et al., 2008; Tucholke et al., 2008], where they are involved in the accretion of large areas of the seafloor [Smith et al., 2006; Cannat et al., 2006]. The low‐angle detachment faults exposed at the seafloor unroof and expose sections of lower crust and mantle, accommodating elevated strains over long periods of time, sometimes in excess of 1 Myrs, possibly promoting serpentinization within these structures.
[3] Competing models of OCC formation and evolution
have been proposed, including the creation of low angle detachment faults [e.g., Cannat et al., 1997; Escartín et al., 2003; Buck et al., 2005; Tucholke et al., 2008]. In general, OCCs are thought to form when the reduction in magma supply crosses a threshold that triggers detachment forma-tion. The footwall composition is debated, with models and evidence ranging from extensive serpentinite bodies, to mainly gabbro bodies capped by serpentinized rocks. The fault zone appears to be thin, possibly on the order of tens of meters or less [Escartín et al., 2003; Schroeder and John, 2004; Karson et al., 2006], and shows variable composi-tion and degree of alteracomposi-tion (from talc schists to deformed mafic and ultramafic rocks). Some OCC models predict extensive serpentinite bodies while others suggest that ser-pentinites are essentially restricted to the fault that uplifts the gabbro footwall [Ildefonse et al., 2007]. Thus, the extent of serpentinization, the distribution of lithologies (gabbro,
peridotite) and composition of the fault zone and footwall should provide important clues as to the mechanisms of OCC formation.
[4] Geophysical discrimination of serpentinite from
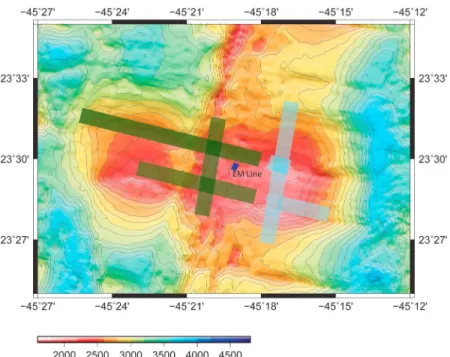
gab-bro is key to understanding the internal structure and for-mation of OCCs, but is difficult on the basis of seismic velocities alone [e.g., Horen et al., 1996]. However, a high resolution seismic refraction line across the Cain dome at the Kane OCC (Figure 1) shows a sharp increase from extremely low velocities of∼3.5 km/s to >4.2 km over a distance of a few hundred meters along‐flowline [Xu et al., 2009]. Inter-mediate velocities and velocity gradients appear related to massive outcrops of serpentinized peridotites, suggesting that the deeper lower velocities result from widespread ser-pentinization. The data do not tightly constrain the near‐ surface velocities and so whether the contact intersects the seafloor is unknown.
[5] A ∼350m long profile of electromagnetic (EM) data
has been collected across the western part of the Cain dome at the Kane OCC (Figure 1). The objective was to survey a longer profile and to discriminate, on the basis of electrical resistivity, between areas of serpentinized peridotite and gabbro. The towed EM system used consists of a frequency‐ domain magnetic dipole‐dipole array, roughly ∼40 m long, towed in contact with the seafloor at 1–2 knots that mea-sures structure to depths of around 30m below the seafloor [Evans, 2007]. The system has been used extensively in sedimented settings where it has been shown to record changes in relative porosity on the order of 1–2% quite reliably. Towing in ∼2200m of water over a feature that, although smoothed, still has the potential to have rugged local topographic features was a much greater challenge. Location of the system on the seafloor was determined by acoustically tracking slant range to a transponder mounted on the tow cable just above the instrument, and assuming that the unit was directly behind the ship. The wire tension was also used to ascertain when the system was in contact with the seafloor. The system snagged after a short period on the seafloor and the receiver string was heavily damaged, with two receivers lost. Although the receivers were lost, data are transmitted in real time and the damage was in the communication link between the main computer unit in the transmitter and the receivers. The transmitter was undam-aged. Thus the measurements collected prior to the loss of the receivers are not affected: the receivers either send data or they don’t. Despite these problems, the short profile of data collected shows a dramatic transition in resistivity structure with an increase in values from around 0.7 Ohm‐m up to 20 Ohm‐m, with one reading greater than 800 Ohm‐m (Figure 2). The lowest values are more conductive than has
1
Department of Geology and Geophysics, Woods Hole Oceanographic Institution, Woods Hole, Massachusetts, USA.
2
Equipe de Ge´osciences Marines, Institut de Physique du Globe de Paris, Paris, France.
Copyright 2010 by the American Geophysical Union. 0094‐8276/10/2010GL043813
been seen previously, except in areas of hydrothermal activity [Cairns et al., 1996].
2.
Electrical Conductivity of Oceanic Rocks
[6] The conductivity of the uppermost seafloor is largely
controlled by conductive seawater in cracks. This allows, to first order, an interpretation of bulk resistivity in terms of porosity [e.g., Becker, 1985]. Yet, there are additional compositional variations that influence conductivity, as well as differences in rock strength that might control degrees of cracking and porosity and therefore allow inference of lithology from resistivity measurements.
[7] Laboratory measurements of electrical resistivity on
serpentinite samples span 7 orders of magnitude at low temperature [e.g., Popp and Kern, 1993; Xie et al., 2002; Stesky and Brace, 1973], although measurements made on seawater saturated samples have a smaller spread (typically 3–1000 Ohm‐m) and show generally lower resistivities than those reported for serpentinite‐free peridotite, gabbro or basalt [Stesky and Brace, 1973; Cannat et al., 1995b; Gillis et al., 1993] (Figure 3). Variability between measurements on samples of serpentinized peridotite, lherzolite and a pure serpentinite, show the strongest evidence that serpentinite has the potential to be a good conductor at low temperatures [Stesky and Brace, 1973]. However, the highly conductive serpentinite sample (ss) of Stesky and Brace [1973] has a porosity of 14.5% and so most, if not all, of its conductivity can be ascribed to pore‐fluid conduction in a well‐ connected fluid network. The argument against this is a slight increase in conductivity as the sample was squeezed, suggesting a phase whose interconnection increases under pressure, the opposite of what is expected for pore‐space conduction.
[8] Physical properties of serpentinite bearing and gabbro
samples from oceanic drill holes show that while the
resis-tivities show a large overlap, they define different popula-tions when porosity is considered (Figure 3b). Hole 920D was drilled in proximity to the Kane OCC in a 2‐km‐wide belt of serpentinized peridotite along the rift valley wall [Cannat et al., 1995a]. Resistivity measurements on serpentinized rocks from this site show values from 10– 100 Ohm‐m, with the lowest values of 3–11 Ohm‐m in the uppermost serpentinized harzburgite unit [Cannat et al., 1995b]. In contrast to the serpentinite samples, a gabbroic suite from ODP leg 147 [Gillis et al., 1993], has lower Figure 1. A map showing the location of resistivity measurements (dark blue line) on the Kane OCC. Also shown are the interpreted locations of serpentinite (dark green lines) and gabbro (light blue lines) on the basis of a seismic refraction exper-iment [Xu et al., 2009].
Figure 2. EM data measured on the 40m receiver across the Kane OCC. The highly conductive values at the start of the profile are indicative of serpentinized peridotite. The more resistive values at the end most likely mark the transition to an unaltered gabbro or peridotite.
EVANS ET AL.: EM PROFILE AT KANE OCC L15309
L15309
porosities and commensurately higher resistivities. Thus, the slight difference in population conductivities between ser-pentinite and gabbro samples may simply reflect higher porosities within the serpentinites as a result of alteration or deformation. While this difference is not related to any intrinsic difference in resistivity between gabbros and vari-ably‐serpentinized periodities, it potentially allows a means of discriminating between the two rock types.
[9] Despite the obvious impact of porosity, it has been
suggested that the conductivity of serpentinized peridotites is controlled by the presence, oxidation state and
inter-connectivity of magnetite [Stesky and Brace, 1973]. Mag-netite has a resistivity of 4x10⁻⁵ Ohm‐m [Lefever, 1980], and so a small amount of interconnected magnetite can dramatically impact bulk conductivity. Magnetite is pro-duced during serpentinization to accommodate the differ-ence in iron content between olivine and its serpentine replacement [Moody, 1976]. Magnetite grain size and dis-tribution vary significantly in serpentinized peridotites, probably depending on the nature and extent of fluid‐rock interactions during and after serpentinization [Oufi and Cannat, 2002]. Magnetite connectivity is therefore not expected to be a simple function of the degree of serpenti-nization. Bulk resistivity in serpentinized samples remains high (3–150 Ohm‐m) relative to that expected for samples containing interconnected magnetite. In addition, in the highly serpentinized peridotites drilled during ODP legs 147 and 153 there is no clear correlation between magnetite content recalculated from magnetic properties [Oufi and Cannat, 2002], and resistivity measured on the same sam-ples [Gillis et al., 1993; Cannat et al., 1995b]. Thus, at the sample scale at least, magnetite does not appear to greatly impact the electrical resistivity of serpentinized peridotites. [10] Other moderately conductive rocks have been found
at ridge settings. In ODP Hole 735B on the Southwest Indian Ridge, low resistivities (∼5 Ohm‐m) were observed in a band of Fe‐Ti oxide rich gabbros [Pezard et al., 1991]. Fe‐Ti oxide gabbros may be related to localized intrusions of evolved magmas [Ozawa et al., 1991]. They represent a significant proportions of the rock types dredged on Cain Dome next to our EM survey [Dick et al., 2008]. The resistivity of these oxide gabbros, however, remains high relative to the lowest resistivities in our survey area.
3.
Discussion
[11] The short profile of data crosses a sharp transition in
conductivity structure (Figure 2). The resistivity of seawater at Kane is around 0.28 Ohm‐m, and the most conductive measurements are a factor of ∼2.5 smaller, surprisingly
Figure 3. (a) A composite plot of laboratory and in‐situ data on serpentinite and related rocks. Labeled are serpenti-nized peridotite (Ps), serpentiserpenti-nized lherzolite (Ls) and pure serpentinite (S) and gabbros (G1, G2 and Gs) [Stesky and Brace, 1973]. Sp and G are measurements on ODP and IODP samples of serpentinite and gabbro respectively [Cannat et al., 1995b; Gillis et al., 1993]. The range of seafloor resistivities measured in this experiment is outlined by the dashed gray box. Green and blue lines show the effects of mixing Ps (green) and S (blue) with seawater at porosities of 1, 5, 10 and 20% (higher porosities producing increasingly lower resistivities), assuming ideal fluid inter-connection [Hashin and Shtrikman, 1962]. The resistivities of rocks containing 0.01%, 0.05% and 0.1% ideally connected magnetite are shown on the right hand side, assuming 104S/m conductivity for magnetite [Lefever, 1980] and a conductivity of 10−7S/m for the serpentinite [Popp and Kern, 1993]. Histograms of ODP and IODP samples of (b) gabbro [Gillis et al., 1993] and (c) serpentinite [Cannat et al., 1995b] showing the generally lower porosity and higher resistivities of the gabbro samples.
conductive. Converting the apparent resistivities to apparent porosities using Archie’s Law [Evans, 2007], assuming an ideally connected pore fluid, yields values of around 46% in the least resistive area and close to zero at the contact. Typical seafloor porosities in volcanic or hard‐rock settings are <20%, with the upper values reported for basalt breccia [Evans et al., 1991], although there are no data from true brecciated rubble. It seems likely either that other conduc-tion mechanisms influence the response where the resistiv-ities are low, or the assumptions inherent in Archie’s law do not hold in this setting (Hashin‐Shtrikman bounds also predict large porosities (Figure 3a)). These data appear to validate speculation that the uppermost seafloor shows large variability in resistivity at the geophysical scale (lengths greater than a few meters) [Evans et al., 1991].
[12] The high conductivities seen are higher than
labora-tory data on serpentinites. There is little evidence from the laboratory that magnetite boosts conductivity to the levels seen. This is despite the fact that only ∼0.05% volume fraction of well connected magnetite is needed to achieve the measured conductivities (Figure 2). Samples examined to date must either not have a well connected magnetite network, or else some other process is inhibiting magnetite conduction. Perhaps very well connected magnetite dis-tributions are rare or non‐existent in serpentinite, or only form in cracks and veins that have yet to be sampled through drilling. In any case, an evaluation of our results purely in terms of serpentinite is difficult without laboratory data or in‐situ logging data that show similar magnitudes. If the conductivities are to be explained by porosity, then the values seem unreasonably high (∼46%) for volcanic seafloor.
[13] However, seismic velocities at Kane [Xu et al., 2009]
are also too low to be explained solely by 100% serpentinite, which has a compressional velocity of∼5 km/s [Christensen, 1996], inferring a combination of high degree of serpenti-nization and high fracture porosity. We propose that high porosities may be typical in areas of exposed serpentinized peridotites, with variations in the degree of faulting and fracturing along the profile responsible for the gradient in resistivity.
[14] Iron‐rich gabbros could also be present, although
observed resistivities at both ODP hole 735B [Pezard et al., 1991] and IODP hole U1309D (troctolites) [Ildefonse et al., 2009] are in excess of 5 Ohm‐m, higher than the low resistivites observed in our Kane data. Host‐rocks that are more resistive than our observed values do not assist in explaining high conductivities as the bulk conductivity is primarily influenced by the amount and distribution of the most conductive phase. However, the possibility of con-ductive gabbros certainly opens the door for other inter-pretations of lithologic variations across Kane.
[15] Clearly, more laboratory data characterizing the
conductivity of serpentinite are needed. As these measure-ments are made it will be important to characterize the volume fraction and connectedness of the magnetite distri-bution within the sample using high resolution imaging methods. Laboratory data are puzzling in terms of the relationship between porosity and conductivity: there is no obvious first order trend that would be expected for an Archie’s law type behavior for example. High resolution imaging would serve both to characterize the open pore space as well as the magnetite distribution. It remains to be seen whether magnetite is able to enhance bulk seafloor
conductivities in serpentinized peridotite, or whether there are correlations between magnetite distributions and the tectonic setting of the serpentinization.
[16] Towing a system in contact with the seafloor across a
core complex is not a viable approach. Providing near sur-face physical properties measurements requires a transmis-sion of electric/magnetic fields and their measurement over short distances and at high frequencies. Systems that are flown off‐bottom are possible, but will be equally hard to implement and run. Yet measurements of the uppermost conductivity variability obviously offers great potential for adding to our understanding of areas of young oceanic crust where fluids circulate, especially when combined with seismic velocity information at a similar spatial scale.
[17] Acknowledgments. We would like to thank the crew of the R/V Endeavor for their assistance during the survey. Matthew Gould, John Bailey and Alan Gardner are thanked for technical assistance. The survey was supported by NSF grant OCE‐0823820. RLE was also received sup-port from IPGP to work in Paris with JE and MC. Benoit Ildefonse and Donna Blackman are thanked for reviews of an earlier version of this man-uscript. IPGP contribution 2657.
References
Becker, K. (1985), Large scale electrical resistivity and bulk porosity of the oceanic crust: Hole 504B, Costa Rica Rift, Initial Rep. Deep Sea Drill. Proj., 83, 419–427, doi:10.2973/dsdp.proc.83.124.1985.
Buck, W. R., L. L. Lavier, and A. N. B. Poliakov (2005), Modes of faulting at mid‐ocean ridges, Nature, 434, 719–723, doi:10.1038/nature03358. Cairns, G., R. L. Evans, and R. N. Edwards (1996), A time domain
electro-magnetic survey of the TAG hydrothermal mound, Geophys. Res. Lett., 23, 3455–3458, doi:10.1029/96GL03233.
Cannat, M., et al. (1995a), Thin crust, ultramafic exposures, and rugged faulting patterns at the Mid‐Atlantic Ridge (22°–24°N), Geology, 23, 49–52, doi:10.1130/0091-7613(1995)023<0049:TCUEAR>2.3.CO;2. Cannat, M., et al. (1995b), Proceedings of the Ocean Drilling Program,
Initial Reports, vol. 153, doi:10.2973/odp.proc.ir.153.1995, U.S. Gov. Print. Off., Washington, D. C.
Cannat, M., Y. Lagabrielle, H. Bougault, J. Casey, N. de Coutures, L. Dmitriev, and Y. Fouquet (1997), Ultramafic and gabbroic exposures at the Mid‐Atlantic Ridge: Geological mapping in the 15°N region, Tectonophysics, 279, 193–213, doi:10.1016/S0040-1951(97)00113-3. Cannat, M., D. Sauter, V. Mendel, E. Ruellan, K. Okino, J. Escartin,
V. Combier, and M. Baaia (2006), Modes of seafloor generation at a melt‐poor ultraslow‐spreading ridge, Geology, 34, 605–608, doi:10.1130/G22486.1.
Christensen, N. I. (1996), Poisson’s ratio and crustal seismology, J. Geo-phys. Res., 101, 3139–3156, doi:10.1029/95JB03446.
Dick, H. J. B., M. A. Tivey, and B. E. Tucholke (2008), Plutonic founda-tion of a slow spreading ridge segment: The oceanic core complex at Kane Megamullion, 23°30′N, 45°20′W, Geochem. Geophys. Geosyst., 9, Q05014, doi:10.1029/2007GC001645.
Escartín, J., C. Mevel, C. MacLeod, and A. M. McCaig (2003), Constraints on deformation conditions and the origin of oceanic detachments: The Mid‐Atlantic Ridge core complex at 15°45′N, Geochem. Geophys. Geosyst., 4(8), 1067, doi:10.1029/2002GC000472.
Escartín, J., D. K. Smith, J. Cann, H. Schouten, C. H. Langmuir, and S. Escrig (2008), Central role of detachment faults in accretion of slow‐ spreading oceanic lithosphere, Nature, 455, 790–794, doi:10.1038/ nature07333.
Evans, R. L. (2007), Using controlled source electromagnetic techniques to map the shallow section of seafloor: From the coastline to the edges of the continental slope, Geophysics, 72, WA105, doi:10.1190/1.2434798. Evans, R. L., S. C. Constable, M. C. Sinha, C. S. Cox, and M. J. Unsworth (1991), Upper‐crustal resistivity structure of the East Pacific Rise near 13°N, Geophys. Res. Lett., 18, 1917–1920, doi:10.1029/91GL02305. Gillis, K., et al. (1993), Proceedings of the Ocean Drilling Program, Initial
Reports, vol. 147, doi:10.2973/odp.proc.ir.147.1993, U.S. Gov. Print. Off., Washington, D. C.
Hashin, Z., and S. Shtrikman (1962), A variational approach to the theory of the effective magnetic permeability of multiphase materials, J. Appl. Phys., 33, 3125–3131, doi:10.1063/1.1728579.
Horen, H., M. Zamora, and G. Dubuisson (1996), Seismic wave velocities and anisotropy in serpentinized peridotites from Xigaze ophiolite:
EVANS ET AL.: EM PROFILE AT KANE OCC L15309
L15309
Abundance of serpentine in slow spreading ridges, Geophys. Res. Lett., 23, 9–12, doi:10.1029/95GL03594.
Ildefonse, B., D. K. Blackman, B. E. John, Y. Ohara, D. J. Miller, C. J. MacLeod, and IOES Party (2007), Oceanic core complexes and crustal accretion at slow spreading ridges, Geology, 35, 623–626, doi:10.1130/ G23531A.1.
Ildefonse, B., M. Drouin, M. Violay, and P. Pezard (2009), Data report: Electrical properties of gabbroic and troctolitic rocks from IODP Hole U1309D, Atlantis Massif, Proc. Inetgr. Ocean Drill. Program, 304/ 305, doi:10.2204/iodp.proc.304305.204.2009.
Karson, J. A., G. L. Frueh‐Green, D. S. Kelley, E. A. Williams, D. R. Yoerger, and M. Jakuba (2006), Detachment shear zone of the Atlantis Massif core complex, Mid‐Atlantic Ridge, 30°N, Geochem. Geophys. Geosyst., 7, Q06016, doi:10.1029/2005GC001109.
Lefever, R. A. (1980), Fe2+‐Fe3+spinels and Fe2+‐Fe3+spinels with
substi-tutions, in Landolt‐Bornstein, Magnetic and Other Properties of Oxides and Related Compounds, vol. 12, part B, edited by K.‐H. Hellwege, pp. 55–87, Springer, Berlin.
Moody, J. (1976), An experimental study on the serpentinization of iron‐ bearing olivines, Can. Mineral., 14, 462–478.
Oufi, O., and M. Cannat (2002), Magnetic properties of variably serpenti-nized abyssal peridotites, J. Geophys. Res., 107(B5), 2095, doi:10.1029/ 2001JB000549.
Ozawa, K., P. S. Meyer, and S. H. Bloomer (1991), Mineralogy and tex-tures of iron‐titanium oxide gabbros and associated olivine gabbros from Hole 735B, Proc. Ocean Drill. Program, Sci. Results, 118, 41–73, doi:10.2973/odp.proc.sr.118.125.1991.
Pezard, P. A., J. J. Howard, and D. Goldberg (1991), Electrical conduction in oceanic gabbros, Hole 735B, Southwest Indian Ridge, Proc. Ocean Drill. Program Sci. Results, 118, 323–331, doi:10.2973/odp.proc.sr. 118.161.1991.
Popp, T., and H. Kern (1993), Thermal dehydration reactions characterized by combined measurements of electrical conductivity and elastic wave velocities, Earth Planet. Sci. Lett., 120, 43–57, doi:10.1016/0012-821X(93)90022-2.
Schroeder, T., and B. E. John (2004), Strain localization on an oceanic detachment fault system, Atlantis Massif, 30°N, Mid‐Atlantic Ridge, Geochem. Geophys. Geosyst., 5, Q11007, doi:10.1029/2004GC000728. Smith, D. K., J. R. Cann, and J. Escartín (2006), Widespread active detach-ment faulting and core complex formation near 13°N on the Mid‐Atlantic Ridge, Nature, 442, 440–443, doi:10.1038/nature04950.
Stesky, R. M., and W. F. Brace (1973), Electrical conductivity of serpenti-nized rocks to 6 kilobars, J. Geophys. Res., 78, 7614–7621, doi:10.1029/ JB078i032p07614.
Tucholke, B. E., M. D. Behn, W. R. Buck, and J. Lin (2008), Role of melt supply in oceanic detachment faulting and formation of megamullions, Geology, 36, 455–458, doi:10.1130/G24639A.1.
Xie, H.‐S., W.‐G. Zhou, M.‐X. Zhu, Y.‐G. Liu, Z.‐D. Zhao, and J. Guo (2002), Elastic and electrical properties of serpentinite dehydration at high temperature and pressure, J. Phys. Condens. Matter, 14, 11,359–11,363, doi:10.1088/0953-8984/14/44/482.
Xu, M., J. P. Canales, B. E. Tucholke, and D. DuBois (2009), Heteroge-neous seismic velocity structure of the upper lithosphere at Kane oceanic core complex, Mid‐Atlantic Ridge, 23°17′–23°37′N, Geochem. Geo-phys. Geosyst., 10, Q10001, doi:10.1029/2009GC002586.
M. Cannat and J. Escartín, Equipe de Géosciences Marines, Institut de Physique du Globe de Paris, Case 89, 4 place Jussieu, F‐75252 Paris CEDEX 05, France.
R. L. Evans, Department of Geology and Geophysics, Woods Hole Oceanographic Institution, Clark South 172, Woods Hole, MA 02542, USA. ([email protected])