HAL Id: halshs-00574972
https://halshs.archives-ouvertes.fr/halshs-00574972
Preprint submitted on 9 Mar 2011HAL is a multi-disciplinary open access archive for the deposit and dissemination of sci-entific research documents, whether they are pub-lished or not. The documents may come from teaching and research institutions in France or abroad, or from public or private research centers.
L’archive ouverte pluridisciplinaire HAL, est destinée au dépôt et à la diffusion de documents scientifiques de niveau recherche, publiés ou non, émanant des établissements d’enseignement et de recherche français ou étrangers, des laboratoires publics ou privés.
Immigration and the export decision to the home
country
Pamina Koenig
To cite this version:
WORKING PAPER N° 2009 - 31
Immigration and the export decision to the home country
Pamina Koenig
JEL Codes: F1, R12, L25
Keywords: export decision, networks, export market,
immigration
P
ARIS-
JOURDANS
CIENCESE
CONOMIQUESL
ABORATOIRE D’E
CONOMIEA
PPLIQUÉE-
INRA48,BD JOURDAN –E.N.S.–75014PARIS TÉL. :33(0)143136300 – FAX :33(0)143136310
Immigration and the Export Decision to the Home Country
Pamina Koenig ∗
Abstract
This paper analyzes the effect of immigrants’ networks on the decision of individual firms to starting exporting to the immigrants’ home country. Existing evidence on the trade-creating effect of immigrants show a robust effect, however at the national or regional level. Using French exports at the firm-level to 61 countries, I find that increasing the number of foreign immigrants in the region by 10 % increases the probability that a firm starts exporting to the immigrants’ home country by 1.2%. MOre, the effect of immigrants is enhanced when immigrants are older or more educated. The effect of immigrants also varies among origin countries.
J.E.L. classification: F1, R12, L25
Keywords: export decision, networks, export market, immigration.
1
Introduction
In parallel to the complaints of the French government about the poor export performance of French firms in terms of volumes and in terms of markets, recently published studies by the French administration point to key factors underlying the dynamism of a subset of firms. In particular, one key factor emphasized by a study of the Parisian commercial court is the presence, in the same region, of a large number of firms headed by foreign immigrants. “In Paris, there has been between 2000 and 2004 a 56% increase in the number firms created or managed by Chinese immigrants, while the number of firms managed by French citizens has decreased by 2.99%. 41% of the firms headed by Chinese entrepreneurs are involved in importing and exporting”, reports the study.
Immigrants can impact local export performance by transferring information to local en-trepreneurs about the preferences of the consumers in their home country. From an economic policy perspective, it is therefore important to learn and emphasize the mechanism through
∗University Paris West and Paris School of Economics, France. Email: pkoenig@u-paris10.fr. I thank Andrew Clark, Megan MacGarvie, and participants of the PSE seminar for helpful comments and suggestions.
which these networks based on the country-specific knowledge of immigrants can enhance ex-port flows. Assessing whether immigrants generate higher trade, and identifying the mechanisms of the diffusion of information can participate in the development of industrial policies as the ones recently launched by the French ministry of finance on competitiveness clusters1. From an
academic point of view, assessing the importance of immigrants networks as a channel to reduce information costs allows to complete the knowledge on the structure of trade costs. Indeed, trade costs can be described as comprising three types of costs (Head, 2004): freight costs associated to moving goods across distances, trade policy costs linked to the crossing of national borders, and transaction costs related to the buying/seling process and the gathering of information. The components of the latter category have been investigated by a number of empirical studies using the traditional gravity equation applied to international trade. As a consequence, spatial proximity between exporters and importers is now known to reduce not only freight costs but also information costs. More specifically, a recent strand of the literature surveyed by Rauch (2001) and Wagner, Head and Ries (2002) emphasizes the role of social and ethnic networks in reducing transaction costs linked to the research of information.
In this paper, using firm-level data on French exports to 61 foreign markets, I build on this recent literature and investigate whether the presence of foreign immigrants in a given region encourages local firms to start exporting to the immigrants’ home country. The existing literature provides strong support for the hypothesis of immigrants networks effects on trade. Following the survey by Wagner et al. (2002) and adding some recent studies, we can summarize the main findings of the literature in two points. First, the existing studies have found a robust link between the presence of immigrants in a region and trade. Gould (1994) is among the first to use a gravity-type equation and incorporate the stock of migrants as an explanatory variable. His specification allows for a non-constant elasticity of trade with respect to the stock of immigrants. His results, on U.S. trade with 47 trading partners, show a positive link between both variables, with a decreasing elasticity with the number of immigrants. Head and Ries (1998), based on an augmented gravity equation, study Canadian trade with 136 partners from 1980 to 1992. They find a positive relationship between immigration and Canadian bilateral trade. Dunlevy and Hutchinson (1999) focus on American imports in the late nineteenth and early twentieth centuries, and find that the stock of migrants residing in the U.S. played an important role in determining aggregate imports, with some variation across periods of time and countries. Girma and Yu (2002) build on the precedent analysis by investigating immigrants effects on trade using
U.K. data. Again, the effect is found to be positive and very robust. Rauch and Trindade (2002) analyse the link between the presence of Chinese residents and world bilateral trade. They find that country pairs with higher concentrations of Chinese residents trade more with each other. Combes, Lafourcade and Mayer (2004) are the first to explore the existence of migrants networks at the regional level inside a country. They study intranational trade between French
d´epartements and show, using different specifications closely derived from theory, that the stock
of migrants coming from other d´epartements, as well as business networks, influence bilateral trade at the d´epartement level. Wagner, Head, and Ries (2002) analyse the variation in trade and immigration across Canadian Provinces and find a positive impact of foreign immigrants on trade, with different estimation procedures. Evidence from Germany is provided by Godart and Toubal (2005), on exports from German States to 58 partners countries from 1992 to 2001. Note that instead of using the stock of immigrants, they use the share of immigrants in the State population as an explanatory variable. Finally, Herander and Saavedra (2005) explore the structure of immigrants networks by studying how U.S. States’ immigrants populations affect other States’ export volumes. They first confirm the role of immigrants as increasing trade flows and then find that US state populations of immigrants have a greater influence on state exports than do out-of-state immigrants.
The second robust result present in the literature concerns the determinants of the immi-grants effects on trade. Indeed the influence of immiimmi-grants on trade flows can be expected to vary according to immigrants’ characteristics (age, education level, professional status...), to the characteristics of the traded goods (homogenous versus differentiated goods), or to the characteristics of destination countries (countries with low/strong ties to the host country). For example, Canadian immigration categorizes immigrants into three classes: family, refugee and independent, with the latter category corresponding to skilled immigrants, selected according to education and business occupation. Head and Ries (1998) find that the effect on trade varies with the class of immigrants, with independent having the largest impact. Evidence on country-varying effects of immigrants is provided by two studies. Head and Ries (1998) further show, without however expecting any specific geographical feature of the immigrants effect, that East Asian immigrants have more impact on Canadian trade than immigrants from other regions of the world. Immigrants from European Eastern Countries are the only ones to exhibit a nega-tive effect on trade flows. Girma and Yu distinguish between immigrants from Commonwealth and non-Commonwealth countries, and find that the latter have the strongest impact on trade. They interpret the result as immigrants from former U.K. colonies not bringing any valuable
information to reduce an already low transaction cost. Godart and Toubal (2005) use both the country-specific immigrants variable and a general variable representing foreign population and investigate the nature of immigrants networks. It appears that only immigrants from the same country of export have an impact on trade flows. Herander and Saavedra (2005) propose the same experiment on US States export flows, with a qualitatively similar result.
The literature thus provides strong evidence of a positive impact of immigrants on trade, and suggests some stylized facts as well as robust results concerning the nature of the immigrants networks. While all the existing studies examine these effects at the aggregate and industry level, in this paper I propose to analyse their relevance at the firm-level. Indeed, if immigrants networks effects are to impact aggregate trade flows, it must be that individual firms are influ-enced in their export behavior by the presence of immigrants. At the firm-level, two elements are likely to be impacted: The decision to export to a given country, hence the number of ex-porting firms, and the volume exported by each firm. In this paper I study whether immigrants impact the decision to export, more precisely the decision to start exporting to a given country, and leave the analysis of individual export volumes for further work. Studying the decision to start exporting is interesting in two aspects. First, it allows to focus on a very intuitive channel through which immigrants can affect trade, which is by encouraging new firms to export to their home country. Second, it complements our knowledge on the mechanisms through which immigrants affect aggregate trade, and opens a path towards understanding whether the role of immigrants affect primarily the intensive or the extensive margins of trade.
Based on a trade model in monopolistic competition, in section 2 I explain how I model the export behavior of the firm and how immigrants networks impact the export decision. Section 3 details the sources of data and highlights some stylized facts concerning the distribution of immigrants across French departements. Then in section 4 I estimate the impact of immigrants on a firm export behavior, using a logit model. Results are displayed and I explain how I control for other variables that could also affect both the presence of immigrants and the export decision. In section 5, I investigate how the effect of immigrants on firm-level trade varies with immigrants’ characteristics such as age and education. Then I study how the effect changes according to industry. Indeed, immigrants are likely to have more impact on trade in the case of differentiated goods than for homogenous products, because immigrants are expected to reduce information costs for the goods where information is necessary and most valuable. Finally, I show how immigrants impact trade differently according to the importing country.
2
The empirical model
In the following I describe the theoretical framework from which I derive the expressions for the export decision of the firm. I model the firm’s behavior using a model of trade in monopolistic competition in which firms are heterogeneous. In this setting, operating firms face two different fixed costs. The first is the fixed production cost, faced by all firms that sell at least domestically. The second one is the fixed cost at exporting, f , which the firms have to pay the first year they sell on foreign markets. In a given sector, firms differ by their marginal cost ai, where ai is the number of units of labor necessary to produce one unit of the good. Hence the lower the marginal cost, the more productive the firm, and the more the firm is able to sell on a given market. This also explains that not all firms sell on each market, since a lot of them are not able to make sufficient profits to pass the productivity threshold.
In the following I will develop the expression for the profit of the firm abroad, describe how the firm chooses to sell on foreign markets and model the probability to export. Before that, let us make two remarks relative to the link between the theory and the empirical work.
The first point refers to the empirical handling of the fixed cost at exporting. Indeed, let us consider a firm i facing the decision of exporting or not to a country j. By exporting to that country, the firm is able to make an annual profit equal to Πij. However, if the firm has never exported to that country before, it must incur a sunk cost f to cover the cost of entering the market. For each year and country, there will thus be firms that continue and firms that start to export to that country, corresponding to firms that have already paid the sunk cost and those that have not. This asymmetry between the continuers and the starters becomes a problem for the estimation precisely because this sunk cost is not observed: we have no information on which firms have paid the sunk cost and which ones have not. Therefore, we must find a variable to distinguish the continuers from the starters, because this asymmetry is in itself a potential reason for which to remain on the export market in year t. If not controlled for, it could bias the estimates of the firm level variables coefficients. Following Roberts and Tybout (1997), most of the empirical literature on the export decision uses the lagged export status as a proxy for those firms. However, as noted by Robert and Tybout (1997) and Bernard and Jensen (2004), the use of this variable creates substantial econometric difficulties because the identification of the spillovers also requires the specification to control for unobserved firm heterogeneity.
The approach chosen in this paper is to consider only the firms that start to export to a given market. Doing so handles the asymmetry between the firms, because none of the firms in the remaining sample have paid the sunk cost. Hence, all the firms have the same lagged
export status, and this element will not be part of the possible determinants of the probability to export. Of course, the consequence of considering the decision to start exporting is that we are left with the sunk cost in the profit function of each firm, and thus in the explanatory variables of the estimated equation. In the next paragraph, I will propose a way to model the sunk cost that is coherent with the phenomenon I am willing to identify.
The second point to clarify concerns the modeling of the channel through which immigrants networks affect a firm’s decision to start exporting. As noted by Rauch (2001) in his survey of business and social networks in international trade, “empirical research into the impact of networks on international trade has tended to lead theorizing”. What are the mechanisms through which immigrants may favor trade between the immigration and the home country? Two main channels are mentioned in the literature: immigrants may favor imports from their origin country because of their preferences for the goods they know, and immigrants may en-hance exports to their home country because they may transfer country and industry specific information to local entrepreneurs. This paper is based on the analysis of export data, and will therefore concentrate on identifying the second channel. Wagner et al. (2002) summarize the reasons for which immigrants may enhance exports to their home country. First, they have a better knowledge of business opportunities at home, with a facility to find customers for the exported goods. Second, immigrants are better informed about the business practices in their origin country, thus about the people to trust and those not to trust. Third, immigrants are familiar with the culture, the habits, and the values of their former compatriots. Fourth, they have the knowledge about local institutions and laws. Finally, immigrants have less communi-cation barriers because of they speak the language spoken in the home country. The first four channels refer to information costs, while the fifth represents a transaction cost. In the empirical analysis, I will not be able to distinguish among these five potential influence channels, however I will use control variables in order to ensure that the effect captured by the immigrants variable is not due to another, omitted variable.
Now that we described how immigrants affect exports in general, the next step is to detail the channel through which immigrants impact the profit of the firm. Theory does not describe whether immigrants networks affect the firm’s profit through the variable or the fixed cost. The usual assumption states that networks impact the profit of a firm through a non-price mechanism. We also know that it is a variable specific to a country, which affects a given region.
In the following I explain how I control for the possible diffusion channels in the variable cost, and detail how the networks affect the fixed cost at exporting. Let us now model a firm’s export behavior. A firm i starts to export to a country j if the present value of future profits is larger than the sunk entry cost fj. Assuming the absence of uncertainty on future profits, the present value of profits can be written as profits divided by the discount rate: Π/r. The probability that a firm starts to export to country j is then
P r(Sij = 1) = P r(Πij/r > fj), (1) where Sij is an indicator variable which takes the value 1 if firm i starts to export to country
j at time t. Written in logs,
P r (Sij = 1) = P r (ln Πij > ln r + ln fj) , (2) The profit of the firm in equation (2) is specified using the trade model with heterogeneous firms based on the Dixit-Stiglitz-Krugman monopolistic competition framework. Written in logs, the estimable expression for the profit writes:
ln Πij = β + β1ln ai+ β2ln wi+ β3ln dij + β4ln µj + β5ln Pj+ β6ln Yj (3) where ai is the productivity of the firm, wi the wage, dij the distance between the firm and the country, and µj, Pj and Yj country specific variables referring respectively to the share of expenditure spent on manufactured goods, the price index, and total expenditures.
The fixed cost fj is defined as a function of the number of immigrants in the region. The more numerous the immigrants from country j in region r, the lower the fixed cost to start exporting to j. Written in logs, the fixed cost writes:
ln fj = γ0− γ1ln immrj+ εijt, (4) where εijt contains the effects specific to firms, places, countries, and years, and immrj is the number of immigrants from country j residing in the French region r.
the estimable equation:
P r (Sijt= 1) = P r (β0+ β1ln ait+ β2ln wit+ β3ln dij (5) +β4ln µj+ β5ln Pj+ β6ln Yjt+ γ1ln immrj > εijt)
Equation (5) is estimated using a logit. aitis the apparent productivity of labor of the firm, which I measure through value added divided by the number of employees. I add the size of the firm, eit, as an additional proxy to productivity. I expect both variables to impact positively the probability to start exporting. wit it the wage, measured as total remunerations divided by the number of employees. Note that the wage was used during the estimation but does not appear in the final results. Its coefficient was most of the time not significant, and did not increase the explanatory power of the estimations. dij is the distance between the firm and the destination country, and I expect the coefficient to be negative. µj, and Pj correspond respectively to the share of expenditures allocated to industrial goods, and to the industrial price index. I make the difficult assumption that both variables are constant through time and that their effect will be taken into account by the country dummy used in the estimation. Yjt refers to total expenditures, and the time invariant part of it will also be controlled for by the country dummy. Finally, immrj is the number of immigrants of country j living in the d´epartement r in 1982. The main expected result concerns the coefficient γ1, which should be positive and significant if immigrants networks have a positive effect on the export behavior of firms.
3
Data and stylized facts
The data comes from three sources.
First, the French firm-level export data for the period 1986-1992 are collected by the Cus-toms and are available at INSEE. These are French export flows aggregated by firm, year and destination country. I match exports with information on firms from the EAE (Enquˆetes
An-nuelles d’Entreprises): sales, number of employees, Siren identification number, address of the
firm. To these data I add information on importing countries and trade costs: For the 61 coun-tries of the database, I use the gross domestic product (gdp) to proxy demand. Trade costs are proxied by distance between the firm and the country, as well as three dummy variables for European Community membership (EC), common language and former colony. Later in the preferred specification, I will use country dummies to take account of all the country specific characteristics. Two indicator variables are created, one for the decision to export to a country
at time t, EXPijt, and one for the decision to start to export to a country in t, Sijt. The latter equals 1 when EXPijt−1 = 0 and EXPijt = 1, equals 0 when EXPijt−1 = 0 and EXPijt= 0, and is missing when the firm stops exporting to j or continues to export to j. Table 1 summa-rizes the number of firms in each of the sample years. 48% of the single-region firms of more than 20 employees start to export to one (or more) of the 61 countries of the database in 1987, 50% in 1988 and 51% in 1989. Note that these statistics are representative of large firms only (more than 20 employees).
Figure 1: Summary statistics on firms year firms starters percent. 1987 16.698 8076 48% 1988 17.256 8710 50% 1989 17.515 8998 51 %
The third source of data relates to the main explanatory variable. Every 8 or 9 years, INSEE makes a national population census which allows to collect information on a very large set of variables, among which the nationality of the people living in each region. I use the 1982 census, which concerns a representative sample of a quarter of the French population. Three variables are used for the empirical analysis: the number of people of each nationality residing in each d´epartement, the age of each person, given in ranges of 5 years (0 to 4, 5 to 9, 10 to 14, etc...), and the education level attained by each person in the d´epartement (coded, so that the lowest number be no degree). 61 foreign countries are represented in the database. The stock of immigrants of each country is used as the variable to proxy immigrants networks. Age and education of those immigrants are averaged for each home country and d´epartement. When there are no immigrants from a given country in a d´epartement, the age and education observations are reported as missing. Dropping all French-born citizens, I remain with information on the number of people who are either foreign at the time of the census or who have been naturalized French but were born in another country. The French citizens born abroad are indeed also likely to transfer information about their birth country, and this is why I include them in the immigrants population together with the foreign citizens living in France.
Tables 6 and 7 summarize the distribution of immigrants across d´epartements. Countries are ordered in decreasing order according to the average number of immigrants in d´epartements (second column). The Tables are split in two parts. The four columns on the left correspond to the minimum, average and maximum number of immigrants of the given country in regions,
while the four columns on the right display the minimum, average and maximum shares of immigrants in total regional population. I use the number of immigrants as the explanatory variable, and so does the major part of the literature. However some studies like Godart and Toubal for example use the share of immigrants, which refers more to the density of the immi-grant population. As displayed in Table 6, the Algerians2 are the largest immigrant population
in France in 1982, with an average of 9347 Algerians in each d´epartement. The second most numerous foreign populations are the Portuguese and the Italians. Note that the fifth col-umn of the Table gives us information on the way foreign populations are distributed among d´epartements. The coefficient of variation is computed as the standard deviation divided by the average number of immigrants. Hence, a low coefficient of variation says that the number of immigrants does not vary much compared to the average number: immigrants are relatively dispersed on the territory. On the contrary, a large coefficient of variation indicates that the foreign population is agglomerated in few d´epartements. For example, we can see that the some of the largest foreign populations are quite dispersed: Portuguese, Italians and Spaniards have a coefficient of variation around 1.4. On the other side, Japanese and Comorians are among the more agglomerated foreign populations, with a coefficient of variation respectively at 5.6 and 5.4.
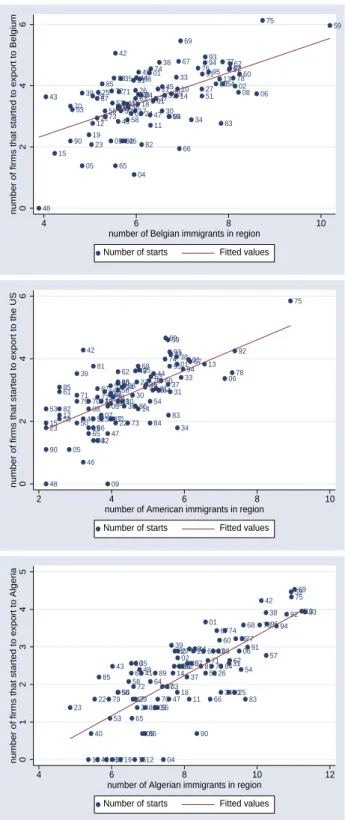
Now that we illustrated the spatial distribution of immigrants among French d´epartements, let us see whether the d´epartements containing the largest number of immigrants are also the ones in which firms start to export most to the country of origin. Figures 2 and 3 display the relation between the number of firms that started to export to a given country and the number of immigrants, respectively, in each French d´epartement. I graphed this relationship for six countries, chosen for the interesting features they display. The numbers inside the Figures refer to the code of the region (d´epartement). First, note that for all but one country, the d´epartement ‘75” (Paris intra-muros) contains the largest number of immigrants. Only for Belgians, the largest d´epartement is “59”, called Nord, at the Belgian border. All figures display an increasing relationship between the number of immigrants and the number of firms that started to export to the country. For Portugal and Algeria, the points are nicely aligned on the regression line. On the opposite, for China and Japan, the relationship is less visible. This could be imputed to the lower variability in both of the variables. For instance, in several regions, there are 0 firms that start to export to China, the same for Japan, which explains the 2Recall that the numer corresponding to each foreign population refers to the number of foreigners plus the number of foreign-born French citizens. Hence the number of Algerians comprises the French naturalized citizens born in Algeria.
vertical lines formed by the dots. Finally, let us highlight that two other d´epartements besides Paris contain repeatedly a large number of firms that start to export: these are “59”, the North, with Lille, a major French city, and “69”, the d´epartement around the city of Lyon.
In the following section we will analyse whether the observed link between the number of starts and the regional stock of immigrants is not caused by another, unobserved variable. For instance, the reasons for which immigrants are attracted to some regions could also be explanations for the active export behavior of firms in that region. In Table 1 I illustrate some of the characteristics of d´epartements : total population, gross domestic product, gdp per capita, area and unemployment. D´epartements are ordered in decreasing order according to their total number of immigrants. Only the 15 first and the 15 last d´epartements are shown. Paris is the first d´epartement in terms of immigrants in 1982, with 422.908 citizens born in one of the 61 countries in our sample. It is the second largest d´epartement after “Nord” in terms of population. All the d´epartements pertaining to Ile-de-France figure among the 15 largest d´epartements in terms of immigrants. They are also the largest in terms of total population. The first circle of d´epartements around Paris (“Seine -St-Denis”, “Hauts-de-Seine” and “Val-de-Marne”) comes before the second circle, in parallel to three non-Parisian d´epartements: “Bouches-du-Rhˆone”, “Rhone” and “Nord”. In sum, the first regions in terms of immigrants are tightly related to the first regions in terms of total population. In terms of gdp, the number of immigrants decrease with the gdp and the gdp per capita, with some exceptions, and not so closely as for total population. The size of d´epartements measured as physical area does not seem to impact the number of immigrants. This stylized fact is driven by the small size of the d´epartements in Ile-de-France, which are the only d´epartements to have been created after the others. 83 d´epartements were originally created in 1790. The Parisian region stretched out on three d´epartements, which were transformed into 8 smaller d´epartements in 1964. Finally, unemployment is not a good predictor of the number of immigrants, as low unemployment rates can be found in the first, largest regions as well as in the remote, smaller regions.
Let us now turn to estimation in order to investigate whether there is a robust link between export behavior and number of immigrants.
4
Estimation Results
I now detail the method used to identify the networks phenomenon. In the following, the origin country for all export flows will be named country F . The theoretical equation spells that if there is an effect of immigrants networks on the decision to start exporting to a given country,
Figure 2: Regional stock of immigrants and firms’ export behavior, I 01 02 03 04 05 06 07 08 09 10 11 12 13 14 15 16 17 18 19 21 22 23 24 25 26 27 28 29 30 31 32 33 34 35 36 37 38 39 40 41 42 43 44 45 46 47 48 49 50 51 52 53 54 55 56 57 58 59 60 61 62 63 64 65 66 6768 69 70 71 72 73 74 75 76 77 78 79 80 81 82 83 84 85 86 87 88 89 90 9192 9394 95 0 2 4 6
number of firms that started to export
6 7 8 9 10 11
number of immigrants in region lns Fitted values Portugal 01 02 03 04 05 06 07 08 09 10 11 12 13 14 15 16 17 18 19 21 22 23 24 25 26 27 28 29 30 31 32 33 34 35 36 37 38 39 40 41 42 43 44 45 46 47 48 49 50 51 52 53 54 55 56 57 58 59 60 61 62 63 64 65 66 67 68 69 70 71 72 73 74 75 76 77 78 79 80 81 82 83 84 85 86 87 88 89 90 91 92 93 94 95 0 1 2 3 4
number of firms that started to export to China
0 2 4 6 8
number of Chinese immigrants in region Number of starts Fitted values
China 01 02 03 04 05 06 07 08 09 10 11 12 13 14 15 16 17 18 19 21 22 23 24 25 26 27 28 29 30 31 32 33 34 35 36 37 38 39 40 41 42 43 44 45 46 47 48 49 50 51 52 53 54 55 56 57 58 59 60 61 62 6463 65 66 67 68 69 70 71 72 73 74 75 76 77 78 79 80 81 82 83 84 85 86 87 88 89 90 91 92 93 94 95 0 2 4 6
number of firms that started to export to Japan
0 2 4 6 8
number of Japanese immigrants in region Number of starts Fitted values
Figure 3: Regional stock of immigrants and firms’ export behavior, II 01 02 03 04 05 06 07 08 09 10 11 12 13 14 15 16 1718 19 21 22 23 24 25 26 27 28 29 30 31 32 33 34 35 36 37 38 39 40 41 42 43 44 45 46 47 48 49 50 51 52 53 54 55 56 57 58 59 60 61 62 6364 65 66 67 68 69 70 71 72 73 74 75 76 77 78 79 80 81 82 83 84 85 86 87 88 89 90 91 92 93 94 95 0 2 4 6
number of firms that started to export to Belgium
4 6 8 10
number of Belgian immigrants in region Number of starts Fitted values
Belgium-Luxembourg 01 02 03 04 05 06 07 08 09 10 11 12 13 14 15 16 17 18 19 21 22 23 24 25 26 27 28 29 30 31 32 33 34 35 36 37 38 39 40 41 42 43 44 45 46 47 48 49 50 51 52 53 54 55 56 57 58 59 60 61 62 63 64 6566 67 68 69 70 71 72 73 74 75 76 77 78 79 80 81 82 83 84 85 86 87 88 89 90 91 92 93 94 95 0 2 4 6
number of firms that started to export to the US
2 4 6 8 10
number of American immigrants in region Number of starts Fitted values
United-States 01 02 03 04 05 06 07 08 09 10 11 12 13 14 15 16 17 18 19 21 22 23 24 25 26 27 28 29 30 31 32 33 34 35 36 37 38 39 40 41 42 43 44 45 46 47 48 49 50 51 52 53 54 55 56 57 58 59 60 61 62 63 64 65 66 67 68 69 70 71 72 73 74 75 7677 78 79 80 81 82 83 84 85 86 87 88 89 90 91 92 93 94 95 0 1 2 3 4 5
number of firms that started to export to Algeria
4 6 8 10 12
number of Algerian immigrants in region Number of starts Fitted values
Table 1: Summary statistics on d´epartements
Departement code Tot imm Nb start pop gdp gdpcap area unemp
First 15 departements ... PARIS 75 422908 2332 2176652 60318 27444 105 7.1 SEINE-ST-DENIS 93 264416 497 1326548 13414 10067 236 6.9 B.-DU-RHONE 13 235488 445 1719856 m. m. 5087 10.3 HAUTS-DE-SEINE 92 220412 606 1386244 26770 19303 175 5.2 NORD 59 217216 1227 2516908 24113 9557 5742 9.4 RHONE 69 201996 1048 1441624 17098 11793 3249 5.7 VAL-DE-MARNE 94 184720 504 1192692 13047 10885 245 5.4 YVELINES 78 153860 366 1196828 12530 10565 2284 3.8 MOSELLE 57 152008 250 1008500 9288 9183 6216 8.3 ALPES-MARITIMES 06 137636 272 879544 m. m. 4298 11 ISERE 38 136516 602 936728 9653 10250 7431 5.9 VAL-D’OISE 95 127376 447 918352 7807 8439 1245 5.4 ESSONNE 91 109784 392 987988 9311 9456 1804 5.1 SEINE-ET-MARNE 77 98172 475 885764 8889 9943 5915 5.4 HAUTE-GARONNE 31 87896 177 820480 8410 10186 6309 8.4 . . . . . . . . Last 15 departements ... NIEVRE 58 9008 88 237584 1843 7610 6816 7.1 ORNE 61 8624 129 295684 2564 8642 6103 7.5 VIENNE 86 8564 132 371632 3271 8768 6990 9 HAUTES-ALPES 05 7656 20 105372 m. m. 5548 6.2 HAUTE-LOIRE 43 7052 144 205900 1398 6763 4977 6.4 DEUX-SEVRES 79 6844 134 341124 2705 7839 5999 7.7 INDRE 36 6528 99 242592 2038 8484 6790 6.4 MANCHE 50 5172 75 464880 3804 8247 5938 6.6 MORBIHAN 56 4516 95 589316 5012 8478 6822 8.9 VENDEE 85 3972 227 483156 3590 7382 6719 6.6 COTES-D’ARMOR 22 3740 37 539660 4392 8085 6877 8.1 LOZERE 48 3620 0 74156 542 7285 5166 5.6 CREUSE 23 2864 44 139108 898 6475 5565 6.8 CANTAL 15 2696 27 163128 1080 6609 5726 7 MAYENNE 53 2584 120 270932 2326 8614 5175 5.1
I should observe a positive relationship between the presence of immigrants from country j in region r and the probability that a firm i from region r starts to export to country j. However, in order to see whether there is a robust relationship between the two variables, we need to check two elements related to the endogeneity of the variables. First, we need to be sure that the effect captured by the immigrants variable is not due to an omitted variable that would lead to the same observed relationship between immigrants and the probability to export. Second, we need to check whether the causality goes in the right direction: do immigrants favor exporting or does exporting lead to more immigrants.
Other variables, observable or unobservable, might cause a positive relationship between firms’ export behavior and the presence of foreign immigrants in the region. These variables can be classified into three categories: region r-specific factors, country j-specific factors, and factors specific to the couple region r-country j. The first group of factors refers to characteristics that are specific to region r and that do not vary in any time or destination dimension: regional natural advantages or man-made advantages (transport infrastructure, availability of services..) are elements that attract immigrants from all countries to region r and that are also correlated with the presence of a large number of exporting firms. We thus want to control for these factors in order for the networks variable not to capture another mechanism. The second group of factors consists in characteristics of country j that do not vary in time and that concern all regions
r inside the exporting country. For example, historical ties between country F and country j
like a colonial past, cultural links (common language) and trade agreements are all reasons that will draw country j-immigrants to country F , and that are also likely to generate more exports from F to j. Therefore we also want to control for these factors. The last group of factors refers to elements that vary with a pair region r-country j, like our variable of interest. Intranational distance (mostly for border countries) is likely to favor immigration from the foreign country to region r and also to favor exports from region r to country j. Historical links between r and j like city twinning (administrative link between foreign city pairs) also. I will attempt to control for most of these effects, by incorporating distance in the list of explanatory variables for example. However without data on city twinnings, it may be that the effect captured by the immigrants variable is in part due to this phenomenon, which is also specific to the couple region r-country j.
While the main objective is to control for omitted variable bias, it is also important to ensure that coefficients on firm-level variables are correctly estimated. Indeed, firm specific factors due to heterogeneity are likely to influence the export decision, and if not controlled for could be
attributed to productivity. A good CEO running a productive firm who has studied in Germany and has built a good knowledge of the country, may start to export there, and this decision may not be directly linked with the productivity of the firm but with the personal contacts of the CEO.
In order to control for the factors cited above, we introduce sequentially the following ele-ments. Dummies for years control for the intertemporal variability of firm specific and country specific variables. Regional characteristics and firm heterogeneity are controlled by the inclusion of firm fixed effects. Finally, country dummies will capture the specificities of countries that do not vary with exporting firms and time.
The other problem related to endogeneity is reverse causality. Indeed, it could be argued that the firms that are interested in exporting to a given country j are also active in bringing to their region people originating from country j, in order to facilitate contacts with people abroad. This case is interesting and very related to ours, but it is not the mechanism we want to identify. Therefore, the possibility of reverse causality should be controlled for. I want to identify the flows of information from the immigrants present on the region in 1987, 1988 and 1989, to local entrepreneurs that then start to export. In order not to have the reverse causality, I thus want to remain with the part of the immigrants variable that is exogenous and not caused by exporting in 1987, 1988 and 1989. One possibility would be to instrument the stock of immigrants in 1987, 1988 and 1989 with the stock of immigrants in a year previous to 1987, and thus to predict the values for the three years from that lagged value. Another possibility is to use a lagged variable right away. In the following regressions, the current immigrants variable comes from the 1982 census. Hence, although it is not a proper instrumental variable, it does control for the reverse causality in that the immigrants present in the region in 1982 could hardly have arrived because of the export behavior of the firms in 1987.
Estimation results are shown in Table 2, which gradually adds controls in order to obtain the preferred specification. The dependent variable is an indicator taking to value 1 if the firm starts to export to country j in t, with t = 1986, 1987, 1988. The explanatory variables related to firm and country characteristics refer to the same year in which the firms consider exporting, and the immigrants variable refers to the stock of immigrants in 1982. In the first column, equation (5) is estimated with dummies for years and industries. The coefficient on the immigrants variable is positive and significant, however the effect might be due to regional characteristics. The use of firm fixed effects in the second column ensures that firm and at the same time region specific characteristics are controlled for. The effect of immigrants remains positive and significant. In
Table 2: The effect of immigrants networks on the export decision Dependent Variable: Sijt
Model : (1) (2) (3) (4) productivity 0.806a 0.014 0.019 0.020 ait= ln(va/emplit) (0.009) (0.026) (0.027) (0.027) size 0.595a 0.068c 0.081b 0.092b ln(emplit) (0.005) (0.036) (0.036) (0.037) distance -0.625a -0.801a -0.693a -0.607a ln(dij) (0.004) (0.005) (0.006) (0.023) demand 0.275a 0.355a 0.474a 0.523a yjt= ln(GDPjt) (0.002) (0.003) (0.003) (0.072) immigrants 0.119a 0.140a 0.015a 0.124a ln(immrj) (0.002) (0.002) (0.003) (0.005) European Community 0.930a (0.013) language 1.249a (0.014) colony 0.074a (0.016)
Year dummy yes yes yes yes
Industry dummy yes n/a n/a n/a
Firm FE no yes yes yes
Country dummy no no no yes
N 2751129 1837730 1837730 1837730
Note: Standard errors in parentheses witha,b andcrespectively denoting significance at the 1%, 5% and 10% levels.
the third column, I add other components of trade costs, i.e three dummies for the countries that share a common border with France, the French-speaking countries and the countries that were former French colonies. The inclusion of these variables divide the coefficient on immigrants by 10, however it remains significant. Finally, in the last column I use country dummies additionally to the firm fixed effects. The effect of the immigrants variable is then identified on the variability of the variable between firms and countries. The coefficient re-increases compared to column 4. Hence, controlling for potential effects due to unobserved variables, the presence of immigrants increases the probability that a firm starts exporting to the immigrants’ home country. These result comfort the existing results in the literature about the immigrants effect on trade flows. The magnitude of the effect can be evaluated by computing the elasticity of the probability to start exporting with respect to the number of immigrants: η = ˆβ(1 − P r), with ˆβ the estimated
coefficient and P r the probability to start exporting. The average value of the probability to start exporting to a country j being 0.007 in this case when referring to the estimation in column 4, we obtain an elasticity of 0.123. This means that a 10% increase in the number of immigrants in a region generates in average a 1.23% increase in the probability to start exporting.
5
The age and skills of immigrants
This section explores how the effect of immigrants on firm-level trade varies with the age and education level of immigrants. Indeed, we are trying to identify a phenomenon through which immigrants bring information to local entrepreneurs in the home country. We can therefore ex-pect that the amount of information that is transferred depends on the amount of information immigrants have, as well as on the ability of immigrants to relay information. The literature pro-vides evidence of an increasing effect of immigrants on trade with different variables measuring the experience and skill level of immigrants. Head and Ries (1998) investigate how heteroge-neous characteristics of immigrants in Canada change the magnitude of trade creation. They find that independent immigrants have more impact on trade than family immigrants. They interpret this as independent immigrants having a larger ability to stimulate exports than the average immigrant. Herander and Saavedra (2005) measure experience by the average length of stay and skills by the share of immigrants employed in skilled occupations. Both variables have a positive and significant effect on trade. In the following, I proxy the amount of information by an interaction variable containing the stock of immigrants multiplied by the average age of
the immigrants in the region (both variables in logs). The estimated equation becomes:
P r (Sijt = 1) = P r (α0+ α1ln ait+ α2ln eit+ α3ln dij + α4ln yjt (6) +α5ln immrj+ α6ln agerj∗ ln immrj > εijt) ,
I thus assume that the older the immigrants, the more information they have on their home country, either through life experience or through education. I expect the interaction term to have a positive and significant coefficient. Then, in a separate estimation I also proxy the amount of information immigrants have and their ability to transfer information by their level of education. The level of education is measured by a variable that codes the diploma obtained by each person. In a given region, the diploma variable is the average diploma obtained by the foreign population. I include an interaction term containing the average education level multiplied by the immigrants’ stock, and I expect the coefficient on the interaction variable to be positive and significant. Table 3 displays the results of both estimations, using firm fixed effects and dummies for years and countries. The coefficient on the immigrants variable is positive and significant for both estimations. More importantly, the coefficients on both interaction terms are also positive and significant. Hence, the effect of immigrants on export behavior is enhanced by the age and education level of immigrants.
6
Variation across industries and countries
The differing impact of immigrants on trade flows according to industries is a robust result of the literature. Gould (1994), Dunlevy and Hutchinson (1999) and Rauch and Trindade (2002) all find that immigrants have stronger effect on trade in sectors which can be considered producing differentiated products. In this section I investigate whether this effect is present when using firm-level trade data. The theoretical prediction states that in sectors in which goods are highly substitutable, consumers are not likely to need much information in order to decide on the variety they buy. On the contrary, information is much more likely to be valuable for differentiated goods.
In order ton confront the data with this prediction, we need a measure of the degree of goods substitution in each sector. One possibility would be to use the typical estimates of elasticities of substitution obtained from trade flows. However, according to Chaney (2005), “interpreting
the elasticity of trade flows with respect to trade barriers in gravity equations as a measure of the elasticity of substitution is incorrect” (Chaney, 2005, page 21). Indeed, he emphasizes that
Table 3: The effect of immigrants networks on the export decision Dependent Variable: Sijt
Model : (1) (2) productivity 0.014 0.014 ait= ln(va/emplit) (0.027) (0.027) size 0.090b 0.090b ln(emplit) (0.038) (0.038) distance -0.555a -0.597a ln(dij) (0.026) (0.024) demand 0.521a 0.521a yjt= ln(GDPjt) (0.075) (0.075) immigrants 0.097a 0.144a ln(immrj) (0.018) (0.007) age * immigrants 0.018a ln(agerj) ∗ ln(immrj) (0.005) diploma * immigrants 0.007a ln(diprj) ∗ ln(immrj) (0.002)
Firm fixed effects Dummies: years + countries
N 1599488 1591887
Note: Standard errors in parentheses with a, b and c re-spectively denoting significance at the 1%, 5% and 10% levels.
when considering not only the intensive margin but also the extensive margin of trade, the elasticity of trade flows with respect to trade costs is different from the traditional σ and even reacts inversely to it.
I thus use two different measures of the degree of goods differentiation. The first one is based on the goods classification established by Rauch (1999). Rauch classifies four-digits industries into three classes of goods: homogenous with a reference price quoted on organized exchange, homogenous with a reference price quoted in trade publications, and differentiated goods. I change these classes to numerical values so that 1 corresponds to the most homogenous goods and 3 to differentiated goods. Then I multiply this index by the number of 4-digits categories inside each 2-digits industry. The resulting index measures the degree of goods differentiation.
The second measure of goods differentiation is the elasticity of substitution, computed based on Chaney’s (2005) predictions. According to his model, the elasticities of aggregated sectoral trade flows with respect to variable costs estimated by Hummels (1999), refer to the index of sectoral heterogeneity γ. Knowing γ for each sector, I am able to compute σ by using the relationship between the size of a firm and its rank within the size distribution, given by Chaney (2005) page 20: ln ³ Rankih/Nh ´ = ah−σ γh h− 1ln ³ sizehi ´ (7) .
As emphasized by the author, estimating this equation provides us with an estimator of γh
σh−1. I estimate this equation for the 33 sectors in the sample, and use the γs available in
Hummels (1999) to obtain the σs for each industry.
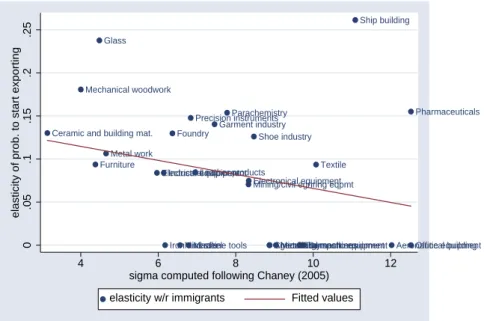
Both measures of goods differentiation are added to the estimation of the preferred speci-fication, through the inclusion of an interaction term. The interaction variable comprises the log of immigrants multiplied by the sectoral elasticity of substitution, or the log of immigrants multiplied by index computed from Rauch’s classification. Results are shown in Table 4. The coefficient on the interaction term for σ is expected to be negative and significant: an increase in the elasticity of substitution should decrease the effect of immigrants on trade. The resulting coefficient has the expected sign, and is significant at the 5% level. Figure 4 illustrates graph-ically the relationship between both variables. The negative slope confirms the result found in the estimation, however it is poorly significantly negative. Results concerning the second interaction variable are less convincing. The coefficient on the index of goods differentiation based on Rauch’s classification is expected to be positive and significant: an increase in the degree of goods differentiation should increase the effect of immigrants on the decision to start
exporting. As Table 4 shows, the coefficient is instead equal to zero. Hence only one out of two estimations assesses that the effect of immigrants on firm level trade is higher for differentiated goods. It might also be the case that the numerical measure of goods differentiation obtained from Rauch’s classification is not adequate, and in further work I plan to continue the analysis in order to obtain consistent results from different measures of goods differentiation .
Figure 4: Elasticity of the probability to start exporting with respect to the local stock of immigrants, differing among industries
Transport equipment Machine tools Agricultural machinesDomestic equipment
Iron and steelMinerals ChemicalsMetallurgy Aeronautical buildingOffice equipment Mining/civil egnring eqpmtElectronical equipment
Electrical equipmentIndustrial equipmentLeather products Textile Furniture
Metal work
Shoe industry Foundry
Ceramic and building mat.
Garment industry
Precision instrumentsParachemistry Pharmaceuticals Mechanical woodwork Glass Ship building 0 .05 .1 .15 .2 .25
elasticity of prob. to start exporting
4 6 8 10 12
sigma computed following Chaney (2005) elasticity w/r immigrants Fitted values
Finally, some studies test the hypothesis that the immigrants effect on trade differs among origin countries. The theoretical predictions concerning the the impact of immigrants of different regions of the world are however not clear-cut. The information provided by immigrants can interact with trade costs in two opposite ways. One could argue that when trade costs are low, information on the home country has a large marginal impact on the export behavior of local producers precisely because the foreign market is already easily accessible. On the other side, one could also argue that the information transferred by immigrants to local producers is more useful when trade costs are large than when trade costs are low: hence a increasing marginal impact with the level of trade costs. The literature contains both sets of results. Head and Ries (1998) find ‘great diversity in the trade effects of increased immigration’, but no systematic trend with respect to trade costs. Girma and Yu (2002) support the first hypothesis. They show that immigrants from non-Commonwealth countries positively impact U.K. trade flows while immigrants from the Commonwealth have a negative effect on trade. They explain this result by assuming that non-Commonwealth immigrants bring information that can act efficiently on local
Table 4: The effect of immigrants networks on the export decision, by industry Dependent Variable: Sijt
productivity 0.030 0.019 ait= ln(va/emplit) (0.028) (0.027) size 0.085b 0.093b ln(emplit) (0.038) (0.037) distance -0.601a -0.603a ln(dij) (0.024) (0.023) demand 0.540a 0.514a yjt= ln(GDPjt) (0.074) (0.072) immigrants 0.133a 0.130a ln(immrj) (0.009) (0.006) sigma* immigrants -0.002b σ ∗ ln(immrj) (0.001) Rauch* immigrants 0.000 R ∗ ln(immrj) (0.000)
Firm fixed effects Dummies: years + countries
N 1683285 1825374
Note: Standard errors in parentheses witha,bandc respec-tively denoting significance at the 1%, 5% and 10% levels.
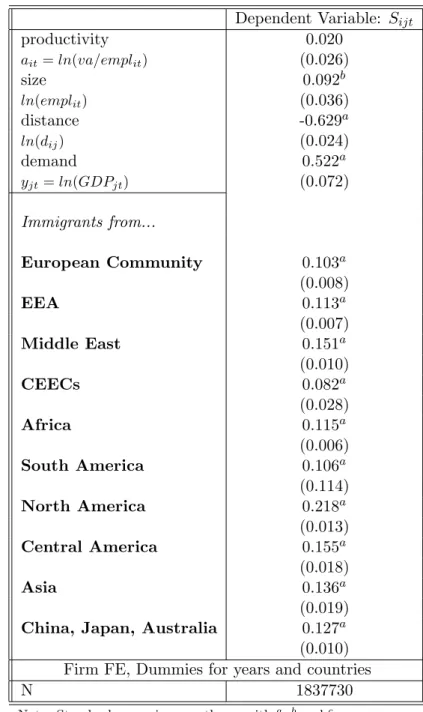
entrepreneurs precisely because these countries share high trade costs with the U.K. I investigate this question by dividing the immigrants variable into a set of variables, each corresponding to a given region of the world. Then I estimate the usual preferred specification (including firm fixed effects, dummies for years and countries), and the results are shown in Table 5. All the estimates on immigrants are positive and significant, showing that increases in immigrants from all origins are trade-creating. The strongest effect comes from immigrants from North America (USA, Canada). While Head and Ries (1998) find a negative effect of immigrants of the CEECs on Canadian trade, I obtain a positive coefficient, however it is the lowest among all. This might be due to the fact that in 1982 there were quite a large number of Polish immigrants in France arrived at the beginning of the century, however the level of trade was not so high until 1989. One possibility is that the effect of CEECs immigrants on trade becomes higher after 1990, and I will investigate this hypothesis in further work. The rest of the coefficients are quite similar, around 0.110. Hence an 10% increase in the stock of immigrants from a specific country increases the probability to start exporting to that country by 1%.
Table 5: The effect of immigrants networks on the export decision Dependent Variable: Sijt
productivity 0.020 ait= ln(va/emplit) (0.026) size 0.092b ln(emplit) (0.036) distance -0.629a ln(dij) (0.024) demand 0.522a yjt= ln(GDPjt) (0.072) Immigrants from... European Community 0.103a (0.008) EEA 0.113a (0.007) Middle East 0.151a (0.010) CEECs 0.082a (0.028) Africa 0.115a (0.006) South America 0.106a (0.114) North America 0.218a (0.013) Central America 0.155a (0.018) Asia 0.136a (0.019) China, Japan, Australia 0.127a
(0.010) Firm FE, Dummies for years and countries
N 1837730
Note: Standard errors in parentheses witha,bandc respec-tively denoting significance at the 1%, 5% and 10% levels.
7
Conclusion
The trade and networks literature provides strong evidence that social and business networks can impact export flows at the regional and national levels. The intuition behind this evidence is that immigrants can either transfer information to local entrepreneurs or create their own business and thus favor the export performance of the region or nation. Up to now, however, the evidence was restricted to aggregate studies based on intranational or international trade data. In this paper, the availability of firm-level export data allows us to investigate whether the aggregated phenomenon is backed up by micro-level evidence. Using French exports at the firm-level to 61 countries, I find that increasing the number of foreign immigrants in the region by 10% increases the probability that a firm starts exporting to the immigrants’ home country by 1.2%. More, I show that the impact of immigrants is enhanced when immigrants are older and among all more educated. The impact of immigrants does vary among sectors, and the link with the elasticity of substitution is found positive for one out of two variables measuring the degree of goods differentiation. Finally, the trade-creating effect of immigrants differ between regions of the world. North-American immigrants have the strongest impact on trade: a 10% increase in US citizens in a French region increases in average the probability to start exporting to the US by 2%.
These results are interesting in three respects. First, the positive impact of immigrants on trade is consistent with previous empirical literature. Second, it is shown that immigrants affect the probability to start exporting, and thus the number of firms that export to each country. The fact that the number of exporting firms is affected by the local stock of immigrants is a sufficient condition for the aggregate-level phenomenon to exist. Third, it opens a path towards more research concerning the mechanism through which immigrants stimulate aggregate trade flows. The next step is to understand whether the presence of foreign populations has a larger effect on the number of exporting firms or on the volume exported by each producer, i.e. whether immigrants affect in major part the extensive or the intensive margins of trade.
References
Bernard A. and J. B. Jensen, 2004, “Why Do Some Firms Export”, The Review of
Eco-nomics and Statistics, 86 (2), 561-569.
Combes P.P., M. Lafourcade and T. Mayer, 2005, “The Trade-Creating Effects of Busi-ness and Social Networks: Evidence from France”, Journal of International Economics,
Table 6: Summary statistics on foreign population in regions - countries 1 to 30
pays min Nb avg Nb max Nb var. Nb min Sh avg Sh max Sh var. Sh
DZA 128 9347 82276 1.7 .000467 .011526 .062023 1 PRT 452 8859 56596 1.4 .000889 .013824 .047452 .75 ITA 172 7910 57372 1.5 .000635 .012543 .065229 1.1 ESP 208 6331 42628 1.4 .000563 .011556 .113332 1.4 MAR 192 4891 32296 1.3 .000555 .007506 .023297 .66 TUN 24 2491 42392 2.4 .000099 .002706 .020624 1.5 POL 36 2393 32648 2.1 .000164 .003166 .023159 1.1 TUR 0 1425 11816 1.4 0 .002482 .012938 1.1 UEBL 48 1239 26700 2.3 .000272 .001761 .012191 1.1 DEU 16 1098 16792 2 .0002 .00149 .01665 1.4 VNM 4 586 8524 2 .000026 .000704 .003916 1 GBR 8 471 8016 2.1 .000058 .000605 .003683 1.1 KHM 0 465 12848 3 0 .000516 .005903 1.5 LAO 0 392 3716 1.4 0 .000617 .003614 1.1 CHE 12 392 4436 1.8 .000039 .000726 .008975 1.7 SEN 0 375 7776 2.7 0 .000366 .003572 1.8 MLI 0 267 8576 4.3 0 .000222 .006465 3.5 USA 8 236 7456 3.4 .000025 .000264 .003425 1.5 NLD 8 207 1484 1.3 .000023 .000375 .00179 .89 GRC 0 183 5316 3.4 0 .000167 .002442 1.9 LBN 0 182 5516 3.4 0 .000171 .002534 1.9 CMR 0 171 3488 3 0 .000146 .001839 2.3 MUS 0 169 4200 3 0 .000157 .00193 1.9 HUN 4 150 2500 2 4.8e-06 .000182 .001149 1 CIV 0 139 3940 3.3 0 .000126 .00181 2 IRN 0 126 4688 4 0 .000111 .002154 2.4 ROM 0 126 4684 4 0 .000118 .002152 2.1 MDG 0 111 1404 1.9 0 .000134 .000645 1 EGY 0 95 3152 3.8 0 .000083 .001448 2.4 AUT 0 93 1488 2 0 .00012 .000684 1.1
Note: Nb is number, Sh is share, var. is coefficient of variation = sd/mean. Countries are sorted in decreasing order of the average share of foreign population.
Table 7: Summary statistics on foreign population in regions - countries 31 to 61
pays min Nb avg Nb max Nb var. Nb min Sh avg Sh max Sh var. Sh
SYR 0 76 1124 2.4 0 .000085 .001111 1.8 CHN 0 76 3472 4.8 0 .000064 .001595 2.7 CHL 0 76 1104 2.2 0 .000086 .000614 1.6 JPN 0 75 3868 5.6 0 .000053 .001777 3.8 ISR 0 71 2376 3.8 0 .000055 .001092 2.7 IND 0 63 1164 2.4 0 .000072 .000535 1.4 CAN 0 63 1360 2.4 0 .000083 .000625 1.3 TGO 0 63 924 2.5 0 .000062 .000592 1.8 ARG 0 62 2028 3.5 0 .000067 .000932 1.7 MRT 0 59 1308 3.4 0 .000053 .000968 2.5 HTI 0 55 1792 4.1 0 .000044 .000823 3 BRA 0 52 2032 4 0 .000054 .000934 1.9 BEN 0 51 824 2.5 0 .000052 .00044 1.8 SWE 0 49 1064 3 0 .000058 .000719 1.9 PAK 0 44 860 2.9 0 .000042 .000482 2.3 GAB 0 37 540 2.1 0 .000042 .000272 1.6 DNK 0 33 564 2.5 0 .00004 .000505 1.8 BGR 0 30 788 3 0 .000031 .000362 1.6 COM 0 27 1376 5.4 0 .00002 .0008 4.3 COL 0 26 904 3.7 0 .000025 .000415 1.9 MEX 0 25 968 4.1 0 .000023 .000445 2.2 CAF 0 24 276 2.1 0 .000029 .000279 1.8 IRL 0 23 536 2.6 0 .000029 .000246 1.2 VEN 0 22 768 3.8 0 .000021 .000353 2.2 IRQ 0 21 604 3.3 0 .000021 .000277 2.3 NER 0 20 416 2.5 0 .000021 .000191 1.5 FIN 0 18 476 3.1 0 .00002 .000219 1.6 NOR 0 17 364 2.5 0 .00002 .000181 1.6 AUS 0 15 408 3 0 .000016 .000187 1.7 TCD 0 13 196 2.2 0 .000015 .00009 1.6 NGA 0 7.7 136 2.4 0 .000011 .000063 1.5
Note: Nb is number, Sh is share, var. is coefficient of variation = sd/mean. Countries are sorted in decreasing order of the average share of foreign population.
66 (1): 1-29.
Dunlevy J.A. and W. K. Hutchinson, 1999, “The Impact of Immigration on American Import Trade in the Late Nineteenth and Early Twentieth Centuries”, The Journal of
Economic History, 59 (4): 1043-1062.
Girma S. and Z. Yu, 2002, “The Link between Immigration and Trade: Evidence from the U.K.”, Weltwirtshcaftliches Archiv, .
Godart O. and F. Toubal, 2005, “Cross the Border and Close the Gap? How do Migrants Enhance Trade”, Discussion Paper # 289, University of T¨ubingen.
Head K., 2004, Elements of Multinational Strategy, University of British Columbia.
Head K. and J. Ries, 1998, “Immigration and Trade Creation: Econometric Evidence from Canada”, The Canadian Journal of Economics, 31 (1): 47-62.
Herander M. G. and L. A. Saavedra, 2005, “Exports and the Structure of Immigrants-Based Networks: the Role of Geographic Proximity”, The Review of Economics and
Statis-tics, 87 (2): 323-335.
Rauch J. E. and V. Trindade, 2002, “Ethnic Chinese Networks in International Trade”,
The Review of Economics and Statistics, 84: 116-130.
Rauch J., 2001, Journal of Economic Literature, 39(4): 1177-1203.
Roberts M. J and J. R. Tybout, 1997, “The decision to export in Colombia: an empirical model of entry with sunk costs”, American Economic Review, 87 (4), 545-564.
Wagner Don, K. Head and J. Ries, 2002, “Immigration and the Trade of Provinces”,