HAL Id: hal-03054309
https://hal.archives-ouvertes.fr/hal-03054309
Submitted on 11 Dec 2020
HAL is a multi-disciplinary open access
archive for the deposit and dissemination of sci-entific research documents, whether they are pub-lished or not. The documents may come from teaching and research institutions in France or abroad, or from public or private research centers.
L’archive ouverte pluridisciplinaire HAL, est destinée au dépôt et à la diffusion de documents scientifiques de niveau recherche, publiés ou non, émanant des établissements d’enseignement et de recherche français ou étrangers, des laboratoires publics ou privés.
Determination of paramagnetic concentrations inside a
diamagnetic matrix using solid-state NMR
Sébastien Maron, Nadège Ollier, Thierry Gacoin, Géraldine Dantelle
To cite this version:
Sébastien Maron, Nadège Ollier, Thierry Gacoin, Géraldine Dantelle. Determination of paramagnetic concentrations inside a diamagnetic matrix using solid-state NMR. Physical Chemistry Chemical Physics, Royal Society of Chemistry, 2017, 19 (19), pp.12175-12184. �10.1039/c7cp00451f�. �hal-03054309�
1
Determination of a paramagnetic concentration inside a diamagnetic
matrix by Solid-State NMR
Sébastien Maron&,*, Nadège Ollierǂ, Thierry Gacoin&, Géraldine Dantelle†
&Laboratoire de Physique de la Matière Condensée, École polytechnique,
CNRS, Université Paris Saclay, 91128 Palaiseau Cedex, France
ǂ
Laboratoire des Solides Irradiés, École polytechnique, CNRS, CEA, 91128 Palaiseau Cedex, France
†
Institut Néel CNRS, UPR 2940/Université Grenoble Alpes 25 Av. des Martyrs – 38 042 Grenoble Cedex 09, France
Abstract
The determination of very low doping levels in solid materials is an important issue for many applications. When considering paramagnetic dopants, NMR relaxation technique appears to be much more accurate than classical techniques such as the Vegard’s law resulting from X-ray diffraction (XRD) measurement or chemical analysis that cannot provide information of appropriate dopant spatial distribution. In a recent report, the linear variation of 1/T1, i.e. the
nuclear relaxation rate, as a function of Nd3+ content has been used to determine doping levels with a good dispersion homogeneity in the monazite LaPO4 matrix down to 0.1 mol. %. We
here extend this study to more complex compounds doped with Nd3+, such as YPO4, the solid
solution Y0.8Sc0.2PO4, Ba5(PO4)3Cl and a phosphate glass. For all considered compounds except
Ba5(PO4)3Cl:Nd, 1/T1 is found to be linearly proportional to the nominal Nd concentration,
confirming the ability of the method to investigate dopant concentration and spatial homogeneity. The results on different compounds open the discussion on the parameters influencing the nuclear relaxation rate, among which the orbital overlap and the average P-P distances.
2
Introduction
In many cases, the interesting physical properties of inorganic compounds are not intrinsic to the materials themselves but result from the addition of extra ions, called doping ions, allowing to control electrical, optical or magnetic properties. Trivalent rare-earth (RE) ions are widely used as doping ions in order to elaborate optically-active materials with various technological applications (lasing1, data memory2, phosphors etc…). These interesting optical properties are conferred by the 4f orbitals of RE, presenting the particularity to be shielded from the environment by the outer 5s and 5p orbitals. In term of material synthesis, a key challenge is to obtain well-dispersed RE ions within their host matrix. Indeed, the formation of RE pairs, small aggregates or clusters usually decreases optical performances through RE-RE interactions. In optics, a well-known phenomenon is the concentration quenching for which, above a given RE concentration, the RE luminescence decreases as energy transfers between RE ions are likely to favor the RE de-excitation in a non-radiative manner (through defects, surface traps, etc), at the expense of the radiative de-excitation.3, 4 In this context and for the mentioned applications, the doping concentration remains low, usually below 10 mol. %.5, 6
Between the nominal and the real effective RE doping concentration, there can be a non-negligible discrepancy due to dopant segregation during the synthesis (often observed in single-crystals grown by Czochralski method7) or poor incorporation due to size or charge mismatch
between the RE and the substituted ion.8 Heterogeneity of the RE distribution in the matrix can
also result from unappropriate synthesis conditions, especially in the case of a bad mixing of the precursors or too low calcination temperatures (observed in ceramics prepared by solid-state reaction) or of a non-homogeneous melt in the case of glasses. It is thus very important to analyze the obtained compound in order to determine with accuracy its doping concentration and the good dispersion of the elements.
There are not many techniques to evaluate exactly a doping concentration, especially if this concentration is of the order of a few mol.%. The commonly-used method is based on the position of Bragg diffraction peaks. Indeed, according to Vegard’s law, the homogeneous incorporation of doping ions inside a matrix, corresponding the formation of a solid solution induces a shift of the X-ray diffraction peaks with respect to pure phases. This shift varies linearly with the concentration of substituting elements. The limitation of Vegard’s law lies in the fact that the shift of the diffraction peaks is only visible when the insertion of the substituent is of a few mol.%.9 In addition, this technique is only available for crystalline materials as it is based on the position of Bragg diffraction peaks. The crystallinity is also a restrictive factor for
3 the use of the Electron Spin Resonance (ESR) for doping concentration determination. Indeed, ESR can be used to quantify the number of paramagnetic doping ions through the double integration of the ESR signal, but only if the samples are single-crystals.10,11 For other types of samples (amorphous or polycrystalline), the broadening of the ESR signal hides some characteristic features, such as ion pair signatures, and prevent any accurate quantitative measurements.12 Other techniques, such as Energy Dispersive X-ray analysis or Atomic Absorption spectrometry, turn out to be inappropriate for the detection of elements present at low concentration (typically below 1 mol.%) and are inadequate to provide information on element spatial dispersions. Finally, for optically-active materials, optical absorption spectroscopy can be used; but, for the absolute measurement of the doping concentration, the knowledge of the absorption cross-section is mandatory.7 Some other techniques could be used for determining very low doping concentrations (from 100’s of ppm to sub-ppm) such as SIMS, electron microbeam with WDX and nanoSIMS but with a spatial resolution of 10 to 1 m. In this context, we focus on an original method based on Solid-State Nuclear Magnetic Resonance (SSNMR) relaxation to determine the doping concentration in some solid state materials, whether they are crystalline or amorphous. In a previous paper, we studied the LaPO4
crystalline compound doped by two different RE ions, Gd3+ and Nd3+, and measured their 31P NMR relaxation time T1 in static and MAS conditions.13 The key result of this study is the linear
variation of 1/T1 as a function of Nd3+ (or Gd3+) concentration in the 0 – 10 mol.% range,
allowing the determination of low doping concentration (< 0.1 mol.%) with a high accuracy (error < 5%). This result was used to determine the homogeneity of the doping ions with the LaPO4 matrix, similarly to the results obtained by Levin et al. in PbTe and GeTe or BiTe, by
Sen et al. in silicate glasses, and by Li et al. in SrH2:Eu2+.14-17 This method is highly powerful
as long as the doping ions are paramagnetic and embedded within a matrix containing an element that can be analyzed easily by NMR (31P in our case).
In the present paper, we extend our work to other 31P-containing compounds doped with Nd3+ ions and study the influence of different structural factors on the T1 variation. In addition to
LaPO4, YPO4, the solid solution Y0.8Sc0.2PO4, the chloroalforsite Ba5(PO4)3Cl and a phosphate
glass are studied with Nd3+ concentration varying between 0 and 5.6 mol.%. These compounds were chosen as they do not contain any paramagnetic element, so that only the Nd3+-doping will affect the relaxation time T1. Moreover they present different crystallographic structures
(summarized in Table 1) that will help us to understand how the distances and the orbital overlap influence T1 with the Nd concentration variation. Our overall goal is to determine
4 This paper is divided into two parts: in a first part, we present the synthesis and thorough characterizations of the structure of the different compounds; in a second part we present the results concerning their relaxation time T1 as a function of the Nd3+ doping concentration and
discuss them in the light of the material structure.
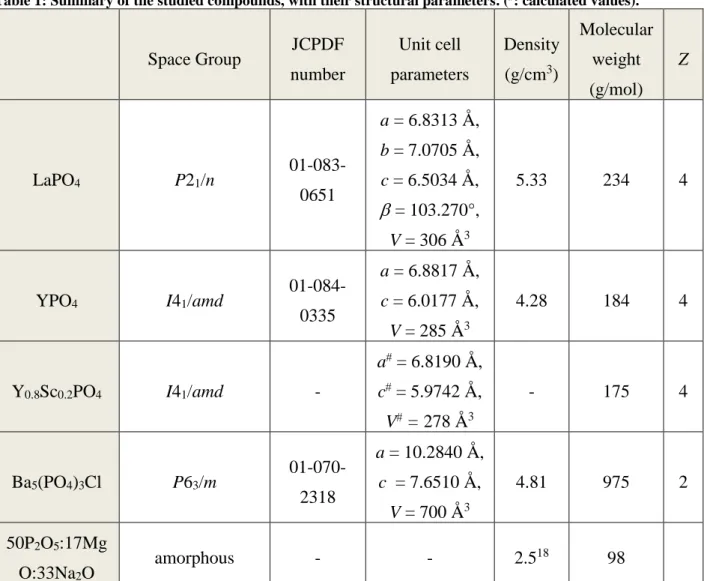
Table 1: Summary of the studied compounds, with their structural parameters. (: calculated values).
Space Group JCPDF number Unit cell parameters Density (g/cm3) Molecular weight (g/mol) Z LaPO4 P21/n 01-083-0651 a = 6.8313 Å, b = 7.0705 Å, c = 6.5034 Å, = 103.270°, V = 306 Å3 5.33 234 4 YPO4 I41/amd 01-084-0335 a = 6.8817 Å, c = 6.0177 Å, V = 285 Å3 4.28 184 4 Y0.8Sc0.2PO4 I41/amd - a = 6.8190 Å, c = 5.9742 Å, V = 278 Å3 - 175 4 Ba5(PO4)3Cl P63/m 01-070-2318 a = 10.2840 Å, c = 7.6510 Å, V = 700 Å3 4.81 975 2 50P2O5:17Mg O:33Na2O amorphous - - 2.518 98
1 Synthesis and Characterization
1.1 Synthesis
All precursors are purchased from Sigma-Aldrich. Except for pentasodium tripolyphosphate (TPP) and NH4H2PO4, they present purity over 99.9 % to minimize the level
of paramagnetic impurities (such as Fe3+ ions). The co-precipitation synthesis of the monazite phase LaPO4 doped with Nd3+ ions and of the xenotime phase YPO4 doped with Nd3+ are
described in Maron et al.13 Briefly, La(NO3)3.6H2O (or Y(NO3)3.6H2O), Nd(NO3)3.6H2O and
5 mixture is placed for 3 hours at 90 °C in an oven. After filtration, the obtained powder is annealed at 1000 °C during 4 hours. For this study, the Nd doping concentration x is comprised between 0 and 10 mol.%. In the following, the doped compounds will be labeled La1-xNdxPO4
and Y1-xNdxPO4. Nd-doped Y0.8Sc0.2PO4 solid-solution is synthesized by a solid-state route:
yttrium, scandium and neodymium oxides are mixed together with NH4H2PO4 in stoichiometric
proportions. The mixture, previously homogenized by a planetary milling (250 rpm, 20 min), is heated at 1000 °C during 2 hours and then at 1550 °C during 8 hours.19 The nominal Nd concentration is set at x = 0, 0.5 and 1 mol.%. The alforsite Ba5(PO4)3Cl doped with Nd3+ is
synthesized according to Ju et al 20: an excess of barium chloride is mixed together with BaCO3,
NH4H2PO4 and Nd2O3 in a planetary mill (2 cycles, corresponding to 10 min grinding at 250
rpm spaced by 30 s pauses). The mixture is annealed at 950 °C for 3 hrs. As the doping induces a substitution of Ba2+ by Nd3+, the nominal Nd concentration x is calculated taking into account the following chemical formula: Ba5(1-x)Nd5x(PO4)3ClO5x/2 and x is set to 0, 1 and 4 mol.%. The
obtained compounds will be labeled CAl-U (U for undoped), CAl-LD (LD for low doping) and CAl-HD (HD for high doping) respectively. Note that the charge compensation can occur through different mechanisms (such the creation of a Ba vacancy), as discussed in Ju et al.20 Regarding the Nd-doped metaphosphate glasses (Q2 type), the different compositions are summarized in Table 2:
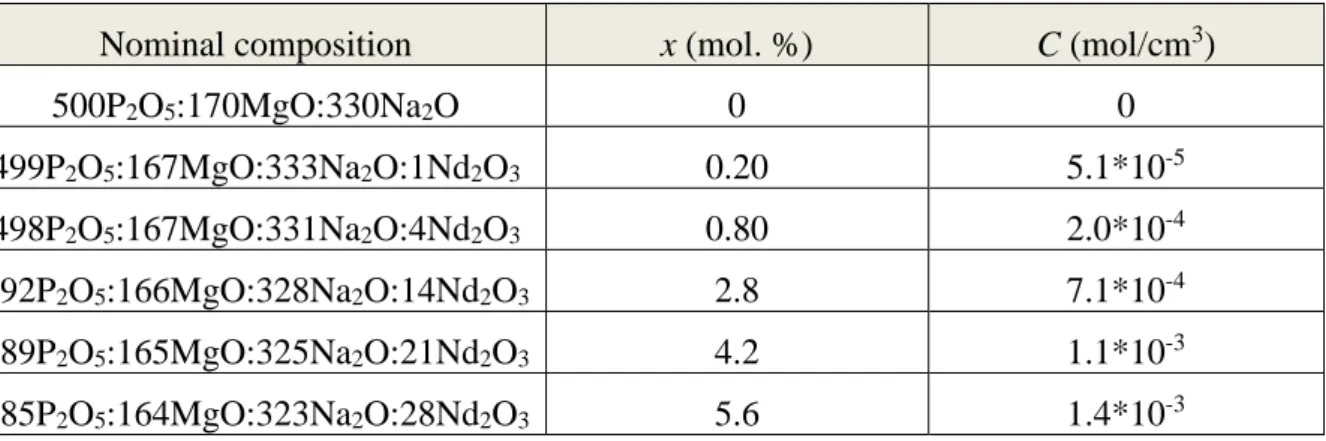
Table 2: Compositions of the different glasses synthesized and concentrations of Neodymium ion in mol. %
and mol/cm3.
Nominal composition x (mol. %) C (mol/cm3)
500P2O5:170MgO:330Na2O 0 0 499P2O5:167MgO:333Na2O:1Nd2O3 0.20 5.1*10-5 498P2O5:167MgO:331Na2O:4Nd2O3 0.80 2.0*10-4 492P2O5:166MgO:328Na2O:14Nd2O3 2.8 7.1*10-4 489P2O5:165MgO:325Na2O:21Nd2O3 4.2 1.1*10-3 485P2O5:164MgO:323Na2O:28Nd2O3 5.6 1.4*10-3
These glasses are obtained by mixing NH4H2PO4, MgO, Na2CO3 and Nd2O3 in a planetary mill.
The powders are heated in a quartz crucible according to the following program: 2 hours at 250°C, 30 min at 800°C and 1 hour at 950°C, with slow heating ramps (around 1°C/min). These different steps allow the progressive calcination of the reagents and the slow departure of CO2
6
1.2 Characterizations
1.2.1 NMR
Magic-angle spinning (MAS) Solid-State NMR (SSNMR) experiments is performed using a Tecmag Apollo360 spectrometer and a 4 mm Bruker probe spinning at 15 kHz. The 31P Larmor frequency (SF) is 145 MHz. 85% H3PO4 is used as external reference for chemical shift.
Fully relaxed conditions (repetition time equal to 5*T1) are employed for all spectra, except
mentioned. The spin-lattice relaxation time T1 is measured by using a saturation-recovery
method, using a sequence of 24 /2 pulses (equal to 2.1 s) spaced by 100 ms. In this sequence, the repetition time is equal to 1 s. FIDs are processed using NTNMR (Tecmag) software, applying a line broadening of 50 Hz. The whole spectrum, including spinning sidebands, is considered for the T1 determination. A stretched exponential, with a coefficient = 0.83, is used
for adjusting the relaxation recovery curves. As explained in our previous paper, since the best fitting values are close to each other for samples with different Nd concentrations, we decided to use a common = 0.83 to determine T1 in order to make the comparison of the results for
the different samples more consistent. 1.2.2 Structural characterization
Powder X-ray diffraction diagrams of the samples are systematically recorded using an X’Pert Philips diffractometer (40 kV, 40 mA) with CuK radiation ( = 1.54056 Å). The unit
cell parameters are obtained by fitting the diagrams with Fullprof software.22, 23 In crystals, distances between two phosphorus atoms are determined by Vesta software.24
The concentration of neodymium ions in the glass samples are determined by ICP-AES at Crealins (Lyon, France).
1.2.3 UV/Vis Absorbance
To control the homogeneity of the incorporation of the dopant into phosphate glasses, different UV/Vis spectra of a same sample are made on a Cary 50 Scan spectrophotometer from 200 to 1100 nm.
2 Results and discussion
To understand the mechanism governing the 31P relaxation in a paramagnetic environment, we synthesized different compounds and compared their relaxation rates with respect to the LaPO4 model system that we first investigated.13 First, yttrium phosphate, whose
7 structure (xenotime) is different from LaPO4 (monazite) but which presents similar unit cell
parameter, was directly compared to LaPO4 to determine the influence of the crystalline
structure, and thus the orbital overlap, onto the 31P relaxation rate. Second, the relaxation rates of two isomorphs (YPO4 and Y0.8Sc0.2PO4) were compared to evaluate the influence of the unit
cell parameters and consequently of the P-P interatomic distances. This study was extended to two other compounds: the alforsite, presenting a different crystalline structure and even more distinct P distances and a phosphate glass, presenting an amorphous structure and a larger P-P distance distribution.
2.1 Structural characterization
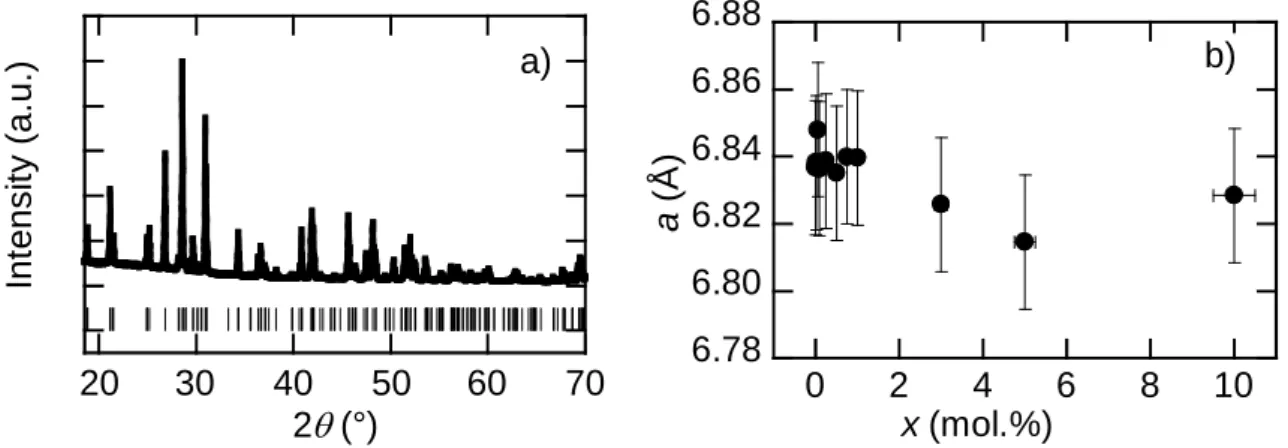
2.1.1 Nd-doped LaPO4A characteristic X-ray Powder Diffraction of La1-xNdxPO4 is given in Figure 1a. It
corresponds to the monazite structure. 25 The unit cell parameter, calculated by Fullprof,22, 23
decreases with the incorporation of Neodymium ion but its variation is scattered as we saw it in our previous paper (Figure 1b).13
20 30 40 50 60 70 2(°) a) Int en si ty (a. u. ) 6.78 6.80 6.82 6.84 6.86 6.88 0 2 4 6 8 10 a (Å ) x (mol.%) b)
Figure 1: a) X-ray Powder Diffraction diagram of LaPO4 and as a reference the positions of the diffraction
peaks of LaPO4 (JCPDF n°01-083-0651) and (b) variation of the unit cell parameter a in La1-xNdxPO4 as a
function of the Nd3+ concentration x.
The SSNMR of LaPO4:Nd has been previously described13, 26 and is here reported in SI
(Figure SI-1). Briefly, with a short repetition time, paramagnetic peaks, associated to P in a
vicinity of one Nd ions, can be observed between +40 and -40 ppm. The evolution of the FWHM is shown as a function of the Nd concentration (Figure SI-2a). The FWHM of a paramagnetic peak increases linearly with Nd concentration, evidencing an increase of the disorder around P. The area of a paramagnetic peak (at = +16 ppm for LaPO4) also varies
8 linearly with the increase of Nd doping, evidencing a good incorporation of Nd in the crystal structure (Figure SI-2b).
The doping concentration of our samples calculated from SS-NMR spectra, using the following law , x:
Ik = m * xk * (1-x)n-k (Eq. 1)
where Ik is the intensity of paramagnetic peak at +16 ppm m is the number of configurations
that can give rise to a specific peak, k is the number of Nd3+ interacting with the 31P nucleus for
the specific peak, n is the total number of sites into which Nd3+ can enter and cause a specific
paramagnetically shifted peak (equal to 7 here for the 7 distinct first-shell 31P − Nd3+
configurations), and x is the probability of Nd3+ occupying an RE-O
9 site and is equal to the
concentration of Nd3+ (out of total Nd + La). 27, 28 As shown on Figure SI-3, Nd concentration determined by NMR linearly increases and matches the nominal Nd concentration.
.
2.1.2 Influence of the crystal structure: xenotime Nd-doped YPO4
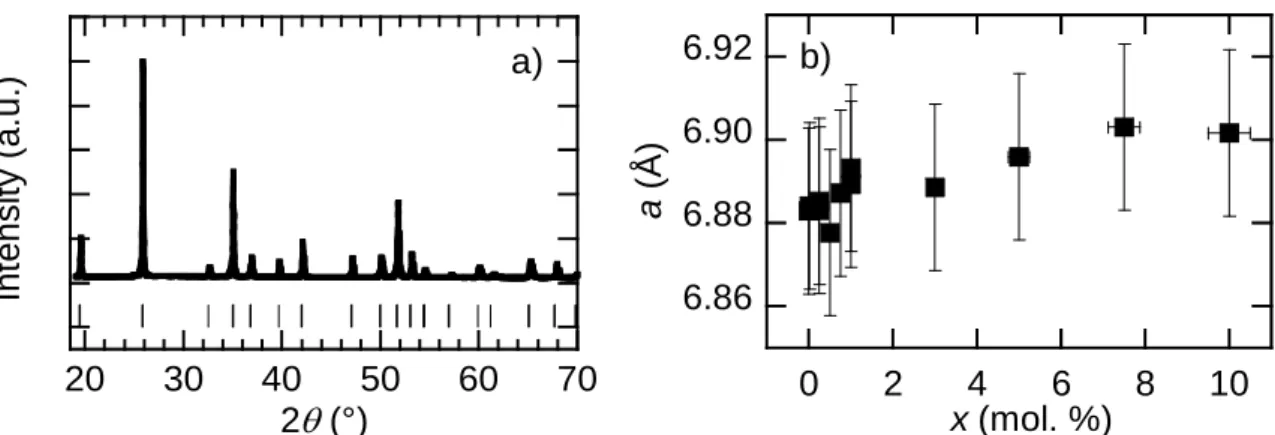
Figure 2a shows a X-ray Powder Diffraction diagram of Y0.999Nd0.001PO4. It is
characteristic of the tetragonal xenotime structure with the I41/amd space group. 25 The different
Y1-xNdxPO4 compounds, for 0 ≤ x ≤ 0.2, crystallize in the same tetragonal crystalline
structure.29 The typical unit cell parameter a is determined in the whole range of doping
concentration x (Figure 2b). Its variation is scattered again, as seen in Maron et al. for LaPO413,
evidencing the resolution limit of diffraction in the determination of doping concentration. Above x = 8 mol. %, the unit cell parameters appears constant, showing a limit of solubility.
9 20 30 40 50 60 70 2 (°) a) Int en si ty (a. u. ) 6.86 6.88 6.90 6.92 0 2 4 6 8 10 a (Å ) x (mol. %) b)
Figure 2: a) X-ray Powder Diffraction of Y0.999Nd0.001PO4 and as a reference the positions of the diffraction
peaks of YPO4 (JCPDF n°01-084-0335) and (b) variation of the unit cell parameter a in Y1-xNdxPO4 as a
function of the Nd3+ concentration x.
The SSNMR spectrum of Y0.9975Nd0.0025PO4 is reported on Figure 3 with a long
repetition delay. A single peak at 9.8 ppm is observed, equivalent to Palke and Stebbins at -12 ppm or Briche et al. at around -10.5 ppm.26, 30 No paramagnetically shifted peaks,
corresponding to 31P interacting with paramagnetic Nd3+ ions in the vicinity, are observed. In
order to observe such peaks, very short repetition delay should be used13, 26, 31
The spectrum of Y0.925Nd0.075PO4 evidences a peak at the same chemical shift, but its Full Width
at High Maximum (FWHM) appears much broader due to the strong anisotropy of the chemical shift. -50 -40 -30 -20 -10 0 10 20 30 (ppm/H 3PO4 85 %) YPO 4:Nd 0.25 % YPO 4:Nd 7.5 %
Figure 3: Solid-State NMR spectra at 15 kHz of Y0.9975Nd0.0025PO4 (blue) and Y0.925Nd0.075PO4 (light blue).
As in LaPO4, paramagnetically shifted peaks can be observed in YPO4 and are labelled
A to C, in reference to the LaPO4 spectrum (Figure SI-4). 26, 27The evolution of the area and
the FWHM as a function of Nd doping concentration in YPO4 is presented in SI (Figure SI-5
a and b). The area of a paramagnetic peak (δ = +36 ppm for YPO4) varies linearly, as in LaPO4,
indicating that Nd is well-incorporated inside YPO4.
As the doping concentration of Nd increases, the probability of having P with two Nd ions in its vicinity increases. One should then observe paramagnetic peaks that are even more
10 shifted: for instance, in YPO4, the peak at -72 ppm should be observed. However, in our case,
our interest lies in low Nd doping concentration. So, for further characterizations, and especially relaxation measurements, only the region between +60 to -40 ppm will be considered.
As for LaPO4, the doping level of our samples is checked by the application of the
formulae given by Palke et al. in 2013:27
Ik = 4 * x (1-x)5 (Eq. 1’)
As shown on Figure SI-6, Nd concentration determined by NMR linearly increases and matches the nominal Nd concentration.
2.1.3 Influence of lattice parameter: Nd-doped Y0.8Sc0.2PO4
In order to study the influence of the lattice parameter on the nuclear relaxation, compounds with the same structure but different lattice parameters were synthesized. YPO4,
ScPO4 were chosen, as well as theY0.8Sc0.2PO4 solid solution. Undoped compounds were
synthesized to verify the formation of the Y0.8Sc0.2PO4 solid solution. On Figure 4a are reported
the X-ray diffraction diagrams of undoped YPO4, ScPO4 and Y0.8Sc0.2PO4. All of these
compounds crystallize in the same space group. Note that ScPO4 presents an amorphous phase
at 2 ~ 25°. When zooming on an arbitrary diffraction peak (Figure 4b), one can observe a diffraction peak shift related to a difference in terms of ionic radius. In YPO4, where Y3+ ions
have an ionic radius of 1.02 Å, the unit cell parameter is worth a = 6.8817 Å (resp. c = 6.0177 Å); whereas in ScPO4, where Sc3+ ions have an ionic radius of 0.87 Å, it is
a = 6.5680 Å (resp. c = 5.8000 Å). Taking into account these different values, the unit cell parameters of Y0.8Sc0.2PO4 are calculated: a = 6.8190 Å and c =5.9742 Å. The experimental
values are a = 6.8117 Å and c = 5.9642 Å, confirming the formation of the expected solid solution.
11 10 20 30 40 50 60 70 2(°) YScPO 4 ScPO 4 YPO 4 a) * Int en si ty (a .u .) 25 25.5 26 26.5 27 27.5 2(°) YScPO 4 ScPO 4 YPO 4 b) In te n si ty (a .u .)
Figure 4: X-ray Powder Diffraction diagram of Y0.8Sc0.2PO4 (cyan, noted YScPO4), ScPO4 (green) and YPO4
(blue). Whole diagram (a) and zoom on the (2,0,0) peak (b). On a), the star corresponds to an amorphous unidentified phase.
On Figure 5, the NMR spectrum of ScPO4 presents two peaks: the first one at around
-12 ppm attributed to our product and another one, much broader, at around -40 ppm which confirms the presence of an amorphous phase that we have not been able to remove playing on stoichiometry and calcination temperature. The solid-state NMR spectrum of Y0.8Sc0.2PO4
exhibits two peaks: the first at -9.8 ppm corresponding to the chemical shift of 31P in the vicinity of Y atoms, as found in YPO4, and the second peak at -11.6 ppm corresponding to the chemical
shift of 31P in the vicinity of Sc atoms, as found in ScPO4. The deconvolution processed by
DMFit32 confirms the good relative proportion between Yttrium and Scandium (not shown). The interpretation of such an observation of two separate contributions corresponding to the two phases (YPO4 and ScPO4 respectively) plays in favor of a phase segregation. Nevertheless,
this is contradictory with the result from XRD characterization that follows the Vegard’s law and thus tends to demonstrate the solid solution. An interpretation could be that some segregation of the Sc ions occurs leading to P(Sc)6 units homogeneously dispersed in the host YPO4 phase. Nevertheless, confirmation of this hypothesis goes beyond the scope of this paper,
and the Y0.8Sc0.2PO4 compound should thus be considered with precautions in the further
12 -60 -50 -40 -30 -20 -10 0 10 (ppm/H 3PO4 85 %) Y 0.8Sc0.2PO4 ScPO 4 YPO 4 *
Figure 5: SSNMR at rot = 15 kHz of YPO4(blue), ScPO4 (green) and the Y0.8Sc0.2PO4 compound (cyan). The
star (*) is an unknown phase.
2.1.4 Influence of structure: Nd-doped alforsite Ba5(PO4)3Cl
The Ba5(PO4)3Cl alforsite belongs to the apatite family. It crystallizes in the hexagonal
system (P63/m) with typical unit cell parameters of 10.2840 Å for a and 7.6510 Å for c, i.e.
very different than the ones of LaPO4. Ba5(1-x)Nd5x(PO4)3ClO5x/2 was doped with different Nd
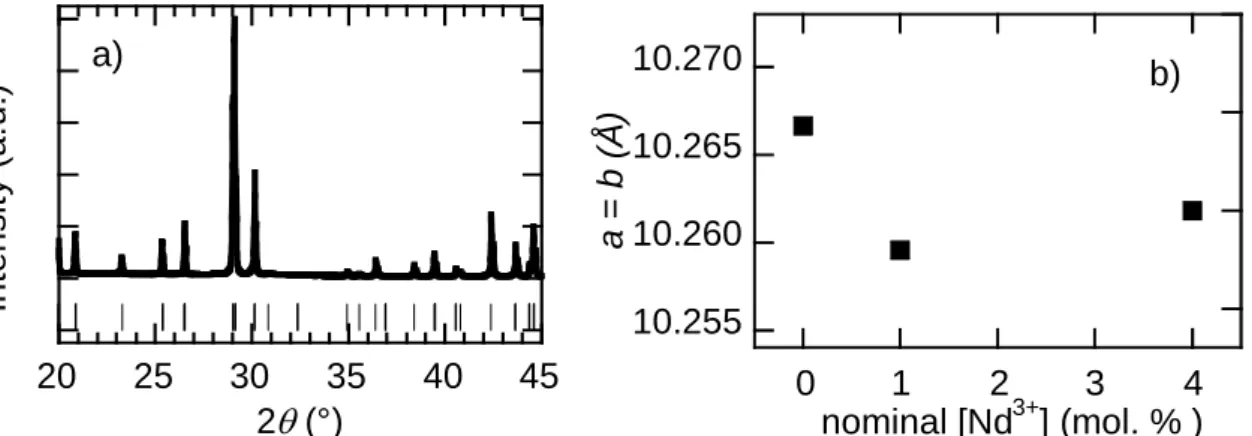
concentrations: x = 0, 0.01 and 0.04. These compounds are called U, LD and CAl-HD, respectively. Our XRD results exhibit the formation of a pure alforsite phase for all doping concentrations (Figure 6). No impurity phase is detected.
20 25 30 35 40 45 2 (°) a) Int en si ty (a. u. ) 10.255 10.260 10.265 10.270 0 1 2 3 4 a = b ( Å ) nominal [Nd3+] (mol. % ) b)
Figure 6: a): X-ray Powder Diffraction diagram of the HD sample and JCPDF file 01-070-2318 of alforsite. b): Variation of the unit cell parameters a = b as a function of the nominal Neodymium concentration in
Ba5(PO4)3Cl.
The three doping composition of alforsite do not respect the Vegard’s law, but at this step we are unable to know if it arise from uncertainty of measurements or a weakness in Nd incorporation (Figure 6b).
Figure 7 presents two solid-state NMR spectra of chloroalforsite (undoped and with 4%
of neodymium ion). On the undoped spectra, the first peak at around 0.6 ppm corresponds to Ba5(PO4)3Cl, whereas the minor peak at around 1.6 ppm is attributed to -tribaryum
13 phosphate.33 The spectrum of CAl-HD exhibits a broader peak, centered at 2.5 ppm. The increase of the FWHM, as well as the chemical shift, indicates a change in the P environment.
-10 -5 0 5 10 (ppm/H 3PO4 85 %) CAl-0 CAl-HD
Figure 7: SSNMR (r = 15 kHz) of two alforsite compounds: CAl-U (purple) and CAl-HD (light purple).
2.1.5 Influence of structure: Phosphate glasses
A series of metaphosphate glasses (characterized by a theoretical Q2 proportion of 100 %) were synthesized according to Pukhaya et al.21 X-ray Powder Diffraction confirms the amorphous nature of the different compounds, by the absence of Bragg peaks (not shown). NMR spectroscopy exhibits a broad and intense peak at around –22 ppm (Figure 8), attributed to 31P in Q2 sites.34 A second peak at around -9 ppm representing less than 10 % is attributed to the presence of Q1 sites, probably resulting to some impurities in our precursors. Due to the broad peak at -22 ppm, we could not see paramagnetic peak even with a repetition time of 50 ms
(Figure SI-7). -50 -40 -30 -20 -10 0 10 20 (ppm/H 3PO4 85 %) 5.6 at. % 4.2 at. % 2.8 at. % 0.8 at. % no doped
Figure 8: SSNMR spectra of metaphosphate glasses at r = 15 kHz. From top to bottom, with 5.6, 4.2, 2.8,
0.8 and 0 mol. % of Nd3+.
Absorption spectra were recorded for the different Nd concentrations, evidencing the different optical transitions of Nd3+ (Figure 9a).
14 200 400 600 800 1000 A b so rb a n ce (a .u .) Wavelength (nm) 4.2 mol. % a) 0 0.5 1 1.5 2 2.5 0 1 2 3 4 5 6 A b s o rpt io n co e ff ici e n t (cm -1 ) [Nd3+] (mol.%) = 874 nm b)
Figure 9: a): Absorbance of a phosphate glass doped by 4.2 mol. % of Neodymium. The main absorption
peaks at 590 nm, 750 nm and 800 nm correspond to the 4I9/2→(2G5/2,2G7/2), 4I9/2→ (4F7/2, 4S3/2) and
4I
9/2→(4F5/2,2H9/2) transitions, respectively.35 b): Absorption coefficient for different Neodymium
concentrations in the phosphate glass.
The values of absorbance for different Neodymium contents at 874 nm are reported on
Figure 9b. Taking into account the good incorporation of Nd in the sample containing 5.6 mol.
%, as observed by elementary analysis, and the linear variation of the absorption coefficient in the whole doping range, one can state that Nd3+ ions are introduced in the expected proportion into the different glasses for concentrations ranging from 0 to 5.6 mol. %. Measurements were repeated on different points of the samples to confirm their spatial homogeneity.
2.2 Relaxation measurements
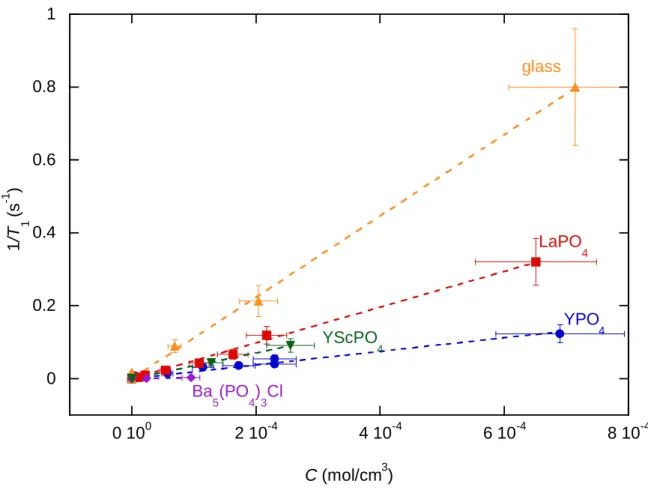
2.2.1 Relaxation mechanismThe relaxation rate of 31P atoms is plotted on Figure 10 as a function of the Nd3+ concentration for the different compounds: LaPO4 crystal, YPO4 crystal, the Y0.8Sc0.2PO4
compound, Ba5(PO4)3Cl crystal and the Na2O:MgO:P2O5 glass. The more paramagnetic Nd3+
ions in the matrix, the faster the relaxation of 31P atoms. In all compounds except the alforsite, the variation of 31P relaxation rate is significant and linear with the Nd content, evidencing a homogeneous distribution of the doping ions within the various matrices.13, 14, 36 Note that the x-axis, corresponding to the Nd concentration C has been plotted in mol/cm3 in order to take into account the density of the different compounds and thus to compare them.
15 0 0.2 0.4 0.6 0.8 1 0 100 2 10-4 4 10-4 6 10-4 8 10-4 1 /T 1 (s -1 ) C (mol/cm3) glass LaPO 4 YScPO 4 YPO 4 Ba 5(PO4)3Cl
Figure 10: Comparison of the 31P relaxation rate for LaPO
4 (red squares), YPO4 (blue circles), the
Y0.8Sc0.2PO4 compound (green triangles), Ba5(PO4)3Cl (purple diamonds) and phosphate glass (orange
triangles) in function of Neodymium concentration C (in mol/cm3). The different linear regressions are
respectively: 1/T1 = 4.9*102*C for LaPO4, 1.9*102*C for YPO4, 3.5*102*C for Y0.8Sc0.2PO4, 2.7*101*C for
Ba5(PO4)3Cl and 1.1*103*C for the metaphosphate glass with T1 in s-1 and C in mol/cm3. A zoom for
0 ≤ x ≤ 2.5*10-4 mol/cm3 of this figure is shown in SI-8.
There are two main channels of desexcitation for a nucleus in the vicinity of a paramagnetic impurity: the direct relaxation and the relaxation via spin diffusion.37 In dilute materials, the spin diffusion mechanism is predominant; whereas, in highly-doped systems, the direct relaxation should be considered. The latter corresponds to a dipolar coupling between the 31P (I = 1/2, with a Larmor frequency I) and a paramagnetic ion characterized by a momentum J,
at a Larmor frequeny J and situated at a distance d from the Phosphor. The nucleus relaxation
time T1 can be written as:37
1 𝑇1 = ( 𝜇0 4𝜋) 2 1 15𝐽(𝐽 + 1) ℏ2𝛾I2𝛾J2 𝑑6 [ 6𝜏1 1 + 𝜔I2𝜏12 + 14𝜏2 1 + 𝜔J2𝜏22], (Eq.2) where I (resp. J) is the gyromagnetic ratio of Phosphor (resp. the electron), and 1 (resp. 2) is
the electronic spin-lattice (resp. spin-spin) relaxation time.
The second regime is the relaxation through spin diffusion. It can be separated into two regimes: one, predominant at low temperature, is known as the diffusion limited regime; and the other,
16 occurring at higher temperature, is called the fast spin diffusion (FSD) regime. In the latter case, the relaxation time 𝑇1FSD can be written as:
1 𝑇1FSD = 𝐴
𝐶𝜏1 1 + 𝜔I2𝜏
12 (Eq.3)
with x the molar fraction of paramagnetic ions, and where A is
𝐴 = 8 15𝜋 ( 𝜇0 4𝜋) 2𝑁ℏ2𝛾 I2𝛾J2𝐽(𝐽 + 1) 𝑉𝑏23 (Eq.4)
and only depends on the parameter b2 , described in Goudemond et al.38 and which corresponds
to the distance below which the nuclear spin diffusion is ineffective. At room temperature τ1(Nd3+) < 1 ns, one can assume 𝜔I2𝜏12 << 1 13, so:
1
𝑇1FSD= 𝐴𝐶𝜏1 (Eq.5)
As the experimental 1/T1 variation is linear with the Nd molar concentration (Figure 10), it can
be determined that the relaxation mechanism is a fast spin diffusion regime, as already found in Maron et al. 13
Taking into account the slopes of the linear fits shown on Figure 10, as well as Eq.3 and Eq.4 and the structural characteristics indicated on Table 1, it is possible to calculate the electronic relaxation times τ1 for the crystalline compounds: τ1(LaPO4:Nd) = 11 ps with b2 = 13.6 Å and
τ1(YPO4:Nd) = 10 ps with b2 = 18.8 Å. τ1(LaPO4:Nd) and τ1(YPO4:Nd) are very short, due to
spin-orbit coupling. This explains why, in Electron Spin Resonance (ESR) experiments, Nd3+ signature should be looked for at low temperature (usually below 40 K). 11, 13 The value obtained for LaPO4:Nd is identical to the one calculated at low concentration and reported in
Maron et al.13
The question that we now want to address is the one of the factor governing the slope of the line i.e. the A coefficient, and how it could be correlated with the material structure. 2.2.2 Influence of the crystal structure
To determine whether the crystalline structure, i.e. the Nd-P distances and the orbital overlap, has an influence of the relaxation rates, one can first compare the slopes of LaPO4 and
YPO4 compounds in Figure 10. LaPO4:Nd and YPO4:Nd present similar unit cell parameters
(aLaPO4 = 6.8367 Å, bLaPO4 = 7.0746 Å, cLaPO4 = 6.5074 Å and aYPO4 = 6.8817 Å,
cYPO4 = 6.0177 Å), inducing similar Nd-P distances (average Nd-P distance in LaPO4 = 3.59 Å
17 different structures (monazite and xenotime, resp.), showing different orbital overlap. Regarding the variation of the relaxation rate as a function of the Nd concentration, it seems that this parameter has an impact on the 31P nuclear relaxation. Indeed the relaxation rate is faster for LaPO4:Nd than for YPO4:Nd.
Regarding the direct influence of the Nd-P distances, the comparison between YPO4 and the
solid solution Y0.8Sc0.2PO4 is more relevant. Indeed, YPO4 and Y0.8Sc0.2PO4 crystallize in the
same crystallographic group but they present an absolute variation of 2% of the unit cell parameters. In YPO4, there are two types of Nd-P distances: 3.014 Å (2 distances) and 3.765 Å
(4 distances) for an average distance of 3.515 Å, as calculated with Gretep software.39 In Y0.8Sc0.2PO4, these distances are 2.985 Å and 3.720 Å, giving an average distance of 3.475 Å.
The relaxation rates of YPO4 andY0.8Sc0.2PO4 are similar for the same Nd concentration. A
Nd-P distance variation of around 1% does not influence the relaxation mechanism but it is true that this variation is very small.
To analyze the variations shown in Figure 10, one could also have considered and compared LaPO4 with Ba5(PO4)3Cl as their crystalline structure and their average Nd-P distance are
different (average Nd-P distance in alforsite = 3.71 Å, considering that the Nd substitutes the Ba2+ ions). However, the constant value of 1/T1 with the Nd concentration (in the 0 – 10 -4 mol/cm3 range) tends to prove that the Nd3+ ions are not incorporated into the alforsite
structure.
2.2.3 Influence of the P-P distances
In Eq. 4, b2 is defined as the distance below the shift of the nuclear resonance frequency
due to their dipolar coupling with the electronic magnetic moment makes the nuclear spin diffusion ineffective. A mathematical expression is given by Goudemond,38 and b
2 is only
function of the P-P distance dP-P. As 𝑏2 ∝ (𝑑P−P)1/4, 1/T1 can be written as:
1
𝑇1 ∝ 𝐶𝜏1 1
(𝑑P−P)3/4 (Eq.6)
The different values of dP-P, calculated for LaPO4 and YPO4 crystals with Vesta24 when
considering the 6 P in the first coordination sphere,are reported in Table 3 for each compound.
Figure 11 shows the variation of 1/T1 as a function of 1/(dP-P)3/4 for fixed Nd concentrations: C
= 1.0*10-4, 1.8*10-4, 2.0*10-4, 3.0*10-4, 4.0*10-4 , 5.0*10-4 and 6.0*10-4 mol/cm3. Those concentrations have been chosen arbitrarily in the 0-10-3 mol/cm3 range, which is the range
18 are extracted from the fits obtained on Figure 10. The linear trend confirms that the 31P relaxe through a fast spin diffusion regime and highlights the fact that, in such a regime, the P-P distance is a key parameter. The shortest the P-P distance, the faster the relaxation rate.
Table 3: Distances between P and P atoms in the different studied structures. These distances were obtained
using Vesta software and JCPDF files 01-084-0335 for YPO4 and 01-083-0651 for LaPO4 and by Whetherall
et al. for the glass.40
Compounds Mean distances dP-P (in Å) between phosphorus atoms
(dP-P)-3/4 (in Å-3/4) YPO4 5.96 0.262 LaPO4 4.27 0.337 Glass 2.95 0.444 0 0.2 0.4 0.6 0.8 0.25 0.3 0.35 0.4 0.45 1/ T 1 (s -1 ) d P-P -3/4 ( Å-3 / 4) Glass LaPO 4 YPO 4
Figure 11: Values of 1/T1 at a neodymium concentration of 6.0*10-4 mol/cm3(circles), 5.0*10-4 mol/cm3 (top
triangles), 4.0*10-4 mol/cm3(squares), 3.0*10-4 mol/cm3(diamonds), 1.8*10-4 mol/cm3(bottom triangles) and
1.0*10-4 mol/cm3(bottom left triangles)for our three different structures (monazite LaPO
4, xenotime YPO4
and phosphate glass) in function of the average distance Phosphor – Phosphor dP-P-0.75. The different linear
laws are respectively: 1/T1 = -0.71184 + 3.0759 dP-P-0.75, 1/T1 = -0.58813 + 2.5517 dP-P-0.75 , 1/T1 =
-0.47090 + 2.0380 dP-P-0.75, 1/T1 = -0.35197 + 1.5230 dP-P-0.75 1/T1 = -0.22355 + 0.95727 dP-P-0.75, and 1/T1 =
-0.10499 + 0.44710 dP-P-0.75,with T1 in s and dP-P in Å.
2.2.4 General description of the variation of 1/T1
Our different measurements show two main parameters involved in the nuclear relaxation of 31P in the presence of Nd3+ ions in their vicinity:
(1) the molar concentration of Nd, C, as shown on Figure 10; (2) the P-P distances, expressed by the law:
19 1 𝑇1= 𝛼 (𝑑P−P)3/4 + 𝛽 (Eq.7)
established for a given Nd concentration (Figure 11).
With the aim of determining a universal law allowing the calculation of T1 for an unknown
material and Nd concentration, these two laws can be gathered and we thus propose to consider the variation of 1/T1 as:
1 𝑇1
= 𝛿 𝐶
(𝑑P−P)3/4+ 𝜀𝐶 (Eq.8)
where and are two parameters that can be determined using the fits obtained on Figure 11 for the different concentrations.
Figure 12 displays the variation of 1/T1C as a function of the corresponding dP-P-3/4 for six
different concentrations and for three of our compounds.
0 2 102 4 102 6 102 8 102 1 103 1.2 103 1.4 103 0.25 0.3 0.35 0.4 0.45 1/ (T 1 C ) (s -1 mol -1 cm 3 ) d P-P -3/4 (Å-3/4) Glass LaPO 4 YPO 4
Figure 12: Values of 1/T1 at a neodymium concentration C of 6.0*10-4 (blue), 5.0*10-4 (purple), 4.0*10-4
(pink), 3.0*10-4 (red), 1.8*10-4 (green) and 1.0*10-4 mol/cm3 (black) for our three different structures
(monazite LaPO4, xenotime YPO4 and phosphate glass) in function of the average distance Phosphor –
Phosphor dP-P-0.75. The linear law is: 1/(T1C) = - 1173.2 + 5076.7dP-P-3/4, with T1 in s, C in mol/cm3 and dP-P in
Å.
We find a remarkable linear dependence for our three compounds of interest, with characteristic P-P distances that are quite different, and although they exhibit a very different structure when comparing crystals and glass. This clearly shows that the two parameters and do not depend on the material and are thus intrinsic to the dopant element (Neodymium here) and to the Phosphor atom and their respective interactions independently from their arrangement at the microscopic scale.
20 Hence, a result of this study is to propose an empiric law that links three different parameters of Nd3+ doped phosphates: the concentration C (in mol/cm3) of paramagnetic ions, the nuclear relaxation time T1 (in s) and the Phosphor-Phosphor distance dP-P, in Å, characteristic of each
material: 1 𝑇1𝐶 = 5077 (𝑑P−P)3/4− 1173 (Eq.9)
3 Conclusion
In this study different 31P-based compounds were considered in order to evaluate the possibility to measure low paramagnetic Nd3+ doping concentration using a technique based on solid-state NMR relaxation. We show that the relaxation rate 1/T1 varies linearly with the Nd3+
concentration for a given compound and that, for a given Nd concentration, it varies linearly with 1/dP-P3/4, where dP-P is the average distance between 31P closest neighbors. By considering
these two variations, we further derived a simple empiric law describing the variation of 1/T1
as a function of C and dP-P. It would now be interesting to check for the validity of this law for
any other phosphate compounds expecting to show some universal behavior, and to get a theoretical description of the physical phenomena driving the values of the two fitted constant and . Moreover, this kind of approach could probably be extended to any other material hosting paramagnetic ions inside an NMR sensitive matrix (fluorides, silicates…).
4 Acknowledgements
21 1. Rare-Earth Doped III- Nitrides for Optoelectronic and Spintronic Applications,
Springer Netherlands, Dordrecht, 2010.
2. F. Beaudoux, R. Marino, J. Lejay, A. Ferrier, B. Tumino, O. Guillot-Noel and P. Goldner, Journal of Luminescence, 2011, 131, 469-472.
3. F. Benz, A. Gonser, R. Volker, T. Walther, J. T. Mosebach, B. Schwanda, N. Mayer, G. Richter and H. P. Strunk, Journal of Luminescence, 2014, 145, 855-858.
4. G. Blasse and B. C. Grabmaier, Luminescent Materials Springer Berlin Heidelberg, 1994.
5. A. Lyberis, A. J. Stevenson, A. Suganuma, S. Ricaud, F. Druon, F. Herbst, D. Vivien, P. Gredin and M. Mortier, Optical Materials, 2012, 34, 965-968.
6. C. Houtong, L. Rui, Y. Min, L. Liren, Z. Weiping, X. Shangda and K. Jean-Claude, Journal of Physics: Condensed Matter, 2001, 13, 1151.
7. E. Cantelar, J. A. Sanz-Garcia and F. Cusso, Journal of Crystal Growth, 1999, 205, 196-201.
8. S. Rodriguez-Liviano, F. J. Aparicio, T. C. Rojas, A. B. Hungria, L. E. Chinchilla and M. Ocana, Crystal Growth & Design, 2012, 12, 635-645.
9. M. Castellanos and A. R. West, Journal of the Chemical Society-Faraday Transactions I, 1980, 76, 2159-2169.
10. A. Abragam and B. Bleaney, Electron Paramagnetic Resonance of Transitions Ions, Clarendon Press, London, 1970.
11. O. Guillot-Noël, P. Goldner, P. Higel and D. Gourier, Journal of Physics-Condensed Matter, 2004, 16, R1-R24.
12. G. Dantelle, M. Mortier, P. Goldner and D. Vivien, Journal of Physics-Condensed Matter, 2006, 18, 7905-7922.
13. S. Maron, G. Dantelle, T. Gacoin and F. Devreux, Physical Chemistry Chemical Physics, 2014, 16, 18788-18798.
14. E. M. Levin, J. P. Heremans, M. G. Kanatzidis and K. Schmidt-Rohr, Physical Review B, 2013, 88, 115211.
15. S. Sen and J. F. Stebbins, Physical Review B, 1994, 50, 822-830.
16. W. Y. Li, V. R. Celinski, J. Weber, N. Kunkel, H. Kohlmann and J. S. auf der Gunne, Physical Chemistry Chemical Physics, 2016, 18, 9752-9757.
17. J. Cui, E. M. Levin, Y. Lee and Y. Furukawa, Physical Review B, 2016, 94, 085203. 18. R. O. Omrani, A. Kaoutar, A. El Jazouli, S. Krimi, I. Khattech, M. Jemal, J. J. Videau
and M. Couzi, Journal of Alloys and Compounds, 2015, 632, 766-771.
19. D. Brégiroux, F. Audubert, T. Charpentier, D. Sakellariou and D. Bernache-Assollant, Solid State Sciences, 2007, 9, 432-439.
20. G. Ju, Y. Hu, L. Chen and X. Wang, Journal of Applied Physics, 2012, 111, 113508. 21. V. Pukhkaya, F. Trompier and N. Ollier, Journal of Applied Physics, 2014, 116, 123517. 22. J. Rodríguez-Carvajal, Physica B: Condensed Matter, 1993, 192, 55-69.
23. J. Rodríguez-Carvajal, Commission on Powder Diffraction, 2001, 26, 12.
24. K. Momma and F. Izumi, Journal of Applied Crystallography, 2011, 44, 1272-1276. 25. Y. Ni, J. M. Hughes and A. N. Mariano, American Mineralogist, 1995, 80, 21-26. 26. A. C. Palke and J. F. Stebbins, American Mineralogist, 2011, 96, 1343-1353.
27. A. C. Palke, J. F. Stebbins and L. A. Boatner, Inorganic Chemistry, 2013, 52, 12605-12615.
28. R. J. McCarty and J. F. Stebbins, Solid State Nuclear Magnetic Resonance, 2016, 79, 11-22.
29. V. Buissette, A. Huignard, T. Gacoin, J.-P. Boilot, P. Aschehoug and B. Viana, Surface Science, 2003, 532–535, 444-449.
22 30. S. Briche, D. Zambon, G. Chadeyron, D. Boyer, M. Dubois and R. Mahiou, Journal of
Sol-Gel Science and Technology, 2010, 55, 41-51.
31. N. C. George, A. J. Pell, G. Dantelle, K. Page, A. Llobet, M. Balasubramanian, G. Pintacuda, B. F. Chmelka and R. Seshadri, Chemistry of Materials, 2013, 25, 3979-3995.
32. D. Massiot, F. Fayon, M. Capron, I. King, S. Le Calvé, B. Alonso, J.-O. Durand, B. Bujoli, Z. Gan and G. Hoatson, Magnetic Resonance in Chemistry, 2002, 40, 70-76. 33. M. Braun, P. Hartmann and C. Jana, J Mater Sci: Mater Med, 1995, 6, 150-154. 34. S. H. Santagneli, J. J. Ren, M. T. Rinke, S. J. L. Ribeiro, Y. Messaddeq and H. Eckert,
Journal of Non-Crystalline Solids, 2012, 358, 985-992.
35. K. Zou, H. Guo, M. Lu, W. Li, C. Hou, W. Wei, J. He, B. Peng and B. Xiangli, Opt. Express, 2009, 17, 10001-10009.
36. S. Sen and J. F. Stebbins, Journal of Non-Crystalline Solids, 1995, 188, 54-62. 37. A. Abragam, The Principles of Nuclear Magnetism, Clarendon Press, London, 1961. 38. I. P. Goudemond, J. M. Keartland, M. J. R. Hoch and G. A. Saunders, Physical Review
B, 2001, 63, 054413.
39. J. Laugier and B. Bochu, LMGP-Suite Suite of Programs for the interpretation of X-ray Experiments, http://www.inpg.fr/LMGP and http://www.ccp14.ac.uk/tutorial/lmgp. 40. K. M. Wetherall, D. M. Pickup, R. J. Newport and G. Mountjoy, Journal of Physics:


![[PDF] Débuter à la programmation événementielle avec le langage C# | Formation informatique](data:image/gif;base64,R0lGODlhAQABAIAAAP///wAAACH5BAEAAAAALAAAAAABAAEAAAICRAEAOw==)