HAL Id: hal-00961727
https://hal-pse.archives-ouvertes.fr/hal-00961727v2
Preprint submitted on 4 Sep 2014HAL is a multi-disciplinary open access archive for the deposit and dissemination of sci-entific research documents, whether they are pub-lished or not. The documents may come from
L’archive ouverte pluridisciplinaire HAL, est destinée au dépôt et à la diffusion de documents scientifiques de niveau recherche, publiés ou non, émanant des établissements d’enseignement et de
Trade Restrictiveness Indices in Presence of
Externalities : An Application to Non-Tariff Measures
John Christopher Beghin, Anne-Célia Disdier, Stéphan Marette
To cite this version:
John Christopher Beghin, Anne-Célia Disdier, Stéphan Marette. Trade Restrictiveness Indices in Presence of Externalities : An Application to Non-Tariff Measures. 2014. �hal-00961727v2�
Trade Restrictiveness Indices in Presence of Externalities:
An Application to Non-Tariff Measures
John Christopher BEGHIN Iowa State University
Anne-Célia DISDIER Paris School of Economics
INRA
Stephan MARETTE INRA
October 2012
G-MonD
Working Paper n°27
Trade Restrictiveness Indices in Presence of Externalities: An Application to Non-Tariff Measures
John Christopher Beghina Anne-Célia Disdierb Stéphan Marettec
Abstract: We extend the trade restrictiveness index approach to the case of market imperfections and domestic regulations addressing them. We focus on standard-like non-tariff measures (NTMs) affecting cost of production and potentially enhancing demand by reducing negative externalities. We apply the framework to the database of Kee et al. (2009) and derive ad valorem equivalents (AVEs) for NTMs. About 39% of the product lines affected by NTMs exhibit negative AVEs, indicating a trade-facilitating effect of these measures. Accounting for the trade-facilitating effect of NTMs significantly reduces previous measures of countries’ trade policy restrictiveness obtained while constraining these NTMs to be trade reducing.
Keywords: Non-tariff measures, externalities, ad valorem equivalents, trade restrictiveness indices JEL codes: F13, F18, Q56
a. CARD and Economics, Iowa State University, 383 Heady Hall, Ames, IA 50011-1070, United States. Email: beghin@iastate.edu
b. Paris School of Economics, INRA and CESifo, 48 boulevard Jourdan, 75014 Paris, France. Email:
Anne-Celia.Disdier@ens.fr
c. INRA, UMR Économie publique, Avenue Lucien Brétignières, 78850 Thiverval-Grignon, France.
Email: stephan.marette@agroparistech.fr
With the usual disclaimers, we thank Hiau Looi Kee, Alessandro Nicita and Marcelo Olarreaga for providing their dataset, and for discussions, along with Rick Barichello, Antoine Bouët, Jean-Christophe Bureau, Guillaume Gruère, Michael Ferrantino, Julien Gourdon, Dermot Hayes, Daniel Sumner, Frank van Tongeren, and participants at the ETSG 2012 Leuven 14th Annual Conference, KUL, Leuven, Belgium; the 2012 Paris Environmental and Energy
Economics Seminar series; the 2012 Iowa State University economics departmental seminar series; the 2012
International Agricultural Trade Research Consortium Annual Meetings in San Diego, California; the 2013 Global Trade Analysis Conference in Shanghai, China; the 2013 EAERE Conference in Toulouse, France., and the 14th EAAE Congress 2014 in Ljubljana, Slovenia. Beghin acknowledges support from the Marlin Cole fund at Iowa State University and Disdier acknowledges financial support from the Agence Nationale de la Recherche (grant ANR-12-JSH1-0002-01) and from the European Commission (FP7-SSH-2013-2. Grant Agreement N°613504).
1. Introduction
Non-tariff measures (NTMs) cover all policies affecting trade other than tariff and other tax instruments at the border. When markets function well and do not exhibit imperfections such as externalities or information asymmetries, NTMs often reduce welfare and distort trade flows like tariff would. However, when imperfections are present NTMs differ fundamentally from more conventional trade barriers such as tariffs and quotas (see van Tongeren et al. 2009). In particular, standard-like NTMs are playing an increasing role in international trade. Some of them may still have protectionist purposes, especially in a context of decreasing tariff barriers. However, some others are adopted by policymakers to address these market imperfections. In such cases, NTMs may be trade facilitating and welfare enhancing. Trade can expand when the perceived quality of imported goods is improved by the standard-like NTM such as imported certified organic coffee. Another case is when foreign suppliers satisfy the NTM at a lower cost than domestic suppliers do like for low-carbon biofuel imports from Brazil into OECD markets. The literature measuring the restrictiveness of trade policy, through the computation of various indices, has failed to consider these welfare and trade enhancing effects and the context of market imperfections. Our paper fills this gap.
With global sourcing, it becomes challenging to guarantee products’ safety and quality and to mitigate negative externalities. Standards and regulations affecting quality help overcome asymmetric information issues. Occasional recalls by toy, pharmaceutical and food companies illustrate the importance of various safety concerns, such as lead paints in children toys (Lipton and Barboza, 2007). Consumers may also care about global commons and avoid purchasing products obtained using unsustainable environmental practices. To preserve their reputation, large firms (e.g. Home Depot, IKEA, etc.) have shown strong support for forest certification (McDermott and Cashore, 2009). Similarly, consumer welfare is improved by quality requirements limiting residues of dangerous pesticides and antibiotics in food products (Disdier and Marette, 2010).
In this context, regulatory interventions have strong economic and political support, despite risks of inefficiency and distortions. For example, groundless precautionary measures could be an expedient
way to address consumer concern. The effects of these regulatory instruments are indeed complex not only because instruments vary across countries and are imperfect but also because they impact costs of heterogeneous producers (Carrère and de Melo, 2011). Meeting the NTMs is costly for both domestic and foreign suppliers and often more so for the latter. In the context of North-South trade, these impacts have been contentious as they may hinder or enhance trade depending on the net effect of these standards (Jaffee and Henson, 2005). While a regulation may thwart a market failure and facilitate trade between countries, it may also reduce market access for foreign producers who cannot easily comply with this regulation. To illustrate, between October 2006 and 2007, the U.S. Consumer Product Safety Commission (CPSC) announced 473 products recalls of which 389 cases involved imported products (CPSC, 2008). This last effect may outweigh the “legitimate action” to mitigate a market failure. Both trade and welfare impacts of regulation are ambiguous and in general hard to evaluate. A rigorous empirical measure of these impacts therefore requires a consistent framework, as proposed here.
We consider a small open economy, distorted, first, by arbitrary tariffs and other domestic price policy distortions, and second by market imperfections and existing NTMs allegedly addressing them. We pay particular attention to NTMs and their protective effects against import competing products, as well as their potential demand enhancing effects when NTMs reduce information asymmetries and trade cost. We then extend the trade restrictiveness index (TRI) approach of Anderson and Neary (2005) to this more general and realistic case encompassing market failures and the existing domestic regulations addressing them.
The TRI approach of Anderson and Neary (1992, 1994, 1996, 2003, and 2005) provides a welfare-based consistent aggregation of various trade distortions into a scalar uniform surtax factor, equivalent to these distortions in terms of their welfare effects. The TRI approach is a concept applying to a whole economy because it relies on the balance of trade approach. Nevertheless, it has been applied successfully to partial equilibrium and multi-market situations for both developed and developing economies. Feenstra (1995) has proposed some simplifying assumptions greatly fostering the applicability of the approach by reducing the number of price responses to estimate or calibrate in the implementation.
The TRI and its extensions such as the Mercantilist TRI (MTRI) of Anderson and Neary (2003) have been used to derive the tariff equivalent of arbitrary tariff structures (Anderson and Neary, 1994), tariffs and quotas (Anderson and Neary, 1992 and 2005), tariffs and domestic production subsidies (Anderson et al., 1995; Anderson and Neary, 2005; Beghin et al., 2003), and tariffs and AVEs of other NTMs (Hoekman and Nicita, 2011; Kee et al., 2009; Lloyd and MacLaren, 2008; and Bratt, 2012), among others. All these applications abstract from external effects or informational asymmetries, which we allow for explicitly. As shown in these applications, the TRI approach provides a consistent aggregation of distortionary effects of various policy instruments into a single “total” AVE within a given sector. The latter property explains the recent success and popularity of the approach in empirical investigations of NTMs in presence of tariffs and other price policies at the sector level.
The novelty of the present paper is to allow for market imperfections and trade facilitating effects of NTMs in the TRI framework. Despite its inherent ability to capture second-best situations, the determination of the TRI under market failure has been overlooked in the trade literature. The only related effort in this direction is from Chau et al. (2007) who develop a quantity-based distance function, a trade restrictiveness quantity index, in presence of environmental externalities but abstracting from existing policy interventions. Outside of the TRI literature, recent empirical investigations note that NTM regimes can facilitate trade (see Cadot and Gourdon, 2012, for a review). Reputation and certification processes increase trust in exchange (Blind et al., 2013); quality standards help reputation and reputation loss can be detrimental to trade (Jouanjean, 2012); and transparency provisions in trade agreements can facilitate regulated trade flows (Lejárraga et al., 2013).
We fill this gap in the TRI-related trade literature: we consider the TRI of arbitrary tariffs, domestic production subsidies, and NTMs in presence of possible external effects.1 This undertaking is a
1 Several investigations using the standard gravity equation approach find some trade facilitating effects of
NTMs but without a rationalization based on some demand increasing effect or market imperfection presumably mitigated by the NTMs being analyzed (see Li and Beghin, 2012).
substantive step forward for two reasons. First, trade policy reforms often occur in the context of market imperfections such as asymmetric information or negative externalities imposed on some agents. Accounting for these imperfections is relevant and has been the central pillar of the trade and environment literature using the dual approach to trade (Copeland, 1994; and Beghin et al., 1997). Surprisingly, this case has eluded the TRI literature. Second, numerous NTMs have been emerging in the last 15 years for several reasons, including potential protectionism, but also to address consumer and retailer concerns for health and the environment and associated external effects. A priori, excluding potential market imperfections when analyzing NTM policy reforms biases results and could lead to erroneous policy recommendations. Not surprisingly, sectoral AVEs and TRI estimates are likely to exhibit upward bias when they are econometrically constrained to treat all policies as trade-reducing. We depart from this restrictive premise and start from an agnostic prior on the impact of NTM policies on trade and welfare.
We then apply the proposed framework to the NTM global database of Kee et al. (2009) consisting of a large cross section of products (at the 6-digit level of the Harmonized System – HS – classification) and importing countries. We derive ad valorem equivalents (AVEs) for so-called technical regulations in their NTM database. These measures are standard-like measures potentially addressing market imperfections, rather than other NTMs (e.g., quantity restrictions, price control and monopolistic measures) that impede trade.2 We also compute AVEs for other policy distortions (tariffs and domestic
production subsidies). 12% of HS 6-digit lines are affected by these NTMs and 39% of these (4.7% of the lines) exhibit negative AVEs of NTMs, indicating a net trade-facilitating effect of NTMs in those sectors. These AVEs are then used to evaluate the restrictiveness of the trade policy defined by countries. TRIs computed with these AVEs reflect the frequent trade facilitating effect of NTMs. Accounting for these trade-facilitating effects significantly reduces previous measures of trade policy restrictiveness for most countries obtained while forcing standard-like NTMs to be trade impeding. These trade-facilitating effects
2 Earlier versions of our analysis were based on the full set of NTMs and reached similar qualitative
cast doubt on the predominant presumption that technical regulation NTMs are exclusively protectionist and cannot possibly boost trade, let alone welfare.
Our paper proceeds as follows. We present the framework in Section 2. We then describe the data and detail the econometric approach in Section 3. Section 4 presents the estimation results of AVEs and TRIs. We conclude in Section 5.
2. The TRI framework with market imperfection
We follow the standard TRI approach with the balance of trade function derived from the dual approach to trade for a small open distorted economy. We build on the usual framework with a negative externality affecting the representative consumer as in Copeland (1994). The externality is assumed exogenous to the consumer but influenced by the policymaker via some NTM regulations such as standard-like regulations. These regulations may not be set optimally and may be set at a protectionist level as in Fisher and Serra (2000).
2.1. Market demand and supply, and balance of trade function
The utility of the representative consumer is u(x, H(NTM)) with non-negative market goods x and negative externality H influenced by a vector of standard-like NTM policies, NTM, and with the usual definitions and properties:3
. 0 / with ) ( ; 0 / and 0 / NTM H NTM H H H u u x u ux H
3 We could complicate the model by assuming that imports m influence the health externality or H(m(NTM), NTM). This would make health depends on all the arguments influencing imports and
generate clutter with multiple feedback effects of all policies through health. The effect of NTM alone on health generates the possibility of trade enhancements which is what we are after. The direction of potential bias from ignoring these feedback effects is unclear to us.
All domestic consumer prices p are inclusive of the exogenous world price wp, a tariff τ, and the unit cost equivalent of the domestic NTM on foreign suppliers to sell in the domestic market, or p = wp +
τ + t(NTM).4
Given domestic prices p, the associated expenditure function is:
) ; | ' ( ) , , (p u H Min p x u u H H e x ,
with the usual derivative properties:
. 0 / and , 0 )) ( , , ( / e p x p u H NTM e e H ep
H
Expenditure function e exhibits all the usual homogeneity and curvature properties in prices, implying p’epp=0, eH=p’epH, eu=p’epu ; epNTM = epH HNTM , and f’eppf ≤ 0 for any arbitrary vector f of similar
dimension as p. The marginal damage eH of the negative externality is positive for any given utility level.
To keep utility constant, expenditure has to increase when the negative externality increases. Partial derivative eu is the inverse of the marginal utility of income assumed positive. We eventually simplify
preferences to follow Feenstra (1995) in the empirical investigation section.
The impact of the NTM policy encompasses several possible cases. The demand enhancing case is
epNTM = epH HNTM < 0. Protectionism of the NTM is implied by HNTM = 0 because the policy does not
address an externality or is not based on science. Another special case could be that the NTM policy affects H (Hntm<0) but that H(NTM) does not affect a particular demand (particular good n) directly, or
epnH = 0. In this case, the policy is not protectionist per se but addressing the market imperfection has no
bearing on that particular demand for good n. These last two cases show the difficulty to gauge revealed
4 Domestic and foreign firms have heterogeneous cost of meeting the NTM standard as explained later in
the production component of the model and we assume that domestic firms are more efficient at meeting these NTMs.
protectionism.5
For integrability of the Hicksian demands into the expenditure function, at least one of the demands represented by x has to be influenced by the external effect H. To illustrate, H could be the negative health effect of consuming products that are hazardous if minimum quality standards are not imposed on their production. The standard reduces the occurrence of sickness, which may affect the demand for these products, and possibly other demands via better health (reduced medical expenditure, more active leisure activities) or none other at all (all other demands independent of health status). Similar examples can be constructed with environmental external effects such as global commons or consumer packaging waste in retail consumption.
On the production side, domestic supply decisions in competitive industries are derived from the
gdp function:
( p, ) max( p' ( , ) 0) ,
y
gdp p z p y g y z
with y denoting the net output vector, z the vector of fixed national endowments, and pp the vector of
producer prices. Producer prices include production subsidies, s, such as farm subsidies, not seen by consumers, . World prices can be normalized to 1 so the distortions s, t, and τ are viewed indifferently as either ad valorem or specific policy distortions. For simplicity we assume that domestic firms already meet the standards implied by NTM but that foreign firms may not. A more complicated framework affecting both domestic and foreign firms could be included but the essence here is that t(NTM) captures the asymmetric protective effect of NTM at the border on foreign industries.6 The
5 Demand not being enhanced by the NTM policy is not sufficient although suspicion of protectionism
may arise.
6 NTM would then enter the GDP function and the derivative would represent the
leftward shift of domestic supplies caused by the NTM policies. The unit cost equivalent of yNTM would be assumed to be smaller than t(NTM) to indicate a net protective effect of NTM on domestic suppliers as in
( )
p
p wp
t NTM spNTM NTM
gdp function has the usual envelope and homogeneity properties:
= / p ; p' ; p' / p p' 0; and ' 0 for any .
p pp f g pp
gdp p y p gdp gdp p y p p g pd dp f f
For convenience we also define compensated excess demand functions m, with ( , p, ( ), , ) ( , , ( ) ( p, )
m p p H NTM u z x p u H NTM y p z , with partial derivatives indicated by the appropriate subscript as for functions e and gdp.
Now we have all the elements to develop the balance of trade function B:
( , )
( ) '( ( , , ) )) ' ).
p
p p p
B p, p wp, NTM,z,H, u
e(p, u, H NTM ) - gdp(p , z)- τ x p u H - y(p , z s y(p , z
(1)
Variable B indicates the amount of foreign exchange necessary to sustain utility u given NTM, wp, z, s, and τ. Homogeneity in prices and envelope properties of e and gdp lead to a simpler formulation of (1) seemingly omitting tariff revenues and production subsidy costs.
( , p, , , ( ), ) (1 ( )) '( ( , , ( )) - ( p, ).
B p p wp z H NTM u t NTM x p u H NTM y p z (1’)
2.2. Trade restrictiveness indices with externality
The TRI problem in our case is to find a scalar T equivalent (holding utility constant) to standard-like policies, tariffs, and production subsidies to apply as a tariff surcharge on world prices such that:
0 0 0 0 0 0 0 0 0 ( (1 ), (1 ), , , (0), ) ( ( ), ( ) , , , ( ), ) . B wp T wp T wp z H u B wp
t NTM wp
t NTM s wp z H NTM u B (2)The tariff surcharge accounts for several components: tariffs τ, domestic production subsidies s, the demand shift via H(NTM), and the protective effect from raising foreign cost to satisfy technical measure NTM, that is, t(NTM).
Next, as in Anderson et al. (1995), while holding u constant, we differentiate equation (2) with respect to T, τ, s, and NTM to derive the relative change in T rather than T as it is customarily done in the TRI literature. This step yields:
Fisher and Serra (2000).
p
' ' ' ' '
(B wp B wp dTp pp ) (BpBpp)(d
t/ NTM dNTM)B ds B Hpp H NTMdNTM,(3)
with subscripts denoting the variable involved in the partial derivative of B. Solving for dT yields:
' ' ' ' ' ' '
(1/ ( p pp ))[( p pp) pp (( p pp) / + H NTM) ],
dT B wp B wp B B d
B ds B B t NTM B H dNTM(4)
with partial derivatives Bi:
' ' ' ' ' ; ( ) ; ( ( )) 0. p p pp pp p H pH B e B s gdp B wp t NTM e
Equation (4) shows that the TRI has three policy components corresponding to the tariff, subsidy, and NTM policies. The NTM component is the sum of a demand effect via reduced externality H, and a NTM protectionist effect relative to foreign goods (through a tariff equivalent t increasing in NTM). While the sign of this protectionist effect on imports is clear, the combined effect of NTM on m via the externality H and the protectionist effect t(NTM) is ambiguous as their relative magnitude is unknown analytically. For example, a pure protectionist NTM policy imposing useless labeling requirements would raise t(NTM) and have no effect on consumers’ perception and would lead to a welfare loss and trade contraction. Conversely, standards requiring safe goods including imported ones are likely to lead to a net demand-enhancing effect lowering transaction costs for consumers. The latter NTM policy would be trade and welfare enhancing. The econometric investigation will sort the NTM regimes into trade reducing and trade facilitating since we do not impose any “protectionist” NTM prior.
Next, to further elucidate these effects and undertake our empirical investigation, we assume a simplified structure for the Hessian matrix of cross-price responses (epp - gdppp) as in Feenstra (1995), and
' 0 and ' 0 if and are non negative
p
p p
B B s .7 From these conditions we derive an implementable
framework to approximate the sector total AVE corresponding to all policy types τ, s and NTM as well as the implied TRI and the MTRI. In general, if the Hessian matrices of price responses of imports (or demand and supply responses) are not constrained to be diagonal, off-diagonal elements can be positive or
negative and it is impossible a priori to sign elements of Bp and Bppand therefore the change in the
TRI, dT. The computation of T is obviously cumbersome in the presence of cross-price effects and non-constant slopes.
We recover TRI T from dT as in Feenstra (1995) and Kee et al. (2009), which is equivalent to the initial tariffs, subsidies, and NTMs relative to a world with all policies set to 0 by integrating both sides of (4) with respect to T going from zero to T and policies going from (0,0,0) to (τ, s, NTM). The latter approach works only if dT is non-negative. This step yields:
(1/ '( pp pp) ( p pp) pp NTM ),
T wp gdp e wp B B
B sB NTM (5)with BNTM (Bp' Bp'p) / t NTM B H+ H NTMwhose sign is undetermined. The original formula in
Feenstra (1995) contains the first positive element from tariffs abstracting from s and NTM. Here, two additional components originate from production subsidies (positive contribution to the TRI), as long as subsidies are positive, and from NTM policies (ambiguous sign). The formula in Kee et al. (2009) has the protectionist effects of tariffs and subsidies and a protectionist effect of NTMs. No externality or demand enhancement appears in their equation. This additional effect included in our equation (5) can potentially facilitate trade and complicates the simple narrative of obstructive NTM policies and their tax equivalent. Equation (5) is in essence the square root of a weighted sum of deadweight losses from tariff, production
7 This simplification reduces price effects to the own-price effect, and homogeneity holds implicitly by
defining prices relative to a numéraire good. See also Lloyd and MacLaren (2010) for other structures of price responses.
subsidies, and the welfare effects of NTMs. If the latter is a pure protectionist policy, then BHHNTM is zero
(no demand shift) and the dead weight loss from the tariff equivalent t(NTM) is added to the sum of deadweight losses. If the NTM policy facilitates trade, then the latter maps into a welfare gain. Removing the NTM decreases the TRI as welfare falls with its removal. If the latter effect dominates the distortionary effect of tariffs and subsidies, then dT is negative and T cannot be recovered using (5). Instead, the change in TRI, dT, is the form of choice as in the early TRI investigations (e.g., Anderson et al., 1995).
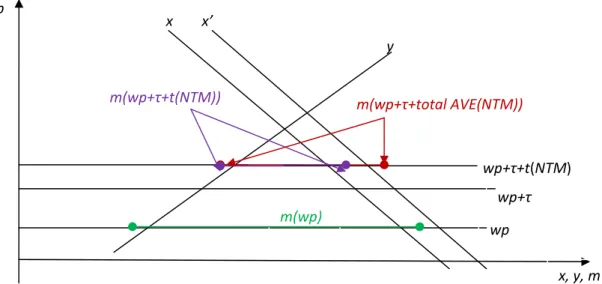
These effects are illustrated in partial equilibrium in Figure 1. Figure 1 shows the two effects of the NTM policies, that is, the demand enhancement shift (from x to x’ with greater utility achieved with reduced health hazard), and the increase in border price (wp+t(NTM)+τ) reflecting the international cost of meeting the country’s standard and the tariff, and their total effects on imports m. In previous investigations only the border price effect of NTM, t(NTM), was considered and the trade (and welfare) impact of NTM on imports was detrimental by assumption.
Figure 1. The impact of NTMs on demand, supply and imports m(wp) wp+τ wp+τ+t(NTM) x x’ y x, y, m p wp m(wp+τ+total AVE(NTM)) m(wp+τ+t(NTM))
Along with the TRI, we consider the MTRI, which holds aggregate imports (wp’m) constant. The MTRI yields the tariff equivalent to all distortions holding aggregate trade unchanged but allowing for welfare variation. The MTRI is derived in Anderson and Neary (2003) and Kee et al. (2009) who call it the overall TRI (OTRI). The derivation of the MTRI follows the spirit of the derivation of the TRI and we only present its final formula in equation (12). We refer readers to Anderson and Neary (2003) for details.
An important consequence from the potential presence of trade-enhancement effects and negative AVEs from NTMs is that our TRI and MTRI estimates will be equal or smaller than the TRI and MTRI where all policies are constrained to be trade reducing. We discuss this important point in the empirical section.
2.3. The import equation to estimate
Next, we derive the import equation to estimate and the AVEs of all policy instruments. Totally differentiation of m (holding u constant) for changes in exogenous variables leads to a change in imports of good n in any country equal to:
( / ) ( / ) [( / )( / ) ( / )( / )] ( / ) . n n n n n n n n n n n n n n n n n dm m dp d y p ds m dp t NTM x H H NTM dNTM y z dz
(6)Equation (6) and m provide a way to estimate the response of imports to tariffs, subsidies, and NTM policies, and other variables as in Feenstra (1995). We then derive the estimate of the AVE to the net effect of NTM policies on good n. Unfortunately we cannot separately identify the individual effects of NTM on m in (6), but we can estimate their net effect. Following a common practice we move the tariff effect on the left hand side of (6) and the general specification for the import demand of good n in country
c (as indicated by superscript n,c) is:
, , , , , , , , ln n c ln(1 n c) z n c S n c NTM n c. n c n k k n c n c k m
z
s
NTM (7) Elasticity n,c is the own-price response of import of good n in country c. is the sum of two AVEcomponents (the tariff equivalent of NTM on world prices, and the ambiguous import subsidy/tax effect of
,
NTM n c
NTM via decreased externality). Note that the latter AVE component is bound to the left to -100% as
prices are non-negative. This non-negative constraint provides a lower bound of -100% on
NTMn,c if we further assume that there is no trade impediment effect of the NTM policy (t(NTM)=0) at the border. This is a limit case to establish the lowest non-negative prices faced by agents in the economy.8Equation (7) once estimated provides the basis for the total AVE of NTM policies on good n, , which is: , / , , with 1 . total NTM NTM NTM n c n c total AVE
AVE (8) An AVE is developed similarly for production subsidies, based on the fact thatc n c nS c nS AVE, , / , ) 1
(
, with ( ). Unfortunately, parameter γ is not readily known as we only have estimates of import demand price elasticities and not the underlying output and demand price responses. Hence, we estimate a lower bound to the production subsidy AVE by abstracting from fraction (1-γ). Alternatively, the production subsidy AVE estimate could be seen as a market price support subsidy, affecting both consumer and producer prices. This assumption is common although not fully accurate.9Next, we specify as a transformation of an exponential such that it satisfies a lower bound on
the total AVE of the NTM effects as before and in addition allowing for fixed effects per commodity and interaction terms with country-specific exogenous shifters (endowments) z. For a continuous NTM
variable, this leads to , with parameter a constrained such that the
AVE of NTM is lower bounded at -1 or -100%. The corresponding value is a=||εn,c||. If NTM is
8 A small number of observations is concerned by this lower bound (1.4% of the AVEs). For simplicity,
we decided to impose the constraint in all tariff lines. Alternatively, the constraint could have been imposed only in the tariff lines with a negative AVE. This alternative approach would however have slightly changed the density but not the results.
9 See also Lloyd and MacLaren (2010) footnote 4 for an elaboration of this point. NTM total AVE / / = x p m p
, NTM n c , , exp( ) NTM NTM NTM n c n c n nk k k a z
approximated by a dichotomous variable, then the various partial derivatives of m, and t with respect to
NTM do not exist and are replaced by the first difference of m for NTM equal to one and zero. This leads
to an alternative formula of the total NTM AVE ( NTMdum total
AVE ) following Halvorsen and Palmquist
(1980):
(9)
The lower bound condition in (9) is slightly more cumbersome with a dichotomous NTM. The
intuition is that cannot be too large of a positive number (not to blow up the magnitude of
the AVE in (9) with its negative denominator) to keep producer and consumer prices non-negative (or that
or ). Using the same specification as for the continuous
variable case of , we specify the lower bound constraint for the dichotomous case using parameter a
in with . For small values of , the
dichotomous and continuous values of a are approximately equal.
A parallel formulation is used for
k c n k nk S n S c n S z ) exp( , ,
. As production subsidy s is positive, presumably its AVE would not lead to negative producer price issues.The total AVE of all distortions, that is, tariffs, NTMs, and subsidies for good n in country c is then (assuming the normalization wp=1):
. , , , , nc s c n NTM c n c n AVE AVE TOT
(10)The TRI in equation (5) translates into:
1/2 2 , ( / ) ( / ) nc nc n c n c nc nc n m p TOT T m p
. (11)Again, if (4) gives a negative dT, then (11) cannot be used and the change in TRI, dT, is kept to express the change in the index equivalent to the welfare impact of the policy interventions. Recall that dT
, , [exp( ) 1] / , with 1 . dum dum NTM NTM NTM total n c n c total AVE AVE , exp( NTM) 1 n c , , exp( NTM) 1 n c n c
NTM, ln(1 , ) n c n c
, NTM n c , , exp( ) NTM NTM NTM n c n c n nk k k a z
aln(1 n c, ) n c,is expressed as a sum of consumer welfare changes, and that T is the square root of a positive sum of deadweight losses.
As noted above, we use the same data and AVE estimates to compute the MTRI,Tcmerc:
, ( / ) ( / ) nc nc n c merc n c nc nc n m p TOT T m p
. (12)3. Data and econometric specification
We use the UNCTAD10-Comtrade database of Kee et al. (2009)11 as well as their import demand estimates
(Kee et al., 2008) to estimate the import demand equation (7), recover AVEs (equations (9) and (10)) at the 6-digit level of the Harmonized System (HS), and compute the MTRI and TRI, (and dTRI) equivalents to the three types of distortions (tariffs, NTMs and subsidies) as in equations (11) and (12) (or (4) for negative dTRI) for each country.
3.1. Data
Trade data come from the Comtrade database. We use the average of imports at the HS 6-digit line by importing country between 2001 and 2003. Import demand elasticities are extracted from Kee et al. (2008). Tariff data are taken from the UNCTAD and the World Trade Organization (WTO). Tariffs are for the most recent year for which data are available between 2000 and 2004. For specific tariffs, ad valorem equivalents are used. Data on NTMs are from the UNCTAD TRAINS (Trade Analysis and Information System) database with only technical regulations selected. As mentioned previously, we abstract from
10 United Nations Conference for Trade and Development.
11 As recently pointed by Breaux et al. (2013), the new NTM data collection effort under the interagency
MAST project seems to be problematic and less promising than one could have hoped. The older TRAINS database appears more reliable than the new MAST dataset.
other NTMs (e.g., quantity restrictions, price control and monopolistic measures) included in the database as they are heterogeneous and different from standard-like policies in their potential effects on demand. A dummy is set to one if the importing country imposes at least one technical regulation on a given HS6 product. Regarding production subsidies, the global dataset of Kee et al. (2009) covers agricultural domestic support. The source is the WTO domestic agricultural support notifications. This continuous variable is in dollars and its log form is used in the estimations.
Countries’ characteristics are measured by the economic size (gross domestic product – GDP), and relative factor endowments (agricultural land over GDP, capital over GDP, and labor over GDP). Data are extracted from the World Development Indicators of the World Bank. Two geographical variables are also introduced: a dummy for islands and a measure of remoteness (average distance to world markets defined as the import-weighted distance to each trading partner). Our sample includes 93 importing countries and 4,934 products (HS6 lines).
3.2. Econometric specification
We run estimations HS 6-digit line by HS 6-digit line. To control for the potential endogeneity of NTMs and production subsidies, we instrument them using exports, GDP-weighted average of the NTM dummy variable at the HS 6-digit of the 5 closest neighbors (in terms of geographic distance) and the GDP-weighted average of the agricultural domestic support at the HS 6-digit of the 5 closest neighboring economies (Kee et al., 2009). The instrumented estimation is performed in two stages. We first estimate a probit where the dependent variable is the presence or the absence of a technical regulation NTM and the explanatory variables are the instruments. The Mills ratio derived from this first stage is then included in the second stage equation. If one (or more) country provides production subsidies, instruments for this variable (exports, GDP-weighted average of the agricultural domestic support of the 5 closest neighbors) are also included in the second stage equation.
The quantity impact of the standard-like NTMs and production subsidies is then transformed into price-equivalents (AVEs) using the provided import demand elasticities. AVEs are calculated for each
importing country and HS6 line. We impose a positive cap AVEs at 50 for a few extreme values (0.01% of the observations).12 To facilitate the interpretation of the results, we compute the mean over all
importing countries at the HS6 and HS2 levels. HS2 is used in tables for ease of reporting summary tendencies. Following our estimation, 4.7% of AVEs for NTMs at the HS 6-digit level are negative, i.e., highlighting trade-facilitating NTMs. Without constraint on the sign of the AVEs, our procedure allows us to keep these negative values in our sample. AVEs of NTMs, tariffs and production subsidies are then aggregated at the country level to derive the trade restrictiveness indices corresponding to all three types of policy interventions.
Finally, we use bootstrapping to compute the standard deviations of the AVEs. The main advantage of this procedure is to account for sampling and estimation errors of the AVEs. We draw (with repetition) 200 random samples from our dataset and perform the AVEs estimation for each of these samples. Estimations are run HS6 line by HS6 line. We then compute the bootstrap standard errors as the standard deviations of these 200 AVEs.
4. Results
We first present the results on AVEs of NTMs in the presence of externalities. We also provide comparisons with the AVEs obtained when the latter are constrained to be trade reducing.
4.1. AVEs of NTMs
We focus the discussion on the results obtained for the first 20 HS sections.13 Qualitative conclusions are unchanged if the discussion of results is performed at the HS 2-digit level (with 96 sectors, see Table A.1 of the Appendix). Table 1 first reports the simple frequency ratio of NTMs for each HS section, i.e., the
12 If we set the cap at 100 (symmetric cap as the one imposed to negative AVEs), then the share of
concerned observations is 0.006% instead 0.01% and our results remain unchanged. We chose a lower bound (50) to limit distortions.
share of HS6 lines within each HS section for which at least one importing country of our sample imposes at least one technical regulation NTM. The frequency ratio of NTMs should be interpreted as follows: for section I “live animals, animal products”, the value 0.209 means that 20.9% of HS6 lines included in HS section I are affected by at least one technical regulation NTM in at least one importing country.
Results suggest that agricultural and food products (sections I through IV) are more affected by NTMs than manufactured products. The frequency ratio is indeed larger for these products. These industries have high numbers of countries’ notifications of sanitary and phytosanitary measures to the WTO.
The next column of Table 1 reports the average AVE of these NTMs for each HS section allowing for the presence of externalities. The mean is computed over all importing countries and HS6 lines within each section. The mean AVE on the whole sample is equal to 0.044, but strong differences can be observed across sections. First, the magnitude of the mean AVE varies significantly across sections from 0.002 to 0.083. All sections exhibit a non negative average AVE, indicating that technical regulation NTMs have, on average, a net negative impact on trade flows. For two sections (Pearls and precious metals and stones, and Arms and ammunition14), the average AVE is near zero, suggesting that NTMs
have on average no net impact. In our sample, 12.1% of HS6 lines are affected by NTMs and 38.8% of them exhibit negative AVEs of NTMs. These negative AVEs are spread over all HS sections (and HS2 sectors as shown in Appendix Table A.1). Column (3) of Table 1 underlines the upward bias affecting the estimation of AVEs when NTM are constrained to be trade-reducing. As expected, the average AVE for each HS section is systematically higher than the average AVE obtained in column (2). Using averages, the bias is about 100% (from 0.088 to 0.044).
As highlighted with the frequency ratio, the share of HS6 lines subject to at least one NTM greatly differs across sections and could therefore bias the average AVE calculated using all HS6 lines. To control
14 The sector of arms and ammunition is least likely to observed commercial trade and standard-like NTM
for this bias, columns (4) and (5) of Table 1 report the average AVE computed only on HS6 lines on which at least one technical measure NTM is applied. Column (4) allows for the presence of market imperfections and trade-facilitating NTMs, while column (5) does not. As expected, the average AVE computed only on HS6 lines subject to a technical regulation NTM is always higher in absolute value than the one based on all HS6 lines (with or without a NTM). Table 1 also shows that forcing technical regulation NTMs to be trade impeding leads to an even larger bias when looking at sectors for which at least one technical regulation NTM is present. This bias is particular strong for agricultural and food sectors (sections 1 through 4). For example, for section 4 (Prepared foodstuff), the constrained AVE estimates are on average twelve-fold larger (0.608 and 0.049).
Table 1: Frequency ratios and AVEs of technical-regulation NTMs, by HS section HS
section
codes HS section names
Simple frequency
ratio of NTMs
AVE of NTMs all HS6 lines (mean)
AVE of NTMs if NTM=1 (mean) Unconstrained
estimationa Constrained estimationb Unconstrained estimationa Constrained estimationb I Live animals, animal products 0.209 0.018 0.128 0.084 0.609 II Vegetable products 0.223 0.028 0.128 0.126 0.574 III Fats and oils 0.202 0.067 0.145 0.333 0.717 IV Prepared foodstuffs, beverages,
spirits, tobacco 0.259 0.013 0.157 0.049 0.608
V Minerals 0.054 0.027 0.046 0.500 0.846
VI Chemicals, allied industries 0.134 0.033 0.088 0.244 0.657 VII Plastics, rubber 0.121 0.052 0.094 0.432 0.774 VIII Hides, leather, furskins 0.074 0.029 0.056 0.395 0.763
IX Wood and wood articles 0.105 0.051 0.077 0.486 0.732 X Pulp of wood, paper, printing 0.096 0.039 0.071 0.404 0.744 XI Textiles, apparel 0.097 0.033 0.068 0.339 0.695 XII Footwear, headgear 0.103 0.025 0.064 0.241 0.622 XIII Stone, cement, ceramic articles, glass 0.081 0.055 0.074 0.681 0.917 XIV Pearls, precious metals and stones 0.003 0.002 0.002 0.732 0.732
XV Base metals and articles 0.085 0.044 0.067 0.516 0.796 XVI Machinery, electrical and video
equipment 0.129 0.083 0.114 0.648 0.887
XVII Vehicles, aircraft, vessels 0.109 0.035 0.080 0.317 0.730 XVIII Optical, photo., medical instr. 0.096 0.042 0.074 0.441 0.775
XIX Arms, ammunition 0.044 0.008 0.021 0.182 0.474 XX Miscellaneous (furniture, toys, others) 0.108 0.062 0.100 0.570 0.925
All sections 0.121 0.044 0.088 0.362 0.729
a: Unconstrained estimation means that impact of technical regulation NTMs on trade is not restricted in the econometric estimation.
b: Constrained estimation means that technical regulation NTMs are constrained to have a non positive impact on trade in the estimation.
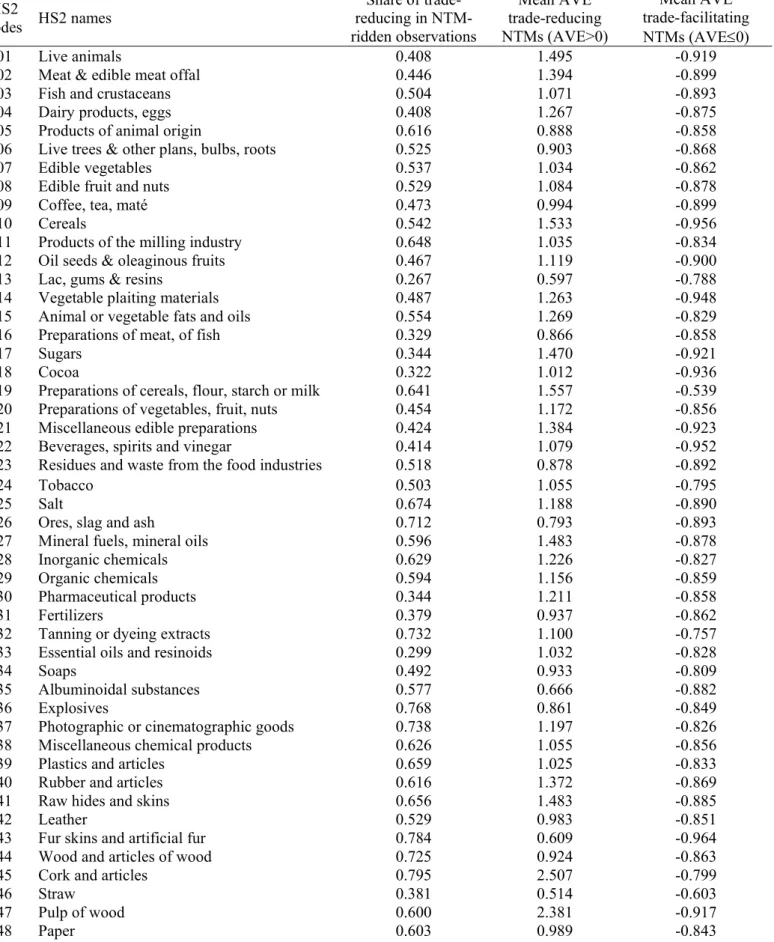
Table 2 distinguishes between trade-reducing and trade facilitating NTM estimates using results from the unconstrained estimation (allowing for external effects). Again results are summarized by HS
section. The first column of Table 2 provides the share of technical regulation NTM-ridden observations with positive AVEs (trade-reducing NTMs). This share varies across sections, from 43.9% (Prepared foodstuffs) to 100% (Pearls, precious metals…). For 18 out of 20 sections, the majority of NTMs are trade-reducing (with a share above 50%). In total, 61.2% of NTM-ridden lines at the HS6 level are negatively affected by technical regulation NTMs.
The last 2 columns of Table 2 show the mean AVE for trade-reducing technical regulation NTMs and that of trade-facilitating technical regulation NTMs by HS section. We previously noticed that these NTMs were more numerous on agricultural products. According to the second column of Table 2, the AVEs of trade-reducing NTMs on agricultural and food products are slightly higher than the ones obtained on most manufactured products. The average positive AVE for the whole sample is equal to 1.133. In the last column of Table 2, AVEs of trade-facilitating NTMs are nonpositive of course, and because of the non-negative price constraint, they are included in the interval [-1;0]. Interestingly, we observe that the magnitude of these AVEs is high in absolute value. The minimum in absolute value per section is equal to -0.801 (section 19 Arms, ammunition) and the maximum (-0.912) is reached for section 18 (Optical, photographic, medical instruments). The mean over all sections is -0.856. Conclusions remain valid at the HS 2-digit level (see Table A.2 of the Appendix).
Table 2. AVEs of trade-reducing and trade-facilitating technical regulation NTMs, by HS section
HS section
codes HS section names
Share of trade-reducing in NTM- ridden observations Mean AVE trade-reducing NTMs (AVE>0) Mean AVE trade-facilitating NTMs (AVE0) I Live animals, animal products 0.464 1.213 -0.892
II Vegetable products 0.515 1.070 -0.876
III Fats and oils 0.554 1.269 -0.829
IV Prepared foodstuffs, beverages, spirits, tobacco 0.439 1.210 -0.860
V Minerals 0.646 1.259 -0.884
VI Chemicals, allied industries 0.551 1.130 -0.844
VII Plastics, rubber 0.644 1.138 -0.846
VIII Hides, leather, furskins 0.618 1.181 -0.873 IX Wood and wood articles 0.709 1.025 -0.826
X Pulp of wood, paper, printing 0.631 1.138 -0.853
XI Textiles, apparel 0.637 1.031 -0.875
XII Footwear, headgear 0.594 1.014 -0.889
XIII Stone, cement, ceramic articles, glass 0.748 1.190 -0.829 XIV Pearls, precious metals and stones 1.000 0.732 --
XV Base metals and articles 0.696 1.096 -0.816
XVI Machinery, electrical and video equipment 0.735 1.175 -0.817 XVII Vehicles, aircraft, vessels 0.618 1.037 -0.847
XVIII Optical, photo., medical instr. 0.655 1.155 -0.912
XIX Arms, ammunition 0.672 0.663 -0.801
XX Miscellaneous (furniture, toys, others) 0.653 1.341 -0.882
All sections 0.612 1.133 -0.856
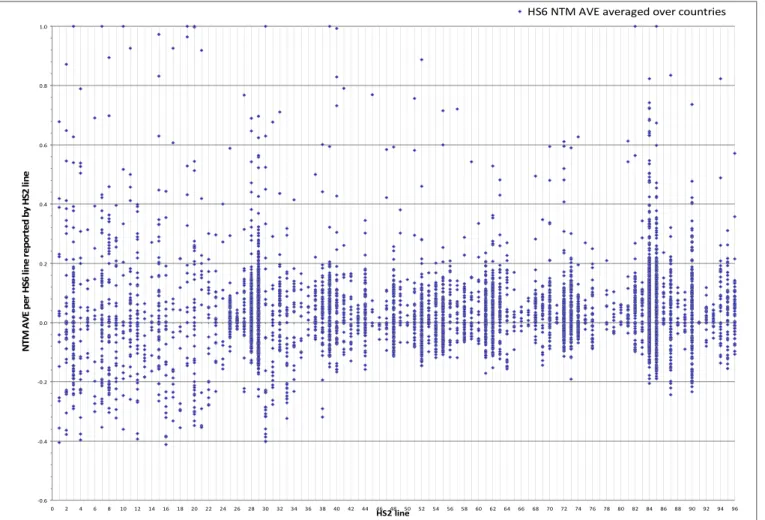
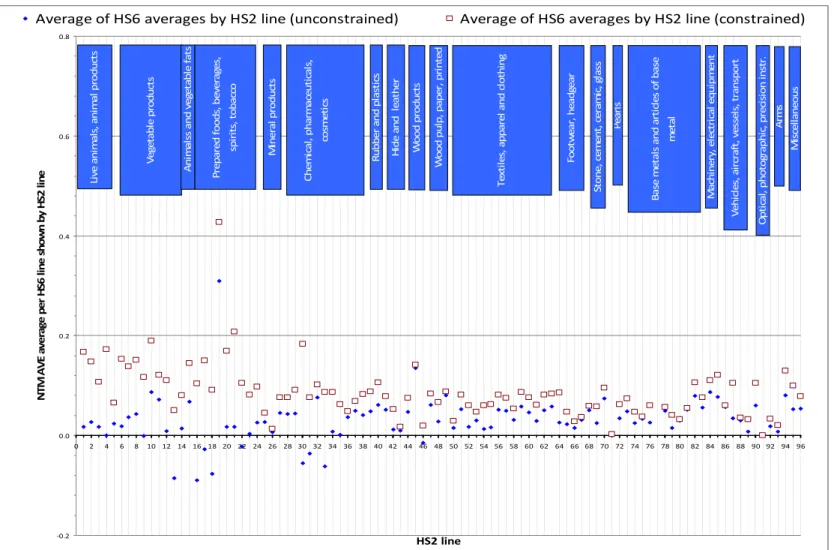
Figures 2 and 3 provide further insights on the technical regulation NTM AVES. Figure 2 shows the scattered plot of AVEs at HS6 level, average over all countries and sorted by HS2 line (x-axis
numbered from 1 to 96 for 96 HS2 lines). Results at the HS 2-digit level are consistent with previous conclusions and some heterogeneity is also observable across HS2 sectors in the magnitude of the AVEs of trade reducing and facilitating NTMs. The plot shows the density of negative (and positive15) AVEs for
most HS2 lines, and in particular for Fish and crustaceans (line 3), Inorganic and Organic chemicals (lines 28 and 29), and Iron and steel and Articles of iron and steel (lines 72 and 73), Nuclear reactors, Electrical machinery and equipment (lines 84 and 85), and Optical, photographic, measuring, precision and medical instruments (line 90). The plot also shows the presence of large positive outliers for many HS6 lines. Figure 3 shows the mean of the HS6 AVE averages by HS2 line when allowing for trade facilitating effects or not. All of the within-HS2 means are higher when constraining the estimation to exclude trade-facilitation effects. Some unconstrained means are negative in Lac, gums and resins (line 13), Preparations of meat and fish (line 16), Cocoa (line 18), Pharmaceutical products (line 30) and Fertilizers (line 31), suggesting again the presence of a number of trade-facilitating standard-like NTM regimes in sector like agri-food sectors and chemicals. To offset that, positive average AVEs also abound suggesting trade-reducing effects in various sectors most visibly in Preparations of cereals (line 19). For some HS 2-digit sectors, such as Live animals, Dairy products, Live trees, and Edible fruit and nuts, more than one quarter of the HS6 lines are subject to at least one technical regulation NTM in one importing country. By contrast, for a number of manufactured products, the share of HS6 lines impacted by a technical regulation NTM is lower to much lower. A strong exception is Pharmaceutical products (HS30) (frequency ratio of 37.9%). Interestingly, sectors included in Textiles and apparel (section XI) and Footwear and headgear (section XII) for which the competition between Northern and Southern countries has been historically contentious, are not subject to many standard-like NTMs.
To sum up, our results suggest the presence of both trade reducing and facilitating technical regulation NTMs, with substantial trade effects. Next, these AVEs of technical regulation NTMs are further used to calculate the TRI and MTRI.
Figure 2. Scattered plot of HS6 level NTM AVES averaged over countries and shown by HS2 line ‐0.6 ‐0.4 ‐0.2 0.0 0.2 0.4 0.6 0.8 1.0 0 2 4 6 8 10 12 14 16 18 20 22 24 26 28 30 32 34 36 38 40 42 44 46 48 50 52 54 56 58 60 62 64 66 68 70 72 74 76 78 80 82 84 86 88 90 92 94 96 HS2 line NT M AV E pe r HS 6 li n e re p o rt e d by HS 2 li n e HS6 NTM AVE averaged over countries
Figure 3. Mean and median (by HS2) of HS6 NTM AVEs average ‐0.2 0.0 0.2 0.4 0.6 0.8 0 2 4 6 8 10 12 14 16 18 20 22 24 26 28 30 32 34 36 38 40 42 44 46 48 50 52 54 56 58 60 62 64 66 68 70 72 74 76 78 80 82 84 86 88 90 92 94 96 HS2 line NT M AV E av e ra ge pe r HS 6 li n e sh o w n by HS 2 lin e Average of HS6 averages by HS2 line (unconstrained) Average of HS6 averages by HS2 line (constrained) Li ve ani m al s, ani m al pr o duc ts Ve ge ta b le pr oduc ts An im al ss an d veg et ab le fa ts Pr e p ar ed f oods , be ve rag es , sp ir it s, t o b a cco Mi n e ra l pr odu ct s Ch em ic al , ph ar m a ce ut ic al s, co sm et ic s Ru bb er an d p last ic s Hi d e and le at h e r Wo o d pr o duc ts W ood pu lp , pa pe r, pri n te d Te xt ile s, appa re l and c lot hi ng Foot w ea r, he a d ge ar St o n e , cem en t, ce ra m ic, gl as s P ea rls Ba se me ta ls an d ar ti cl es of ba se me ta l Ma ch in er y, e lec tr ic al e qui pm en t Ve h ic le s, ai rc raft , v ess el s, tr an sp o rt Op ti ca l, p h ot og ra p h ic , p re cis io n in st r. A rm s Mi sc e llane o u s
4.2. Trade restrictiveness indices
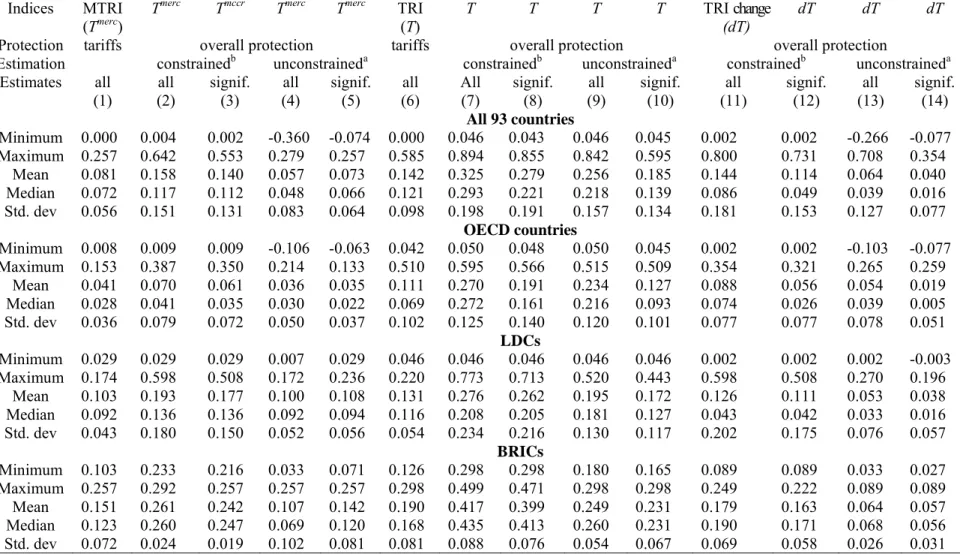
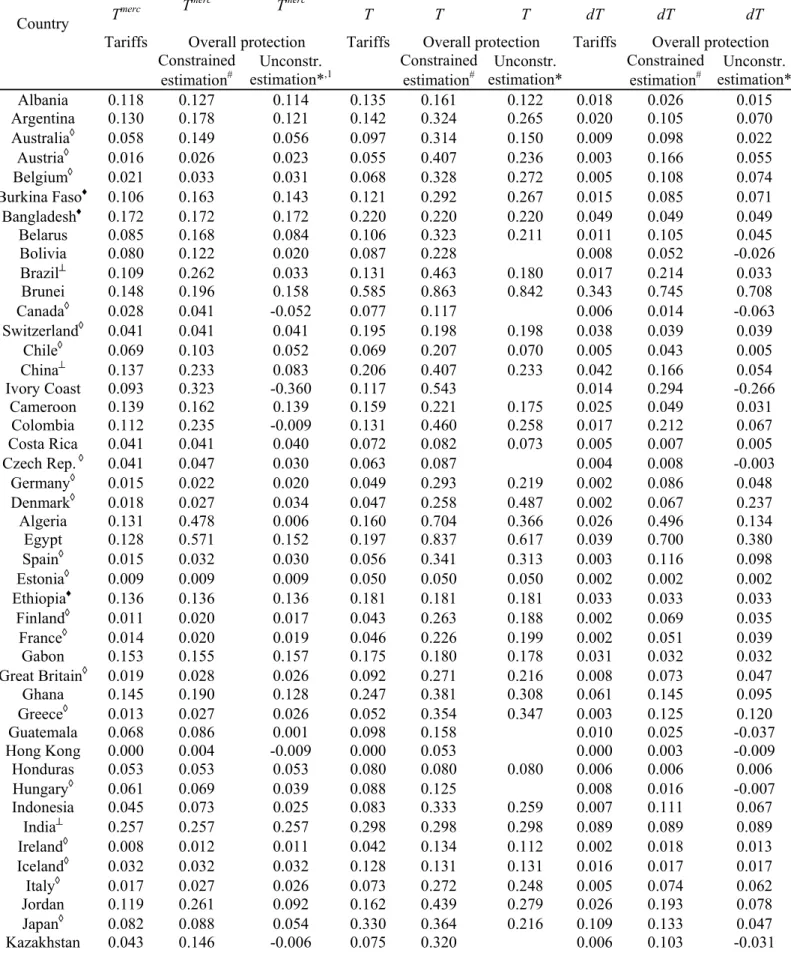
Table 3 reports summary figures of the results for country-level MTRIs, TRIs and changes in TRIs. Three calculations are performed based on (i) tariffs only, (ii) overall protection using AVEs from the constrained estimation, and (iii) overall protection using unconstrained AVEs. The latter two sets of measures are also summarized for all AVE estimates and for the subset of significant AVE estimates based on the bootstrap standard errors. The summary statistics are presented for all 93 countries, OECD countries, Least Developed Countries (LDCs), and then BRIC (Brazil, Russia, India and China) countries.
The tariff only MTRI and TRI (1st and 6th columns in Table 3) represent the uniform tariff
that would provide the same level of imports (MTRI) and welfare (TRI) as the initial tariff structure. OECD countries where in most cases except Japan and South Korea tariffs have been significantly reduced, exhibit smaller tariff-MTRIs than the 93-country averages, LDCs’ and especially the BRICs’ averages. According to detailed country results reported in Table A.3 of the Appendix, India has the highest tariff-MTRI (0.257) among the 93 countries; Brunei and South Korea have the highest tariff-TRI at or above 0.5. Hong-Kong and Singapore have zero tariff indices as they do not impose border tariffs.
Columns (2) and (7) show the MTRI and TRI estimates including all distortions based on the AVEs from the estimation constraining NTMs to be trade reducing. As expected, MTRIs and TRIs exhibit larger values in columns (2) and (7) than those obtained using AVEs from the unconstrained estimation (see columns (4) and (9)). For example for the 93-country summary, the median and mean values of the MTRIs are respectively 0.117 and 0.158 with constrained estimates and only 0.048 and 0.057 with unconstrained estimates. Similarly, for the TRI the median and mean values are 0.293 and 0.325 (constrained estimation) versus 0.218 and 0.256 (unconstrained estimation). In other words, for all countries included in our sample, the MTRIs based on overall protection (tariffs, production subsidies, and NTMs) and allowing for negative AVEs are equal or smaller than the MTRIs based on overall protection computed with the
constrained AVEs. This last result suggests that some technical regulation NTM regimes have trade facilitating effects for most countries. Finally, regardless of the estimation method, when comparing results using all AVE estimates or only the significant ones based on the bootstrap standard errors, one notes with the latter that ranges are reduced for most indices and Country groupings.
Countries’ groupings also highlight interesting patterns. The OECD group exhibits negative MTRI values with a small mean (0.036). The LDC group shows all positive MTRIs. We also note that intuitively, many countries with low tariff-MTRIs exhibit negative total MTRIs because small tariffs do not counterbalance negative NTM AVEs. Lastly, using more disaggregated results by country (see Table A.3 of the Appendix), we note that only 28 over 93 countries have MTRI values for overall protection and based on unconstrained estimates are higher than the values based on tariffs only. In addition, as suggested by Figure 4, MTRI for tariffs only and MTRIs for all distortions show a strong downward pattern when income per capita increases. From Figure 4 it is clear that MRTIs inclusive of all distortions tend to be lower than the MTRI for tariffs only, strongly suggesting that standard-like NTMs facilitate can trade.
The analysis of the TRIs shows 24 countries with total TRIs based on unconstrained estimates smaller than the tariff-only TRI. These results show that positing protectionism of technical measure NTMs strongly biases the evaluation of the restrictiveness of these NTM trade policies. As previously mentioned, if equation (4) provides a negative dT (cf. supra), then the TRI level T cannot be computed using (5). The last columns of Tables 3 report the change in TRI, dT, i.e., the change in the index equivalent to the welfare impact of the policy interventions. Country-level results indicate that for 17 over 93 countries, the change in TRI is negative (Table A.3 of the Appendix). Furthermore, for 25 over 93 countries, change in TRI values are smaller than the ones obtained when tariffs only are included in the computation (column (7) of Table A.3). These two last results highlight that some technical regulation NTMs can have positive welfare effects. Not surprisingly, many OECD countries exhibit negative dTRIs. This result is consistent with Disdier
et al. (2008)’s results showing intra-OECD agri-food trade being enhanced by NTM regimes. Several LDC countries also exhibit negative dTRIs and these can be rationalized by opportunities created with the agri-food trade integration and policy reforms. We have in mind the integration of LDCs in European trade following a sequence of structural adjustment policies that removed many protectionist NTMs, expanded preferential trade agreements and attempted to upgrade quality of goods. The latter induced upgrades of SPS regulations and improved food safety in countries like Côte d’Ivoire among others (FAO, 2003; Colen et al., 2012; and Maertens et al., 2012).
Table 3. Trade restrictiveness indices, summary statistics
Indices MTRI (Tmerc) T
merc
Tmccr Tmerc Tmerc TRI
(T) T T T T TRI change(dT) dT dT dT
Protection tariffs overall protection tariffs overall protection overall protection
Estimation constrainedb unconstraineda constrainedb unconstraineda constrainedb unconstraineda
Estimates all all signif. all signif. all All signif. all signif. all signif. all signif. (1) (2) (3) (4) (5) (6) (7) (8) (9) (10) (11) (12) (13) (14) All 93 countries Minimum 0.000 0.004 0.002 -0.360 -0.074 0.000 0.046 0.043 0.046 0.045 0.002 0.002 -0.266 -0.077 Maximum 0.257 0.642 0.553 0.279 0.257 0.585 0.894 0.855 0.842 0.595 0.800 0.731 0.708 0.354 Mean 0.081 0.158 0.140 0.057 0.073 0.142 0.325 0.279 0.256 0.185 0.144 0.114 0.064 0.040 Median 0.072 0.117 0.112 0.048 0.066 0.121 0.293 0.221 0.218 0.139 0.086 0.049 0.039 0.016 Std. dev 0.056 0.151 0.131 0.083 0.064 0.098 0.198 0.191 0.157 0.134 0.181 0.153 0.127 0.077 OECD countries Minimum 0.008 0.009 0.009 -0.106 -0.063 0.042 0.050 0.048 0.050 0.045 0.002 0.002 -0.103 -0.077 Maximum 0.153 0.387 0.350 0.214 0.133 0.510 0.595 0.566 0.515 0.509 0.354 0.321 0.265 0.259 Mean 0.041 0.070 0.061 0.036 0.035 0.111 0.270 0.191 0.234 0.127 0.088 0.056 0.054 0.019 Median 0.028 0.041 0.035 0.030 0.022 0.069 0.272 0.161 0.216 0.093 0.074 0.026 0.039 0.005 Std. dev 0.036 0.079 0.072 0.050 0.037 0.102 0.125 0.140 0.120 0.101 0.077 0.077 0.078 0.051 LDCs Minimum 0.029 0.029 0.029 0.007 0.029 0.046 0.046 0.046 0.046 0.046 0.002 0.002 0.002 -0.003 Maximum 0.174 0.598 0.508 0.172 0.236 0.220 0.773 0.713 0.520 0.443 0.598 0.508 0.270 0.196 Mean 0.103 0.193 0.177 0.100 0.108 0.131 0.276 0.262 0.195 0.172 0.126 0.111 0.053 0.038 Median 0.092 0.136 0.136 0.092 0.094 0.116 0.208 0.205 0.181 0.127 0.043 0.042 0.033 0.016 Std. dev 0.043 0.180 0.150 0.052 0.056 0.054 0.234 0.216 0.130 0.117 0.202 0.175 0.076 0.057 BRICs Minimum 0.103 0.233 0.216 0.033 0.071 0.126 0.298 0.298 0.180 0.165 0.089 0.089 0.033 0.027 Maximum 0.257 0.292 0.257 0.257 0.257 0.298 0.499 0.471 0.298 0.298 0.249 0.222 0.089 0.089 Mean 0.151 0.261 0.242 0.107 0.142 0.190 0.417 0.399 0.249 0.231 0.179 0.163 0.064 0.057 Median 0.123 0.260 0.247 0.069 0.120 0.168 0.435 0.413 0.260 0.231 0.190 0.171 0.068 0.056 Std. dev 0.072 0.024 0.019 0.102 0.081 0.081 0.088 0.076 0.054 0.067 0.069 0.058 0.026 0.031
a: Unconstrained estimation means that impact of NTMs on trade is not restricted in the econometric estimation. b: Constrained estimation means that NTMs are constrained to have a non positive impact on trade in the estimation. OECD: all OECD members included in our sample. BRICs: Brazil, Russia, India and China. LDCs: Burkina Faso, Bangladesh, Ethiopia, Madagascar, Mali, Malawi, Rwanda, Sudan, Senegal, Uganda, Zambia.
5. Conclusion
We extend the TRI approach to a small distorted open economy to account for market imperfections (externalities, asymmetric information) and NTM domestic regulations addressing them. Up to date, the presence of externalities and potential anti-protectionist effects of standard-like
NTMs has been ignored in TRI application. Allowing for such occurrence, we derive the AVEs of NTMs, as well as the TRIs and MTRIs equivalent to all policy interventions (tariffs, NTMs and production subsidies). We show that in general the impact of NTMs on import demand is ambiguous depending on the relative strength of the import-facilitating effects of NTMs via a shift in import demand, and the protective effect of the same NTMs at the border. We then apply the approach to the UNCTAD-Comtrade database built by Kee et al. (2009). In our sample, 12% of HS6 lines are affected by technical regulation NTMs and about 39% of these (4.7% of all HS6 lines) show negative AVEs of technical regulation NTMs. The MTRI and TRI results show the sizeable changes in estimated aggregate trade and welfare effects of existing trade policies. Policy recommendations on the impacts of NTMs will be biased by overstating their trade reducing and welfare decreasing effects.
Although we show it is possible to rationalize and econometrically identify trade- facilitating effects of NTMs mitigating external effects and other market imperfections or having anti-protectionist effects on domestic suppliers, we do so using relatively simple NTM proxies and aggregate trade flows rather than bilateral ones. It would be interesting to refine these results and use more detailed NTM measures and bilateral trade data, and focus on a subset of sectors for which we identify negative NTM AVEs. Nevertheless our results corroborate the trade-facilitating effects found in the literature for some products and countries (e.g. Disdier et al., 2008; Moenius, 2004). The value added of our analysis is to formalize the possibility of anti-protectionist effects or external effects and their mitigation through regulations affecting quality of products and identify their effects on trade restrictiveness. Our analysis also extends the
applicability of the TRI framework to more plausible market conditions and lets the data reveal unconstrained patterns.
References
Anderson, J.E., G.J. Bannister, and P. Neary, 1995. “Domestic Distortions and International Trade,” International Economic Review 36(1): 139-157.
Anderson, J. and P. Neary, 1992. “Trade reforms with quotas, partial rent retention and tariffs,”
Econometrica 60(1): 57-76.
Anderson, J. and P. Neary, 1994. “Measuring the restrictiveness of trade policy,” World Bank
Economic Review 8(2): 151-169.
Anderson, J. and P. Neary, 1996. “A new approach to evaluating trade policy,” Review of
Economic Studies 63(1): 107-125.
Anderson, J. and P. Neary, 2003. “The mercantilist index of trade policy,” International
Economic Review 44(2): 627-649.
Anderson, J. and P. Neary, 2005. Measuring the Restrictiveness of Trade Policy, Boston: MIT Press.
Beghin, J.C., J.C. Bureau, and S.J. Park, 2003. “Food Security and Agricultural Protection in South Korea,” American Journal of Agricultural Economics 85(3): 618-632.
Beghin, J.C., D. Roland-Holst, and D. van der Mensbrugghe, 1997. “Trade and Environment Linkages. Piecemeal Reform and Optimal Intervention,” Canadian Journal of Economics 30(2): 442-455.
Blind, K., A. Mangelsdorf, and J.S. Wilson, 2013. “Mutual Recognition of Accreditation: Does it Matter to Trade? Evidence from the Food, Beverage, and Tobacco Industry,” chapter 12 in J.C. Beghin (ed.) Nontariff Measures with Market Imperfections: Trade and Welfare
Implications (Frontiers of Economics and Globalization, Volume 12), Emerald Group
Bratt, M., 2012. “Estimating the Bilateral Impact of NTMs,” Manuscript, University of Geneva.
Breaux, M., Y. Cabral, M.J. Ferrantino, and J.E. Signoret, 2013, “Quality-Adjusted Handicraft Estimates of NTM Price Gaps,” Manuscript, U.S. International Trade Commission.
Cadot, O. and J. Gourdon, 2012. “Assessing the price-raising effect of non-tariff measures in Africa,” Working Paper 2012-16, CEPII, Paris.
Carrère, C. and J. de Melo, 2011. “Notes on Detecting the Effects of Non-Tariff Measures,”
Journal of Economic Integration 26(1): 136-168.
Chau, N.H., R. Färe, and S. Grosskopf, 2007. “Trade Restrictiveness and Pollution,” WP 2007-15, Department of Applied Economics and Management, Cornell University, Ithaca, New York.
Colen, L., M. Maertens, and J. Swinnen, 2012. “Private Standards, Trade and Poverty: GlobalGAP and Horticultural Employment in Senegal,” The World Economy 35(8): 1073-1088.
Copeland, B.R., 1994. “International Trade and the Environment: Policy Reform in a Polluted Small Open Economy,” Journal of Environmental Economics and Management 26(1): 44-65. CPSC, U.S. Consumer Product Safety Commission, 2008. “Import Safety Strategy,” Manuscript,
Washington D.C.
Disdier, A.-C., L. Fontagné, and M. Mimouni, 2008. “The Impact of Regulations on Agricultural Trade: Evidence from the SPS and TBT Agreements,” American Journal of Agricultural
Economics 90(2): 336-350.
Disdier, A-C., and S. Marette, 2010. “The Combination of Gravity and Welfare Approaches for Evaluating Non-Tariff Measures,” American Journal of Agricultural Economics 92(3): 713-726.
FAO, 2003. WTO Agreement on Agriculture: The Implementation Experience - Developing
Country Case Studies. Commodity Policy and Projections Service Commodities and Trade