HAL Id: hal-02946537
https://hal.archives-ouvertes.fr/hal-02946537
Submitted on 8 Oct 2020
HAL is a multi-disciplinary open access
archive for the deposit and dissemination of
sci-entific research documents, whether they are
pub-lished or not. The documents may come from
teaching and research institutions in France or
abroad, or from public or private research centers.
L’archive ouverte pluridisciplinaire HAL, est
destinée au dépôt et à la diffusion de documents
scientifiques de niveau recherche, publiés ou non,
émanant des établissements d’enseignement et de
recherche français ou étrangers, des laboratoires
publics ou privés.
The carbon budget of terrestrial ecosystems in East Asia
over the last two decades
S. Piao, A. Ito, S. Li, Y. Huang, P. Ciais, X. Wang, S. Peng, H. Nan, C. Zhao,
A. Ahlström, et al.
To cite this version:
S. Piao, A. Ito, S. Li, Y. Huang, P. Ciais, et al.. The carbon budget of terrestrial ecosystems in East
Asia over the last two decades. Biogeosciences, European Geosciences Union, 2012, 9 (9),
pp.3571-3586. �10.5194/BG-9-3571-2012�. �hal-02946537�
Biogeosciences, 9, 3571–3586, 2012 www.biogeosciences.net/9/3571/2012/ doi:10.5194/bg-9-3571-2012
© Author(s) 2012. CC Attribution 3.0 License.
Biogeosciences
The carbon budget of terrestrial ecosystems in East Asia over the
last two decades
S. L. Piao1,2, A. Ito3, S. G. Li4, Y. Huang5, P. Ciais6, X. H. Wang1, S. S. Peng1, H. J. Nan1, C. Zhao1, A. Ahlstr¨om7, R. J. Andres8, F. Chevallier6, J. Y. Fang1,5, J. Hartmann9, C. Huntingford10, S. Jeong11, S. Levis12, P. E. Levy13, J. S. Li14, M. R. Lomas15, J. F. Mao8, E. Mayorga16, A. Mohammat17, H. Muraoka18, C. H. Peng19,20, P. Peylin6, B. Poulter6, Z. H. Shen1, X. Shi8, S. Sitch21, S. Tao1, H. Q. Tian22, X. P. Wu14, M. Xu4, G. R. Yu4, N. Viovy6, S. Zaehle23, N. Zeng24, and B. Zhu25
1Sino-French Institute for Earth System Science, College of Urban and Environmental Sciences, Peking University,
Beijing 100871, China
2Institute of Tibetan Plateau Research, Chinese Academy of Sciences, Beijing 100085, China
3Center for Global Environmental Research, National Institute for Environmental Studies, Tsukuba, Ibaraki 305-8506, Japan 4Institute of Geographic Science and Natural Resources Research, Chinese Academy of Sciences, Beijing 100101, China 5Institute of Botany, Chinese Academy of Sciences, Xiangshan, Beijing 100093, China
6Laboratoire des Sciences du Climat et de l’Environnement, CEA CNRS UVSQ, 91191 Gif sur Yvette, France 7Department of Earth and Ecosystem Sciences, Lund University, S¨olvegatan 12, 223 62 Lund, Sweden 8Environmental Sciences Division, Oak Ridge National Laboratory, Oak Ridge, TN 37831-6290, USA 9Institute for Biogeochemistry and Marine Chemistry, Klimacampus, Universit¨at Hamburg, Bundesstrasse 55,
20146 Hamburg, Germany
10Centre for Ecology and Hydrology, Benson Lane, Wallingford OX10 8BB, UK 11Department of Geosciences, Princeton University, Princeton, NJ, USA
12National Center for Atmospheric Research, Boulder, Colorado, USA
13Centre for Ecology and Hydrology, Bush Estate, Penicuik, Midlothian EH26 0QB, UK 14Chinese Research Academy of Environmental Sciences, Beijing 100012, China
15Department of Animal & Plant Sciences, University of Sheffield, Sheffield S10 2TN, UK 16Applied Physics Laboratory, University of Washington, Seattle, WA, USA
17Xinjiang institute of ecology and geography, Chinese Academy of Sciences, Urumqi 830011, China 18River Basin Research Center, Gifu University, Gifu 501-1193, Japan
19Laboratory for Ecological Forecasting and Global Change, College of Forestry, Northwest A & F University, Yangling,
Shaanxi 712100, China
20Department of Biology Sciences, Institute of Environment Sciences, University of Quebec, Montreal, Canada 21School of Geography, University of Exeter, Exeter EX4 4QF, UK
22Ecosystem Dynamics and Global Ecology Laboratory, School of Forestry and Wildlife Sciences, Auburn University,
Auburn 36849, USA
23Max Planck Institute for Biogeochemistry, P.O. Box 10 01 64, 07701 Jena, Germany
24Department of Atmospheric and Oceanic Science, University of Maryland, College Park, MD 20740, USA 25Department of Horticulture, Cornell University, Ithaca, NY 14853, USA
Correspondence to: S. L. Piao (slpiao@pku.edu.cn)
Received: 27 February 2012 – Published in Biogeosciences Discuss.: 29 March 2012 Revised: 6 August 2012 – Accepted: 15 August 2012 – Published: 7 September 2012
3572 S. L. Piao et al.: The carbon budget of East Asia Abstract. This REgional Carbon Cycle Assessment and
Pro-cesses regional study provides a synthesis of the carbon bal-ance of terrestrial ecosystems in East Asia, a region com-prised of China, Japan, North and South Korea, and Mon-golia. We estimate the current terrestrial carbon balance of East Asia and its driving mechanisms during 1990–2009 us-ing three different approaches: inventories combined with satellite greenness measurements, terrestrial ecosystem car-bon cycle models and atmospheric inversion models. The magnitudes of East Asia’s terrestrial carbon sink from these three approaches are comparable: −0.293 ± 0.033 PgC yr−1 from inventory–remote sensing model–data fusion approach,
−0.413±0.141 PgC yr−1(not considering biofuel emissions) or −0.224 ± 0.141 PgC yr−1(considering biofuel emissions) for carbon cycle models, and −0.270 ± 0.507 PgC yr−1 for atmospheric inverse models. Here and in the following, the numbers behind ± signs are standard deviations. The ensem-ble of ecosystem modeling based analyses further suggests that at the regional scale, climate change and rising atmo-spheric CO2together resulted in a carbon sink of −0.289 ±
0.135 PgC yr−1, while land-use change and nitrogen depo-sition had a contribution of −0.013 ± 0.029 PgC yr−1 and
−0.107 ± 0.025 PgC yr−1, respectively. Although the mag-nitude of climate change effects on the carbon balance varies among different models, all models agree that in response to climate change alone, southern China experienced an in-crease in carbon storage from 1990 to 2009, while north-ern East Asia including Mongolia and north China showed a decrease in carbon storage. Overall, our results suggest that about 13–27 % of East Asia’s CO2emissions from fossil fuel
burning have been offset by carbon accumulation in its ter-restrial territory over the period from 1990 to 2009. The un-derlying mechanisms of carbon sink over East Asia still re-main largely uncertain, given the diversity and intensity of land management processes, and the regional conjunction of many drivers such as nutrient deposition, climate, atmo-spheric pollution and CO2changes, which cannot be
consid-ered as independent for their effects on carbon storage.
1 Introduction
Quantifying the ability of regional terrestrial ecosystems to remove anthropogenic CO2emissions brings understanding
of the global carbon cycle and provides options for policy (Gurney et al., 2009). The East Asia region in RECCAP (Canadell et al., 2011) includes China, Japan, North and South Korea, and Mongolia, located on the East Eurasian continent in the Northern Hemisphere. This region covers a land area of 12 × 106km2and a range of 49 degrees lat-itude and 72 degrees longlat-itude amounting to 28 % of the Asian continent land area. The population of East Asia has increased by 40.46 million (China, Japan and South Korea contribute 92.8 %, 2.5 % and 2.7 % of this total increase,
re-spectively) since 1980 (UN, 2009). East Asia has also been characterized by rapid economic development and fast GDP increase. According to data from World Bank, China alone accounted for approximately 11 % of the increase in total global GDP from 1980 to 2009, and Japan contributed an-other 8.6 % (World Bank, 2009). Fossil fuel emissions of CO2 in East Asia are rising significantly with GDP, with
moderate gains in the carbon intensity (ratio of emissions-to-GDP) (Raupach et al., 2007). Based on the recent IEA statis-tics of CO2 emissions from fuel combustion (International
Energy Agency, 2011), East Asian fossil fuel CO2emissions
observably increased by a factor of two between 1990 and 2009, becoming an average source of 1.5 Pg C yr−1to the at-mosphere from 1990 to 2009 (Fig. 1). This regional emission represents a fraction of about 23 % of global fossil fuel CO2
emissions during the same period, and this fraction increased from 18 % in 1990 to 30 % in 2009 (International Energy Agency, 2011). Such a rapid increase in fossil fuel emissions is the first important motivation for studying the carbon bal-ance over East Asia.
The second important motivation for studying the carbon balance over East Asia is the rapid land-use change going on in this region. For example, fast urbanization has oc-curred in East Asia since the 1990s. The World Urbanization Prospects (2009) shows that the percentage of urban popu-lation (the ratio of the urban popupopu-lation to the total popula-tion of a given region) in East Asia increased from 32 % in 1990 to 50 % in 2010 (UN, 2009; Sun et al., 2010a), and is still growing. In 2025, Tokyo, Japan, is likely to become the largest city in the world, with its population approaching 37.1 million. Shanghai, China, is projected to be the 9th largest city, with a population of 15 million (UN, 2009). Besides ur-banization trends, East Asia also experienced large afforesta-tion over the last three decades. Based on the latest report by FAO (Food and Agriculture Organization of the United Na-tions) on Global Forest Resources Assessment (FAO, 2010), the annual change in forest area of East Asia increased from 1.76 × 10⁶ha in 1990–2000 to 2.78 × 10⁶ha in 2000–2010. It is worth noting that East Asia has higher yearly growth in forest area over 2000–2010 (1.2 % per year) than any other country or region (FAO, 2010). Such afforestation mainly oc-curs in China, whereas Japan and Korea are already highly forested countries (68 % and 65 % forest cover in the early 1990s, respectively) (FAO, 2010). The Chinese government has developed several large-scale forest plantation programs (e.g. Three-North Protective Forest Program, Taihang Moun-tains Greening Project, South China Timber Program, the Pearl River Protective Forest Project, and the Yangtze River Protective Forest Project) since the late 1970s (Shen, 1999), leading to an increase of forest area at 1.6 % yr−1 over the last two decades. The annual increasing rate of Chinese forest area increased from 1.99×10⁶ha per year during 1990–2000 to 2.99 × 10⁶ha per year during 2000–2010 (FAO, 2010). In Japan, forestation programs were developed after World War II for providing timbers construction materials. Because
S. L. Piao et al.: The carbon budget of East Asia 3573
of drastic shifts in life style and industrial structure, these young forests are harvested for less than their annual wood increment, resulting in carbon sequestration mainly in woody biomass (Fang et al., 2005).
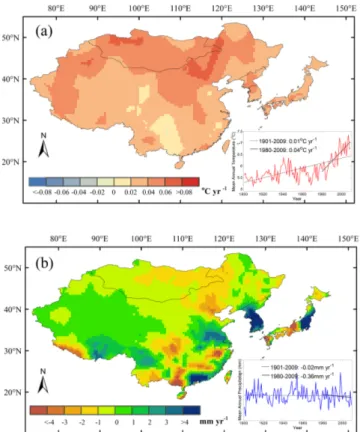
The third important motivation for studying the carbon balance over East Asia concerns regional climate trends. As a sensitive region of the climate system (Fu et al., 2004; Piao et al., 2010), East Asia experienced significant climate changes in the past decades. According to CRU (Climate Research Unit) climate data (Mitchell and Jones, 2005), mean annual temperature over East Asia has increased by 0.04◦C yr−1 over the last three decades, a higher rate than the observed global land surface temperature trend (0.03◦C yr−1)(Fig. 2). Associated with this warming, significant changes in pre-cipitation patterns are observed (Fig. 2). The drier northern China (except the northwest part) has been receiving less pre-cipitation in summer and autumn, whereas the wetter south-ern China has seen more rainfall during summer and winter (Piao et al., 2010).
The fourth important motivation for studying the carbon balance over East Asia is the rapid change in atmospheric composition caused by industrial and agricultural emissions from this region. The concentration of reactive nitrogen de-position has doubled worldwide and is five times higher than the 1860 level in East Asia as a result of intensive fertilizer use and fossil fuel burning (Galloway et al., 2004; Churkina et al., 2007). For instance, dry deposition of NO2 in China
rose by about 8 % from 1990 to 2003 (Lu and Tian, 2007). Apart from nitrogen deposition, tropospheric ozone pol-lution also characterizes atmospheric composition changes over East Asia. Because East Asia, particularly China, is on the road of rapid economic development, the emissions of ozone precursors that were still at low concentrations in the 1970s dramatically increased in the past decade (Richter et al., 2005) and are larger than North American and European emissions (Akimoto, 2003). Some Chinese regions such as the North China Plain, the Yangtze River Delta and the Pearl River Delta are significantly affected by ozone pollution (Du-four et al., 2010). At the end of the last century, tropospheric ozone concentrations in these areas had reached a high level, higher than any other areas of the northern mid-latitudes (Oltmans et al., 1998; Lee et al., 1998), and are projected to further increase in the future (Akimoto, 2003).
There is no doubt that the changes in regional economic and climatic drivers of ecosystem CO2 fluxes mentioned
above affect the carbon balance of East Asia. In compari-son to other regions such as Europe (Janssens et al., 2003; Ciais et al., 2010) and North America (Pacala et al., 2001; Crevoisier et al., 2010), our knowledge on the carbon budget of terrestrial territory in East Asia remains rather limited be-cause most studies focused mainly on national C budget esti-mates (Piao et al., 2010; Ichii et al., 2010; Tian et al., 2011). Recently, Piao et al. (2011a) used three different terrestrial carbon cycle models to estimate changes in the carbon bal-ance of East Asian ecosystems over the last century, but that
Figure 1 1990 1995 2000 2005 2010 0.5 1 1.5 2 2.5 3 FF C O2 em is si on ( P gC y r
-1) East Asia FF CO2 emission
16 20 24 28 32 per cent (% ) of gl obal F F CO 2 e m is sio n
East Asian vs Global
Fig. 1. Change in fossil fuel CO2 emissions (FF CO2 emission)
over East Asia and its relative contribution to global fossil fuel CO2
emissions, from 1990 to 2007. Data acquired from IEA statistics.
Grey area shows 1-sigma standard error of the fossil fuel CO2
emis-sion estimates.
study only considered climate and rising atmospheric CO2
forcing. The primary objective of this paper is to quantify the C balance of East Asia’s terrestrial ecosystems over the last two decades as well as its drivers and uncertainties. To do so, we use three different approaches: a bottom-up ap-proach derived from biomass and soil carbon inventory data and combined with satellite observations of vegetation green-ness (NDVI: Normalized Difference Vegetation Index), ter-restrial ecosystem carbon cycle models, and a top-down ap-proach based on atmospheric CO2observation data and
in-version of atmospheric transport.
2 Methods
2.1 Inventory- and satellite-based estimation
East Asia contains almost all major forest types of the Northern Hemisphere including tropical rain forest, sub-tropical evergreen broadleaf forest, deciduous broadleaf for-est, broadleaf and needleleaf mixed forest and deciduous needleleaf forest from south to north. According to the lat-est report by FAO on Global Forlat-est Resources Assessment (FAO, 2010), the total forest area of East Asia is about 2.54 × 10⁸ha in 2010, accounting for about 6 % of global total forest area. In this study, forest biomass carbon sink is assessed based on FAO reports (FAO, 2010) and previ-ous published estimates. We only selected literature data that used national forest inventories to calculate forest biomass change. The relatively systematic and spatially extensive for-est inventory data provide one of the key sources for for- esti-mating the basic elements of forest C stock and stock change at the country scale, although there are large uncertainties associated with allometry, non-measured soil C pools, and sampling of disturbed forests (Phillips et al., 2000; Pan et al., 2004, 2011).
Grassland is a widespread vegetation type in East Asia. Temperate grasslands are distributed in arid and semi-arid
3574 S. L. Piao et al.: The carbon budget of East Asia
Figure 2
Fig. 2. Climate change in East Asia. (a) Spatial pattern of trend in
mean annual temperature (MAT) from 1970 to 2009. (b) Spatial pattern of trend in mean annual precipitation (MAP) from 1970 to 2009. Inset figures show interannual variability of MAT and MAP averaged over the whole region.
regions, while cold alpine grasslands are spread mainly over the Tibetan Plateau and some high elevation mountainous area. Here, we estimate grassland biomass change using satellite NDVI observations and the empirical approach de-veloped by Piao et al. (2007) (see Supplement Text S1). The NDVI data used are from the Global Inventory Monitoring and Modeling Studies (GIMMS) group derived from the Na-tional Oceanic and Atmospheric Administration’s Advanced Very High Resolution Radiometer (NOAA/AVHRR) land dataset at a spatial resolution of 8 × 8 km and a 15-day inter-val for the period January 1982 to December 2009 (Tucker et al., 2005; Wang et al., 2011). Information on the fractional coverage of grassland in China was derived from the Map of Grassland Resources in China at 1 : 4 000 000 scale (Com-mission for Integrated Survey of Natural Resources, 1996), and information in other regions is from the UMD Global Land Cover Classification at 8 × 8 km resolution (DeFries et al., 1998).
Shrublands in East Asia are mainly distributed in China (DeFries et al., 1998), with an area approximating 2.1 × 10⁷ha (Commission for Integrated Survey of Natural Re-sources, 1996) mainly dispersed over mountainous areas, in particular in southwestern, southern and northeastern China.
Similar to the estimation of grassland biomass change, a satellite-based empirical approach (Piao et al., 2009a) was applied to estimate biomass change for shrubland in East Asia (Supplement Text S1).
Carbon accumulated in wood products must be con-sidered in the estimation of the regional carbon balance (Ciais et al., 2008). In Europe, wood products represent a C sink of −0.024 Pg C yr−1 (Ciais et al., 2008). Based on FAO data (http://www.fao.org/waicent/portal/statistics en.asp), the wood products in East Asia are about 43 % than those in Europe. As distinguishing long-lived and short-lived wood products requires detailed wood product statistics in categories which are not accessible for all East Asian coun-tries, we apply the ratio of wood production to carbon storage change in wood products estimated in Europe (Kohlmaier et al., 2007; Ciais et al., 2008) to estimate the C sink of wood products in East Asia.
Soils are the largest source of uncertainty in the terrestrial ecosystem carbon balance at regional and country scales, as data are lacking from repeated inventories (Huang et al., 2010). Here, change in soil carbon storage of natural ecosystems (forest, shrubland, and grassland) in East Asia is estimated using biomass change estimated for each biome as specified above, and the ratio of soil-to-biomass carbon storage change in China reported in previous studies (Piao et al., 2009a; Tian et al., 2011). For cropland, soil organic car-bon (SOC) changes and uncertainties are provided through a synthesis of literature data (Huang et al., 2010).
It has been suggested that riverine export of dissolved in-organic and in-organic carbon (DIC and DOC) and particu-late organic carbon (POC) makes a considerable contribu-tion to the budget of carbon stock (Ciais et al., 2008; Cai et al., 2008). The lateral transport of carbon to the coast was estimated at the river basin scale using the Global Nu-trient Export from WaterSheds (NEWS) model framework (Mayorga et al., 2010), including NEWS basin areas. The carbon species models are hybrid empirically and concep-tually based models that include single and multiple lin-ear regressions developed by the NEWS effort and Hart-mann et al. (2009), and single regression relationships as-sembled from the literature. Modeled dissolved and particu-late organic carbon (DOC and POC) loads used here (from Mayorga et al., 2010) were generated largely using drivers corresponding to the year 2000, including observed hydro-climatological forcings, though some parameters and the ob-served loads are based on data spanning the previous two decades. The amounts of riverine DIC export are provided by Hartmann et al. (2009). Carbon, sediment and water ex-ports were aggregated from the river basin scale to coastal segmentation regions (COSCAT, Meybeck et al., 2006).
2.2 Ecosystem models
Process-based terrestrial ecosystem models have been ap-plied to assess the dynamics of the terrestrial carbon cycle
S. L. Piao et al.: The carbon budget of East Asia 3575
(Morales et al., 2005). Ecosystem model results, however, generally depend to an unknown extent on model param-eter values (Mitchell et al., 2009), climate and soil forc-ing data (Zhao et al., 2012), initial conditions (Carvalhais et al., 2008), and on model structure (Lin et al., 2011), al-though data assimilation techniques are developing and may enable us to determine optimal parameter values in an ob-jective manner (Santaren et al., 2007). Accordingly, analyses with an ensemble of independent models are preferable to assess the uncertainties due to model structure and param-eter choices (Friedlingstein et al., 2006; Sitch et al., 2008). In this study, we estimated the carbon balance of terres-trial ecosystems in East Asia using 10 ecosystem models: HyLand (Levy et al., 2004), Lund–Potsdam–Jena DGVM (Sitch et al., 2003), ORCHIDEE (Krinner et al., 2005), Sheffield–DGVM (Woodward et al., 1995; Woodward and Lomas, 2004), TRIFFID (Cox, 2001), LPJ-GUESS (Smith et al., 2001), NCAR-CLM4CN (Oleson et al., 2010; Lawrence et al., 2011), OCN (Zaehle and Friend, 2010), VEGAS (Zeng, 2003; Zeng et al., 2005), and VISIT (Ito, 2008). De-tailed descriptions of the surface fluxes of CO2, water and the
dynamics of water and carbon pools in response to environ-mental change in each model can be found in the correspond-ing literature. Previous studies (e.g. Tao and Zhang, 2010; Tan et al., 2010) have applied some of these models in esti-mating vegetation and carbon dynamics over different parts of East Asia.
Following the historical climate–carbon cycle model in-tercomparison project (Trendy) protocol (http://dgvm.ceh.ac. uk/system/files/Trendy protocol%20 Nov2011 0.pdf), each model was run from its equilibrium (assumed at the begin-ning of the 1900s) to 2009. All the models consider change in climate and rising atmospheric CO2 concentration
(simula-tion S2), while 9 of 10 models run a factorial simula(simula-tion con-sidering only rising atmospheric CO2(simulation S1). Only
three models account for N limitation on vegetation produc-tivity (Sheffield–DGVM, NCAR-CLM4CN and OCN). The spatial resolution of each simulation differs among models (Table 1).
The historical changes in atmospheric CO2 for the
pe-riod 1901–2009 are derived from ice core records and at-mospheric observations (Keeling and Whorf, 2005). For the climate forcing datasets, monthly climate data for the pe-riod 1901–2009 from CRU-NCEP datasets with a spatial resolution 0.5◦×0.5◦(http://dods.extra.cea.fr/data/p529viov/ cruncep/) were used in all models. Information on atmo-spheric nitrogen deposition for NCAR-CLM4CN and OCN was taken from Jean-Franc¸ois Lamarque (personal commu-nication) and Dentener et al. (2006), respectively.
2.3 Atmospheric inversion models
The spatio-temporal characterization of atmospheric CO2
concentration between different stations provides integrated constraints to the net land–atmosphere CO2 exchange.
In-verse models, referred to as the “top-down” approach, in-fer spatial patterns of land–atmosphere CO2fluxes and their
variability using atmospheric CO2 concentration
measure-ments made at a surface network of about 100 stations, at-mospheric transport modeling, and prior information on land and ocean fluxes as well as on fossil fuel CO2emissions in
the case of Bayesian synthesis inversions (Enting et al., 1995; Gurney et al., 2002; Peylin et al., 2005). There are large un-certainties in inversion estimates of regional CO2fluxes,
par-ticularly for a region like East Asia where the surface net-work is sparse (9 stations over North Asia). Inversion re-sults are also sensitive to biases in transport models and to biases in the assumed magnitude and distribution of fossil fuel emissions (Peylin et al., 2005; Gurney et al., 2005). One advantage, however, of inversions is that they provide an estimation encompassing all surface sources and sinks of CO2, in principle with an uncertainty which propagates
random error on prior fluxes and on atmospheric measure-ments and models (Enting et al., 1995). By contrast with the top-down approach of inversions, there is a risk of bias in omitting important processes or ecosystems (e.g. wet-lands and urban ecosystems) in inventories and ecosystem carbon cycle modeling (bottom-up approaches), described above. Here, we provide carbon balance estimates from seven inversions, carried out by the TRANSCOM (Baker et al., 2006) modelers and made available for the REC-CAP project. The inversions giving CO2 flux estimates for
at least 10 years during 1990–2009 are adopted in our study (Peylin et al., 2011). They are C13 CCAM, C13 MATCH, JENA S96, JMA 2010, NICAM, NIES, and PYVAR. In ad-dition, the net CO2 land–atmosphere fluxes estimated by
the CarbonTracker (CTRACKER US, Peters et al., 2007) in 2000–2009 are also considered. The study period of each in-verse model simulation is provided in Table 2.
In atmospheric inversions, uncertainties treated as Gaus-sian purely random errors formally account for uncertain prior fluxes, uncertain atmospheric measurements and un-certain capabilities of transport models to represent these measurements (see Ciais et al., 2010, for instance, for an overview). In the RECCAP inversions used in this study over East Asia, however, the optimized flux does not account for prior flux uncertainties in fossil fuel combustion CO2
emis-sions. In other words, each inversion prescribes to the at-mospheric transport model fossil fuel emissions assumed of perfectly known global magnitude and spatio-temporal dis-tribution. To minimize the influence of inter-model differ-ences in assumed fossil fuel emissions in estimating land– atmospheric CO2fluxes, adjustments were made by adding
posterior land–atmospheric fluxes of each model with the difference between assumed fossil fuel emissions by the model and the common fossil fuel emissions (EDGAR3.2 Fast Track 2000 emission database, Olivier et al., 2001). In order to account for regional fossil fuel CO2 emissions
un-certainty, which is particularly large when a fast developing economy such as China is included in a region (Gregg et
3576 S. L. Piao et al.: The carbon budget of East Asia
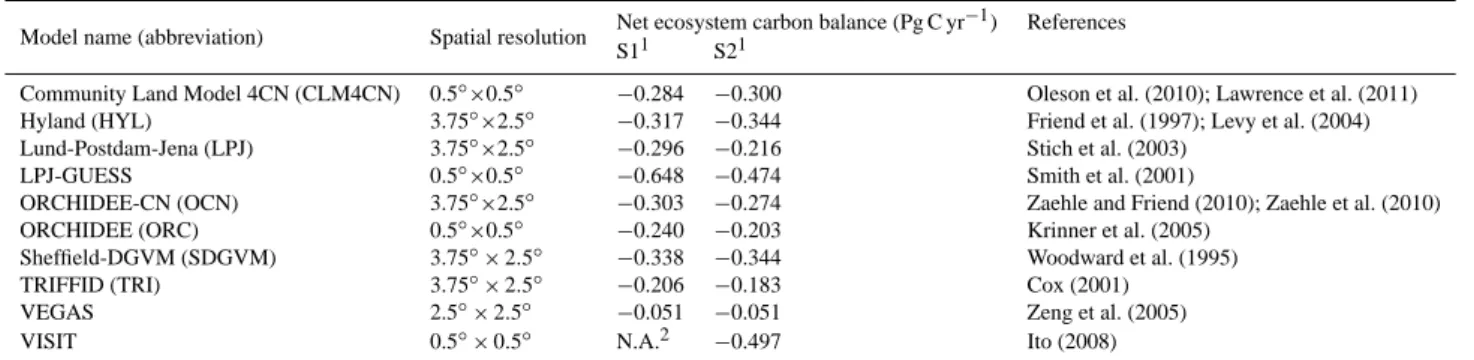
Table 1. Carbon balance derived by different carbon cycle models.
Model name (abbreviation) Spatial resolution Net ecosystem carbon balance (Pg C yr
−1) References S11 S21
Community Land Model 4CN (CLM4CN) 0.5◦×0.5◦ −0.284 −0.300 Oleson et al. (2010); Lawrence et al. (2011)
Hyland (HYL) 3.75◦×2.5◦ −0.317 −0.344 Friend et al. (1997); Levy et al. (2004)
Lund-Postdam-Jena (LPJ) 3.75◦×2.5◦ −0.296 −0.216 Stich et al. (2003)
LPJ-GUESS 0.5◦×0.5◦ −0.648 −0.474 Smith et al. (2001)
ORCHIDEE-CN (OCN) 3.75◦×2.5◦ −0.303 −0.274 Zaehle and Friend (2010); Zaehle et al. (2010)
ORCHIDEE (ORC) 0.5◦×0.5◦ −0.240 −0.203 Krinner et al. (2005)
Sheffield-DGVM (SDGVM) 3.75◦×2.5◦ −0.338 −0.344 Woodward et al. (1995)
TRIFFID (TRI) 3.75◦×2.5◦ −0.206 −0.183 Cox (2001)
VEGAS 2.5◦×2.5◦ −0.051 −0.051 Zeng et al. (2005)
VISIT 0.5◦×0.5◦ N.A.2 −0.497 Ito (2008)
1Two model simulation experiments, noted by S1 and S2, are set in Trendy protocol. In the S1 experiment, models were forced with rising atmospheric CO
2, recycled climate of the early 20th century, and
constant land use; in the S2 experiment, models were forced with rising atmospheric CO2, observed climate, and constant land use. Negative values indicate carbon sink.
2S1 simulation by VISIT model is not available.
Table 2. Carbon balance derived by different atmospheric inverse
models. Negative values indicate carbon sink.
Name Study Period Carbon balance Reference
(Pg C yr−1)
C13 CCAM 1992–2008 −0.997 Law et al. (2006)
C13 MATCH 1992–2008 0.416 Rasch et al. (1997)
JENA S96 1996–2009 −0.930 R¨odenbeck et al. (2003)
JMA 2010 1985–2008 0.201 Taguchi (1996)
NICAM 1988–2007 −0.404 Satoh et al. (2008)
NIES 1993–2007 −0.641 Maksyutov et al. (2008)
PYVAR 1988–2008 −0.376 Chevallier et al. (2005)
CTRACKER US 2000–2009 −0.312 Peters et al. (2007)
al., 2008), we added to the inversion uncertainties from the RECCAP-East Asia study the estimated standard error (one
σ )of fossil fuel emissions of each East Asian country (8.9 % for China and North Korea, 2.0 % for Japan, 7.6 % for Mon-golia and 6.2 % for South Korea, Andres et al., personal com-munication). The inter-model errors and fossil fuel emissions errors are propagated assuming that they are independent.
2.4 Uncertainty estimates
The uncertainties of the carbon flux components were es-timated using two methods. First, when the data product includes a formal uncertainty analysis, the provided uncer-tainty estimates are used in our reports. Second, when there are several independent estimates of the same flux compo-nent with the same method (e.g. the net land–atmospheric CO2 exchange estimated by inverse models), the standard
deviation of the independent estimates is reported as their uncertainty. The standard deviation usually underestimates the uncertainty when there are only a few samples; in this case, we also give the range of the independent estimates. When only one sample is available for some flux component within one method and when this sample does not have a documented uncertainty, we do not estimate its uncertainty.
When summing several flux contributions that are esti-mated independently, we quadratically sum the
correspond-ing uncertainty standard deviations to document the resultcorrespond-ing uncertainty.
3 Results and discussion
3.1 Inventory- and satellite-based estimation
3.1.1 Forest biomass accumulation
In East Asia, forest area is significantly increased from 2.09 × 10⁶km2in 1990 to 2.55 × 10⁶km2in 2010, most of this increase being in China. According to the latest report of FAO on Global Forest Resources Assessment (FAO, 2010), Chinese forest increased by 2.49 × 10⁴km2per year during the period of 1990–2010. Partly in response to expanding forest area, forest biomass in China is estimated to have in-creased from 4.4 Pg C in 1990 to 6.2 Pg C in 2010, resulting in a net sink of −0.09 Pg C yr−1 over the last two decades (Supplement Table S1). This estimation based on FAO data is very close to the recent synthesis of Pan et al. (2011), who inferred a biomass carbon sink of −0.06 Pg C yr−1 during the 1990s, and that of −0.115 Pg C yr−1during the period of 2000–2007 (average of −0.084 Pg C yr−1over the past two decades). Owing primarily to the growth of relatively young stands (age of 40–60 yr) Japanese forests are estimated to be a net C sink in the range −0.024 – −0.019 Pg C yr−1over the last two decades (FAO, 2010; Pan et al., 2011). In contrast, due to the decrease in forest area in Mongolia (loss of 8.19 × 10²km2per year) and North Korea (loss of 1.27 × 10³km2 per year) during 1990s and 2000s, forest biomass in these two countries has decreased (most likely transformed as CO2
emitted to the atmosphere) at a rate of 0.004 Pg C yr−1 and
0.003 Pg C yr−1, respectively. In South Korea, despite the fact that the area of forest shrunk from 6.37 × 10⁴km2 in 1990 to 6.22×10⁴km2to 2010, biomass increased by 0.008– 0.009 Pg C yr−1(FAO, 2010; Pan et al., 2011), which is re-lated to re-growth of young forests established in the early 1970s (Choi et al., 2004). Overall, based on national for-est inventory data compiled by FAO, we obtain an average
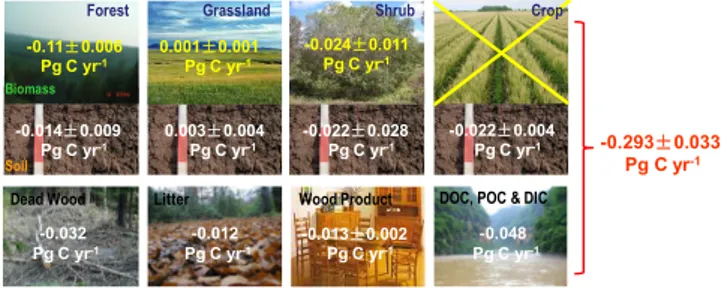
S. L. Piao et al.: The carbon budget of East Asia 3577 Figure 3 Wood Product -0.013±0.002 Pg C yr-1 -0.293±0.033 Pg C yr-1 0.003±0.004 Pg C yr-1 -0.014±0.009 Pg C yr-1
Forest Grassland Shrub
-0.024±0.011 Pg C yr-1 -0.11±0.006 Pg C yr-1 0.001±0.001 Pg C yr-1 Soil Biomass -0.022±0.004 Pg C yr-1 -0.022±0.028 Pg C yr-1 Crop Soil Dead Wood -0.032 Pg C yr-1 Litter -0.012 Pg C yr-1
DOC, POC & DIC
-0.048 Pg C yr-1
Crop
Fig. 3. The inventory- and satellite-based approach estimated a
car-bon sink in terrestrial ecosystems in East Asia and its components over the last two decades. A negative value indicates net carbon sink.
net forest biomass C sink of −0.11 ± 0.006 Pg C yr−1 over East Asia during the period 1990–2009 (Fig. 3, Supple-ment Table S1). This represents about 9 % of the total north-ern forest C sink (Pan et al., 2011). Comparatively, East Asia’s forest biomass C sink was close to those of Europe (−0.14 – −0.08 Pg C yr−1) and the United States (−0.13 –
−0.12 Pg C yr−1)(FAO, 2010; Pan et al., 2011; Luyssaert et al., 2010).
3.1.2 Shrublands biomass change
Although shrubland ecosystems are widespread in China (Wu, 1980; IGCAS, 1996), there is very limited data avail-able to ascertain C stock changes. In North America, the expansion of shrubland ecosystems in arid regions, called “woody encroachment”, was estimated to be a sink of
−0.12 Pg C yr−1, accounting for 18–34 % of the total coter-minous US carbon sink (Pacala et al., 2001). In China, changes in energy production systems in rural areas and movement of rural populations to cities have likely di-minished the collection of fuel wood, and thus acceler-ated the recovery of shrubland and woodland vegetation. Shrublands were estimated to increase their biomass by 0.022 ± 0.01 Pg C yr−1over the last two decades of the 20th century (Piao et al., 2009a), determined using an indirect estimation approach based upon site-level data and NDVI trends. Extending the approach of Piao et al. (2009a) based on NDVI–biomass regressions between sites extrapolated in time to shrublands over the entire East Asia region, we esti-mate that shrubland biomass C stocks over East Asia have increased by an average sink of −0.024 ± 0.011 Pg C yr−1 and have an uncertainty of about 50 % (estimated from the scatter around the linear regression line between NDVI and shrubland biomass at 34 available sites) (Fig. 3).
3.1.3 Grasslands biomass change
Grassland ecosystems in the world may contribute as much as 20 % of total terrestrial production and could be potential C sinks (Scurlock and Hall, 1998), but the direct evidence is very limited. In China, several studies have suggested that
grassland biomass significantly increased from early 1980s to late 1990s (Piao et al., 2007), followed by a decreasing trend over the last decade due to an increase in drought driven by reduced summer precipitation and rising temperature, and due to overgrazing by livestock (Jeong et al., 2011; Piao et al., 2011b; Peng et al., 2011). Consequently, our NDVI– biomass regression approach (see Methods section) in this study indicates that grassland biomass in East Asia is rel-atively stable with a slight decline 0.001 ± 0.001 Pg C yr−1 (Fig. 3). It should be noted that the uncertainties of this es-timation may be underestimated, since we did not consider the uncertainties of grassland inventory data, satellite time series datasets, and a belowground carbon stocks estimation approach (Fan et al., 2008).
3.1.4 Soil carbon changes
Soils in East Asia contain large carbon stocks, and may play an important role in the regional carbon balance. The in-creased biomass in forest and shrubland over the last two decades implies that soils may accumulate carbon through increased litterfall during the same period, but there are no observational data from repeated inventories to sup-port this speculation at the regional and country scales. Using the ratios of soil-to-biomass carbon sink calculated for forest (0.05–0.2), shrubland (0.35–1.8), and grassland (0.85–4.4) in China by Piao et al. (2009a) and Tian et al. (2011) in combination with biomass stock changes de-rived in this study, we estimated soil carbon storage change over East Asia of 0.014 ± 0.009 Pg C yr−1for forests (range from 0.005 to 0.022 Pg C yr−1), 0.022 ± 0.028 Pg C yr−1
for shrublands (range from 0.005 to 0.063 Pg C yr−1),
and −0.003 ± 0.004 Pg C yr−1 for grasslands (range from
−0.009 to −0.002 Pg C yr−1)(Fig. 3). Compared with natu-ral ecosystems, changes in agricultunatu-ral practices play a dom-inant role in controlling cropland soil carbon storage. Sev-eral meta-analyses of cropland soil carbon inventory data suggest that the average rate of SOC sequestration in Chi-nese cropland (area of 130 M ha) was 21.7 ± 4.3 Tg C yr−1 between 1980 and 2000 (Huang et al., 2006; Lu et al., 2009; Yu et al., 2009; Pan et al., 2010; Huang et al., 2010; Sun et al., 2010b). Due to lack of information on change in crop-land SOC in China after 2000, we used this value to extrap-olate the soil carbon increase for the period of 1990–2010 (Fig. 3). Change in cropland soil carbon storage for the other four countries is not taken into account in this study because of lack of available information, but this may not signif-icantly influence our final results on the magnitude of the carbon budget in East Asia due to the relatively small crop-land area in these four countries (9.69 × 10⁴km2compared to 1.43 × 10⁶km2in China) (Ramankutty et al., 2008).
3578 S. L. Piao et al.: The carbon budget of East Asia
3.1.5 Wood products change
In addition to change in biomass and soil carbon stor-age, one must account for the carbon accumulated in wood products, a component not included in forest inven-tories but that should be considered in regional estimates of C storage (Pacala et al., 2001). Based on FAO data, we estimated that wood products in China are a sink of
−0.010 Pg C yr−1, which is comparable with other current estimates of −0.008 Pg C yr−1(Kohlmaier et al., 2007) and
−0.007 Pg C yr−1 (Pan et al., 2011). The sum of the car-bon sink of wood products for the other four countries in East Asia is about −0.005 Pg C yr−1, suggesting that the
carbon accumulated into wood products over East Asia is
−0.013 ± 0.002 Pg C yr−1.
3.1.6 Carbon exported from the land to the ocean
As a result of “leaching” and physical erosion, a substan-tial amount of soil organic and plant litter carbon is exported as DOC and POC from the land to the ocean (Ludwig et al., 1996). We estimated riverine export of 9.8 Tg C yr−1by DOC and 9.4 Tg C yr−1by POC over East Asia from a global synthesis calculated by Emilio Mayorga based on the NEWS approach. The estimates considered here represent net land– ocean DOC and POC fluxes and do not take into account OC being sedimented within the river system, e.g. in dams, lakes or flood plains, or OC being decomposed during trans-port. These OC burials in river systems can be substantial and would represent a net loss from the here considered land– surface system (e.g. Tranvik et al., 2009). However, due to lack of quantitative data these fluxes are not included in our study.
The land–river DIC flux sources are partly atmospheric CO2derived via root respiration and decomposition of DOC
and POC in the soil–rock system or are of lithogenic ori-gin (carbonate dissolution). This river DIC is predominantly transported as weathering-derived bicarbonate and carbonate ions to the ocean, while excess CO2 (CO2above the
equi-librium level corresponding to the atmospheric CO2partial
pressure) escapes back to the atmosphere. Over East Asia, the net DIC flux from the land to the ocean was estimated to be 0.029 Pg C yr−1(cf. Hartmann et al., 2009). It should be noted that lithogenic DIC should be subtracted from the total DIC transported to the oceans, since it is derived from geo-logical carbon stock rather than from the atmosphere. The proportion of lithogenic DIC in the total DIC is probably larger than 33 %. We did not consider lithogenic DIC in this study.
Since 1990, carbon accumulated in dead wood over China, Japan and South Korea has increased by about 0.023, 0.007, and 0.002 Pg C yr−1, respectively (Pan et al., 2011). In addi-tion, C storage in China’s forest litter has increased by the magnitude of 0.012 Pg C yr−1. Overall, our inventory- and satellite-based estimation suggests that the East Asian
ter-ritory annually has accumulated net 0.293 ± 0.033 Pg of car-bon (range from C sink of −0.237 to −0.367 Pg C yr−1)from
the atmosphere over the last two decades (Fig. 3, Supplement Table S2).
3.2 Model attribution of net carbon balance over East
Asia
3.2.1 Climate change and rising atmospheric CO2
concentration
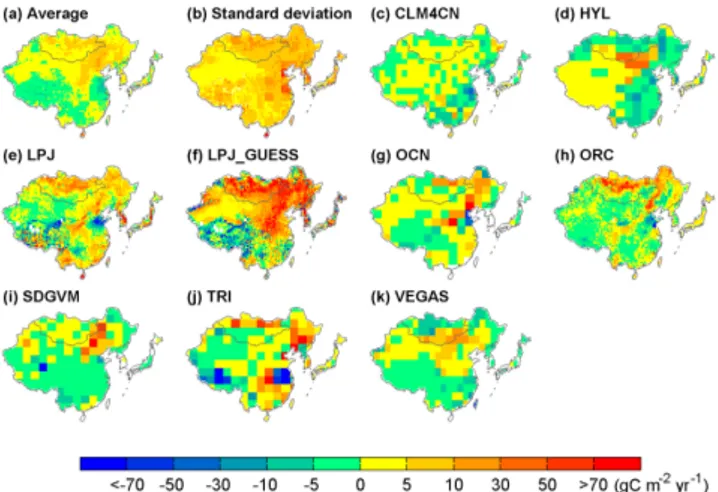
To evaluate the effects of climate change on C balance, we use the difference between net ecosystem carbon balance be-tween terrestrial ecosystems and atmosphere in S1 and net ecosystem carbon balance in S2 as the contribution of cli-mate change alone to C balance over East Asia. Among the nine models (CLM4CN, HYL, LPJ, LPJ-GUESS, OCN, OR-CHIDEE, SDGVM, TRI, VEGAS) providing both S1 and S2 simulations, four models (CLM4CN, HYL, SDGVM and HYL) suggest that climate change alone causes a carbon sink in terrestrial ecosystems over East Asia. The average of the nine models for the fraction of net ecosystem carbon balance driven by climate change is 0.033 ± 0.062 Pg C yr−1 (posi-tive values indicate net carbon sources), with a range going from a net carbon source of 0.174 Pg C yr−1(LPJ-GUESS) to a net sink of −0.027 Pg C yr−1(HYL). This relatively small magnitude of net ecosystem carbon balance attributed to cli-mate change results from opposite changes in carbon storage in the southern and northern regions of East Asia (Fig. 4), according to the models. Although the magnitude of the cli-mate change-attributed carbon budget varies among different models, all models agree that in response to climate change alone, southern China experienced an increase in carbon stor-age from 1990 to 2009, while northern East Asia, including Mongolia and north China, showed a decrease in carbon stor-age (Fig. 4), likely due to drought. In particular since the late 1990s, northern East Asia, except northwest China, suffered from drought driven by both decreasing precipitation and ris-ing temperature (Park et al., 2010; Piao et al., 2010). Such an increase in drought further caused a decrease in satellite-observed vegetation growth in northern East Asia (Jeong et al., 2011; Piao et al., 2011b). In southern East Asia where precipitation is abundant, enhanced vegetation productivity driven by current global warming may partly explain climate change-induced net carbon accumulation (Piao et al., 2004). Since plant photosynthesis is not saturated at the current atmospheric CO2 concentration, previous modeling studies
suggested that global vegetation productivity increased sig-nificantly in response to rising atmospheric CO2
concen-tration, which further caused an increase in net carbon up-take of terrestrial ecosystems (Sitch et al., 2007). By con-sidering this CO2 fertilization effect in addition to climate
change (simulation S2), all ecosystem carbon cycle mod-els suggest that at the regional scale, terrestrial ecosys-tems in East Asia act as a carbon sink by an average of
S. L. Piao et al.: The carbon budget of East Asia 3579 Figure 4
Fig. 4. Nine ecosystem models simulated spatial patterns of net
ecosystem carbon balance attributed to climate change (obtained from the difference between simulation S2 and S1) during the pe-riod 1990–2009. (a) Average net ecosystem carbon balance from the nine models, (b) standard deviation of the nine model-derived net ecosystem carbon balance, and (c–h) net ecosystem carbon bal-ance estimated by each model. Negative value indicates net carbon sink.
−0.289 ± 0.135 Pg C yr−1 (ranging from −0.051 Pg C yr−1
for VEGAS to −0.497 Pg C yr−1 for VISIT) during 1990–
2009. As shown in Fig. 5, it is very likely that most of this carbon sink attributed to climate change and rising CO2
is mainly distributed in southern and eastern China (except LPJ-GUESS).
3.2.2 Nitrogen deposition
It is generally accepted that nitrogen deposition enhances carbon sink strength through two mechanisms: (1) stim-ulated vegetation productivity resulting in increased veg-etation biomass (Churkina et al., 2007), and (2) reduced soil organic matter decomposition rates leading to increased soil organic C storage (Pregitzer et al., 2008; Janssens et al., 2010). However, there is an intense debate about the magnitude and possible saturation of the nitrogen-induced carbon sink (Janssens et al., 2010). In Europe, Churkina et al. (2010) estimated that the nitrogen deposition-induced car-bon sink is −0.037 – −0.030 Pg C yr−1, while in China, Tian et al. (2011) showed that net carbon accumulation due to ni-trogen deposition is larger than that caused by elevated at-mospheric CO2. This is inconsistent with the result of the
OCN model (Zaehle et al., 2010). Based on the simulation by Tian et al. (2011) using DLEM and TEM models, we es-timate annually a sink of about −0.125 Pg of carbon realized in China’s terrestrial ecosystems in response to nitrogen de-position during the period of 1990–2005. This N dede-position- deposition-induced carbon sink is larger than estimated by the CLM4CN model, which predicts that the nitrogen deposition-enhanced carbon sink over East Asia is about −0.089 Pg C yr−1from
Figure 5
Fig. 5. Ten ecosystem models simulated spatial patterns of net
ecosystem carbon balance in response to climate change and
ris-ing atmospheric CO2(Simulation S2) during the period 1990–2009.
(a) Average net ecosystem carbon balance from the ten models, (b)
standard deviation of the ten model-derived net ecosystem carbon balance, and (c–h) net ecosystem carbon balance estimated by each model. Negative value indicates net carbon sink.
1990 to 2009 (Mao et al., 2012). These two simulations derived by different models further suggest that there is a large uncertainty in the estimation of the nitrogen deposition-caused carbon sink over East Asia. Here, we took the average of these two studies (−0.107 ± 0.025 Pg C yr−1)(Fig. 6).
3.2.3 Land use and land-use change
Land-use change is one of the important disturbances that alter terrestrial carbon pools and net fluxes at regional and global scales (Houghton, 2003). However, it is extremely challenging to accurately estimate the carbon balance change associated with land-use change because of current lack of information on the amount and spatial pattern of defor-estation and biomass and soil C stocks (Houghton, 2007; Piao et al., 2009b). For instance, Houghton et al. (2003) estimated that land-use change in China led to net carbon emission of 0.03 Pg C yr−1during the 1990s, while Jian and Yang (2005) found oppositely that land-use change in China resulted in net carbon accumulation of −0.03 Pg C yr−1 (Jian and Yang, 2005), which is very close to the esti-mation based on forest area changes from inventory data (−0.02 Pg C yr−1, Fang et al., 2001) and from the DLEM and TEM models (−0.03 Pg C yr−1, Tian et al., 2011). Based on these results, we estimated that land-use change, dominated by afforestation, caused a net carbon accumulation in East Asia of 0.013 ± 0.029 Pg C yr−1 (ranging from a source of 0.03 Pg C yr−1to a sink of −0.03 Pg C yr−1)(Fig. 6).
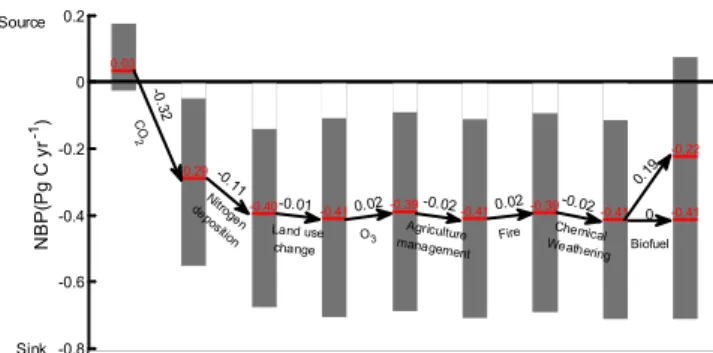
3580 S. L. Piao et al.: The carbon budget of East Asia Figure 6 -0.8 -0.6 -0.4 -0.2 0 0.2 N BP( Pg C y r -1) 0.03 -0.29 -0.40 -0.41 -0.39 -0.41 -0.39 -0.41 -0.22 -0.41 CO 2 -0. 32 Nitroge n depos ition -0.11 Land use change -0.01 O3 0.02 Agriculture management -0.02 Fire 0.02 Chemical Weathering -0.02 Biofuel 0.19 0 Sink Source
Fig. 6. Different factors’ (climate, climate + CO2, nitrogen
depo-sition, land-use change, O3 pollution, agricultural management,
fire and biofuels) contributions to the carbon balance of terres-trial ecosystems in East Asia. Negative values indicate net carbon sink. Grey bars show ranges in the estimates by different models or sources. Biofuel emissions are fully accounted for when assum-ing the harvested carbon stock is not compensated by vegetation re-growth, and they are not accounted for when assuming the harvested carbon stock is fully compensated by vegetation regrowth. Potential interactions among different factors are not considered. The
contri-butions of atmospheric O3 pollution and agriculture management
on the carbon balance are estimated over China rather than over the entire East Asia region due to lack of information for other countries (see Sect. 3.2.4).
3.2.4 Atmospheric ozone pollution and other fluxes
In addition to these factors (i.e. climate change, rising CO2,
nitrogen deposition and land-use change), previous studies have suggested that atmospheric O3pollution has also caused
a decrease in carbon storage in China by 0.02 Pg C yr−1(Tian
et al., 2011), while intensive agricultural practices and their changes, such as nitrogen fertilization and decreasing re-moval of crop residues, have been thought to lead to an in-crease in carbon sequestration by 0.022 ± 0.004 Pg C yr−1 (Huang et al., 2010).
Wildfires may also play an important role in the regional carbon balance. Satellite data of burned area incorporated in the CASA terrestrial biosphere model estimated mean an-nual carbon emission from ecosystem fire in East Asia from 1997 to 2009 of 0.018 ± 0.010 Pg C yr−1 (van der Werf et al., 2010). Most of the carbon emission from wildfires oc-curred in China (56.9 %) and Mongolia (37.5 %), which con-tain vast areas of dry forests, shrub lands, and grasslands (van der Werf et al., 2010).
In addition, CO2 consumption by chemical weathering
of silicates and carbonates is a carbon sink not counted in the modeling. Based on lithological maps, river runoff and river chemistry datasets (Hartmann et al., 2009; Hart-mann, 2009), net CO2consumption by chemical weathering
over the considered East Asian territory was estimated to be 0.020 Pg C yr−1.
Finally, carbon emissions from biofuels, such as wood-fuel and agricultural residues, are not taken into account
for most of the carbon cycle models. Recently, Wang et al. (2012) estimated the biofuel emissions in China to be about 0.189 ± 0.010 Pg C yr−1, a very large flux compared
to natural C sinks. If biofuel harvest is exactly compensated by a vegetation regrowth sink that can not be detected by the inventory, the biofuel emissions should not be included in the carbon balance estimation based on the carbon cycle model approach. Otherwise, if the harvest of biofuel carbon stock is not compensated by vegetation regrowth, the biofuel carbon emissions should be included. Since we do not have information on the biofuel harvests compensated by the veg-etation regrowth sink, we consider both situations, resulting in two estimates of carbon balance – either fully considering biofuel emissions or not.
Overall, based on process-based ecosystem models and considering the carbon sinks/sources caused by all these different factors estimated in this and previous studies, we estimate that the carbon balance over East Asia is
−0.224 ± 0.141 Pg C yr−1considering the biofuel emissions, or −0.413 ± 0.141 Pg C yr−1 not considering biofuel emis-sions (ranging from a carbon source of 0.099 Pg C yr−1 to a carbon sink of −0.680 Pg C yr−1)(Fig. 6, Supplement Ta-ble S2).
3.3 Atmospheric inverse model estimates
Over the whole East Asia, the average of eight in-verse models give a net sink of atmospheric CO2 of
−0.380 ± 0.497 Pg C yr−1, but the eight models do not agree with each other. Six models estimate a net CO2uptake over
East Asia, but two models show a net CO2source (Table 2).
The C13 MATCH model estimated the highest net carbon up-take rate of −0.997 Pg C yr−1, while the C13 CCAM model
showed the largest net carbon emission of 0.416 Pg C yr−1 (Fig. 7), indicating that inversion fluxes over East Asia are rather poorly constrained by a regionally scarce atmo-spheric observation network. If we further consider propa-gating uncertainty of fossil fuel emissions over East Asia (0.098 Pg C yr−1), the uncertainty of net CO2 exchange
es-timated by inverse models increases to 0.507 Pg C yr−1. The inverse model-derived net land–atmosphere CO2
ex-change is not directly comparable with the carbon sink es-timated by the bottom-up approaches. In order to reconcile the two approaches, CO2 fluxes out of and into the
atmo-sphere from food and wood products trade, non-CO2 gas
emissions, and the emissions of C pools not counted in fossil fuel emissions (e.g. peat use) must be considered to adjust the inverse model estimate (Ciais et al., 2008). The emission of CO2 to the atmosphere from consumption of imported
(exported) food and wood should be added to (removed from) the regional inverse estimates for making a compari-son with bottom-up C accounting approaches. We estimated the carbon emissions of imported food and wood by an-alyzing FAO statistics on international trade (FAO, 2010). The imported crop biomass in East Asia was converted into
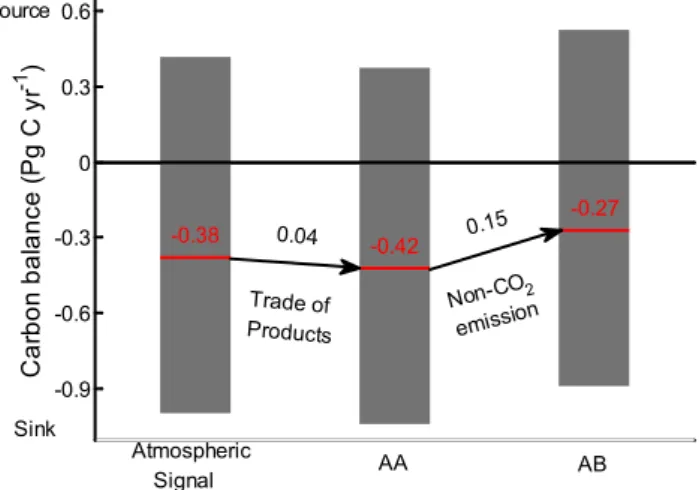
S. L. Piao et al.: The carbon budget of East Asia 3581 Figure 7 -0.9 -0.6 -0.3 0 0.3 0.6 C ar bon bal anc e ( P g C y r -1 ) -0.38 -0.42 -0.27 Sink Source Atmospheric Signal AA AB Trade of Products 0.04 Non-CO2 emission 0.15
Fig. 7. Atmospheric inversion model estimated carbon balance in
East Asia through considering lateral carbon fluxes. The same
fos-sil fuel CO2emission estimate has been removed from each
inver-sion to obtain the land–atmosphere CO2flux. The average of seven
inverse model estimations (atmospheric signal) is corrected by two
lateral fluxes. (1) CO2emissions due to imported wood and food
products (0.04 PgC yr−1)are added to the atmospheric inversion
result, resulting in AA; (2) the carbon sink in AA is reduced by car-bon fixed by photosynthesis but released to the atmosphere by
non-CO2compounds (0.15 PgC yr−1), including CO, CH4and volatile
organic compounds (VOCs), resulting in AB, which should be com-parable to estimates by the inventory- and satellite-based approach. Grey bars show ranges in the estimates by different inverse models.
carbon using a crop-specific conversion factor (Goudriaan et al., 2001), and imported wood was transformed to carbon following the method of Ciais et al. (2008). Thus, we es-timated that the imported wood and food consumption was 0.04 Pg C yr−1during 1990–2009. The non-CO2compounds
such as CO, CH4and BVOC (biogenic volatile organic
com-pounds) emitted by ecosystems, which were also not cap-tured by atmospheric CO2observations, should be subtracted
from the inverse estimate when assessing the total carbon balance. Using an atmospheric chemistry database (Folberth et al., 2006), we estimated that the biogenic non-CO2
emis-sion was 0.15 Pg C yr−1. Due to the lack of information, the removal of fossil C not counted in fossil fuel emissions (e.g. peat use) is not considered in our study. By adjusting the in-verse estimates using these lateral fluxes, the top-down ap-proach estimated that the terrestrial ecosystems of East Asia functioned as a net carbon sink of −0.270 ± 0.507 Pg C yr−1
during 1990–2009, with a range from net carbon emission of 0.526 Pg C yr−1 to net carbon sink of −0.887 Pg C yr−1 (Fig. 7, Supplement Table S2).
4 Summary
In summary, based on the average carbon sink from three approaches presented in this study, we estimate that East Asia’s terrestrial territory during the 1990s and 2000s were
a net carbon sink of −0.224 to −0.413 Pg C yr−1 (average
of −0.294 Pg C yr−1), accounting for 13–27 % of the carbon
sink over the Northern Hemisphere (Stephens et al., 2007). During the same period, fossil fuel burning in East Asia pro-duced a cumulated emission of 1.5 Pg C yr−1 to the atmo-sphere (IEA, 2011; Fig. 1), suggesting that about 13–27 % of East Asia’s CO2emissions from fossil fuel burning are offset
by carbon accumulation in its terrestrial ecosystems. Although the average carbon sink estimated by three dif-ferent approaches was found to be comparable, there are still large uncertainties in each approach. For the inventory and satellite data based approach, the largest uncertainty lies in the estimation of soil organic carbon storage change, while for the terrestrial ecosystem modeling approach, carbon bal-ance associated with land-use change and nitrogen deposi-tion was inconsistent among different models. Promoting a regional model intercomparison project for East Asia, like the VEMAP project for the United States, will help constrain the uncertainties associated with process representation and parameters in the models. There are also large variations in the estimated carbon balance among different inverse mod-els. To enable more precise assessments of East Asia’s car-bon cycle, there is an urgent need to increase the sampling of forest and grassland soils, and to deploy more atmospheric CO2stations. In order to correct the differences among
dif-ferent approaches, there is also a need to improve data prod-ucts of lateral fluxes (e.g. non-CO2 emissions and carbon
exchange between terrestrial ecosystems and inland waters), particularly in their spatial and temporal resolutions. On the analogy of meteorological re-analyses, such an integration system will allow us to establish a “re-analysis” dataset of the global and regional carbon cycles.
Supplementary material related to this article is available online at: http://www.biogeosciences.net/9/ 3571/2012/bg-9-3571-2012-supplement.pdf.
Acknowledgements. This study is part of the REgional Carbon Cycle Assessment and Processes (RECCAP), Global Carbon Project. We thank atmospheric inversion modelers for providing
atmospheric CO2inversion results. This study was supported by
the National Natural Science Foundation of China (grant 41125004 and 30970511), National Basic Research Program of China (Grant No. 2010CB950601 and Grant No. 2010CB833501), Foundation for Sino-EU research cooperation of Ministry of Science and Technology of China (1003), CARBONES EU FP7 foundation (242316) and Chinese Ministry of Environmental Protection Grant (201209031).
3582 S. L. Piao et al.: The carbon budget of East Asia References
Akimoto, H.: Global air quality and pollution, Science, 302, 1716– 1719, doi:10.1126/science.1092666, 2003.
Baker, D. F., Law, R. M., Gurney, K. R., Rayner, P., Peylin, P., Denning, A. S., Bousquet, P., Bruhwiler, L., Chen, Y. H., Ciais, P., Fung, I. Y., Heimann, M., John, J., Maki, T., Maksyutov, S., Masarie, K., Prather, M., Pak, B., Taguchi, S., and Zhu, Z.: TransCom 3 inversionintercomparison: Impact of transport model errors on the interannual variability of re-gionalCO2 fluxes, 1988–2003, Global Biogeochem. Cy., 20, GB1002, doi:10.1029/2004GB002439, 2006.
Cai, W., Guo, X., Chen, A., Dai, M., Zhang, L., Zhai, W., Lohrenz, S. E., Yin, K., Harrison, P. J., and Wang, Y.: A comparative overview of weathering intensity and hco3- flux in the world’s major rivers with emphasis on the changjiang, huanghe, zhujiang (pearl) and mississippi rivers, Cont. Shelf. Res., 28, 1538–1549, doi:10.1016/j.csr.2007.10.014, 2008.
Canadell, J. G., Ciais, P., Gurney, K., Le Qu´er´e, C., Piao, S., Rau-pach, M. R., and Sabine, C. L.: An international effort to quantify regional carbon fluxes, E. O. S., 92, 81–82, 2011.
Carvalhais, N., Reichstein, M., Seixas, J., Collatz, G. J., Pereira, J. S., Berbigier, P., Carrara, A., Granier, A., Montagnani, L., Papale, D., Rambal, S., Sanz, M. J., and Valentini, R.: Implications of the carbon cycle steady state assumption for biogeochemical mod-eling performance and inverse parameter retrieval, Global Bio-geochem. Cy., 22, Gb2007, doi:10.1029/2007gb003033, 2008. Chevallier, F., Fisher, M., Peylin, P., Serrar, S., Bousquet, P.,
Br´eon, F. M., Ch´edin, A., and Ciais, P.: Inferring CO2 sources and sinks from satellite observations: Method and application to TOVS data, J. Geophys. Res., 110, D24309, doi:10.1029/2005jd006390, 2005.
Choi, S. D. and Chang, Y. S.: Factors affecting the distribution of the rate of carbon uptake by forests in South Korea, Environ. Sci. Technol., 38, 484–488, doi:10.1021/es034533u, 2004.
Churkina, G., Trusilova, K., Vetter, M., and Dentener, F.: Contri-butions of nitrogen deposition and forest regrowth to terrestrial carbon uptake, Carbon Balance Manage., 2, doi:10.1186/1750-0680-2-5, 2007.
Churkina, G., Zaehle, S., Hughes, J., Viovy, N., Chen, Y., Jung, M., Heumann, B. W., Ramankutty, N., Heimann, M., and Jones, C.: Interactions between nitrogen deposition, land cover conver-sion, and climate change determine the contemporary carbon bal-ance of Europe, Biogeosciences, 7, 2749–2764, doi:10.5194/bg-7-2749-2010, 2010.
Ciais, P., Borges, A. V., Abril, G., Meybeck, M., Folberth, G., Hauglustaine, D., and Janssens, I. A.: The impact of lateral car-bon fluxes on the European carcar-bon balance, Biogeosciences, 5, 1259–1271, doi:10.5194/bg-5-1259-2008, 2008.
Ciais, P., Canadell, J. G., Luyssaert, S., Chevallier, F., Shvidenko, A., Poussi, Z., Jonas, M., Peylin, P., King, A. W., Schulze, E. D., Piao, S. L., Rodenbeck, C., Peters, W., and Breon, F. M.: Can we reconcile atmospheric estimates of the Northern terrestrial car-bon sink with land-based accounting?, Curr. Opin. Env. Sust., 2, 225–230, doi:10.1016/j.cosust.2010.06.008, 2010.
Crevoisier, C., Sweeney, C., Gloor, M., Sarmiento, J. L., and Tans, P. P.: Regional US carbon sinks from three-dimensional
atmo-spheric CO2sampling, Proc. Natl. Acad. Sci. USA, 107, 18348–
18353, doi:10.1073/pnas.0900062107, 2010.
Commission for Integrated Survey of Natural Resources, ChineseA-cademy of Sciences, 1 : 4,000,000 Vegetation Map of China, Chi-nese Map Press, Beijing, 1996.
Cox, P. M.: Description of the TRIFFID dynamic globalvegetation model. Tech. Note 24, Hadley Centre, Met Office, 16 pp., 2001. DeFries, R. S., Hansen, M., Townshend, J. R. G., and Sohlberg,
R.: Global land cover classifications at 8 km spatial resolu-tion: the use of training data derived from Landsat imagery in decision tree classifiers, Int. J. Remote Sens., 19, 3141–3168, doi:10.1080/014311698214235, 1998.
Dentener, F., Stevenson, D., Ellingsen, K., van Noije, T., Schultz, M., Amann, M., Atherton, C., Bell, N., Bergmann, D., Bey, I., Bouwman, L., Butler, T., Cofala, J., Collins, B., Drevet, J., Do-herty, R., Eickhout, B., Eskes, H., Fiore, A., Gauss, M., Hauglus-taine, D., Horowitz, L., Isaksen, I. S. A., Josse, B., Lawrence, M., Krol, M., Lamarque, J. F., Montanaro, V., Muller, J. F., Peuch, V. H., Pitari, G., Pyle, J., Rast, S., Rodriguez, J., Sanderson, M., Savage, N. H., Shindell, D., Strahan, S., Szopa, S., Sudo, K., Van Dingenen, R., Wild, O., and Zeng, G.: The global atmospheric environment for the next generation, Environ. Sci. Technol., 40, 3586–3594, doi:10.1021/es0523845, 2006.
Dufour, G., Eremenko, M., Orphal, J., and Flaud, J.-M.: IASI observations of seasonal and day-to-day variations of tropo-spheric ozone over three highly populated areas of China: Bei-jing, Shanghai, and Hong Kong, Atmos. Chem. Phys., 10, 3787– 3801, doi:10.5194/acp-10-3787-2010, 2010.
Enting, I. G., Trudinger, C. M., and Francey, R. J.: A
Synthesisinver-sion of the concentration and DELTA-C-13 of atmospheric CO2,
Tellus B., 47, 35–52, doi:10.1034/j.1600-0889.47.issue1.5.x, 1995.
Fan, J., Zhong, H., Harris, W., Yu, G., Wang, S., Hu, Z., and Yue, Y.: Carbon storage in the grasslands of China based on field mea-surements of above- and below-ground biomass, Clim. Change, 86, 375–396, doi:10.1007/s10584-007-9316-6, 2008.
Fang, J. Y. and Chen, A. P.: Dynamic forest biomass carbon pools in China and their significance, Acta Bot. Sin., 43, 967–973, 2001. Fang, J. Y., Oikawa, T., Kato, T., Mo, W. H., and Wang, Z. H.: Biomass carbon accumulation by Japan’s forests from1947 to 1995, Global Biogeochem. Cy., 19, GB2004, 1–10, doi:10.1029/2004GB002253, 2005.
FAO, Food and Agriculture Organization: Global Forest Resources Assessment, FAO, Rome, Italy, 2010.
Folberth, G. A., Hauglustaine, D. A., Lathi`ere, J., and Brocheton, F.: Interactive chemistry in the Laboratoire de M´et´eorologie Dy-namique general circulation model: model description and im-pact analysis of biogenic hydrocarbons on tropospheric chem-istry, Atmos. Chem. Phys., 6, 2273–2319, doi:10.5194/acp-6-2273-2006, 2006.
Friedlingstein, P., Cox, P., Betts, R., Bopp, L., Von Bloh, W., Brovkin, V., Cadule, P., Doney, S., Eby, M., Fung, I., Bala, G., John, J., Jones, C., Joos, F., Kato, T., Kawamiya, M., Knorr, W., Lindsay, K., Matthews, H. D., Raddatz, T., Rayner, P., Reick, C., Roeckner, E., Schnitzler, K. G., Schnur, R., Strassmann, K., Weaver, A. J., Yoshikawa, C., and Zeng, N.: Climate-carbon cy-cle feedback analysis: Results from the C(4)MIP model inter-comparison, J. Climate, 19, 3337–3353, doi:10.1175/jcli3800.1, 2006.
Fu, G. B., Chen, S. L., Liu, C. M., and Shepard, D.:
S. L. Piao et al.: The carbon budget of East Asia 3583
for the last 50 years, Clim. Change, 65, 149–178,
doi:10.1023/B:CLIM.0000037491.95395.bb, 2004.
Galloway, J. N., Dentener, F. J., Capone, D. G., Boyer, E. W., Howarth, R. W., Seitzinger, S. P., Asner, G. P., Cleveland, C. C., Green, P. A., Holland, E. A., Karl, D. M., Michaels, A. F., Porter, J. H., Townsend, A. R., and Vorosmarty, C. J.: Nitrogen cycles: past, present, and future, Biogeochemistry, 70, 153–226, doi:10.1007/s10533-004-0370-0, 2004.
Gregg, J. S., Andres, R. J., and Marland, G.: China: Emissions
pattern of the world leader in CO2 emissions from fossil fuel
consumption and cement production, Geophys. Res. Lett., 35, L08806, doi:10.1029/2007gl032887, 2008.
Goudriaan, J., Groot, J. R., and Uithol, P. W. J.: Productivity ofAgro-ecosystems, in: Terrestrial Global Productivity, Aca-demic Press, 301–303, 2001.
Gurney, K., Law, R. M., Denning, A. S., and Rayner, P. J.:
To-wards more robustestimates of CO2fluxes: control results from
theTransCom3 inversion intercomparison, Nature, 415, 626–630, 2002.
Gurney, K. R., Chen, Y. H., Maki, T., Kawa, S. R., Andrews, A., and
Zhu, Z. X.: Sensitivity of atmospheric CO2inversions to seasonal
and interannual variations in fossil fuel emissions, J. Geophys. Res.-Atmos., 110, doi:10.1029/2004jd005373, 2005.
Gurney, A., Ahammad, H., and Ford, M.: The economics of greenhouse gas mitigation: Insights from illustrative global abatement scenarios modelling, Energy Econ., 31, S174–S186, doi:10.1016/j.eneco.2009.08.016, 2009.
Hartmann, J., Jansen, N., D¨urr, H. H., Kempe, S., and K¨ohler, P.:
Global CO2-consumption by chemical weathering: What is the
contribution of highly active weathering regions?, Global Planet. Change, 69, 185–194, doi:10.1016/j.gloplacha.2009.07.007, 2009.
Hartmann, J.: Bicarbonate-fluxes and CO2-consumption by chem-ical weathering on the Japanese Archipelago – Application of a multi-lithological model framework, Chem. Geol., 65, 237–271. doi:10.1016/j.chemgeo.2009.03.024, 2009.
Houghton, R. A.: Revised estimates of the annual net flux of carbon to the atmosphere from changes in land use and land manage-ment 1850–2000, Tellus B., 55, 378–390, doi:10.1034/j.1600-0889.2003.01450.x, 2003.
Houghton, R. A.: Balancing the global carbon budget, in: Annual Review of Earth and Planetary Sciences, Annu. Rev. Earth Pl. Sc., 313–347, 2007.
Huang, Y. and Sun, W.: Changes in topsoil organic carbon of crop-lands in mainland China over the last two decades, Chinese Sci. Bull., 51, 1785–1803, doi:10.1007/s11434-006-2056-6, 2006. Huang, Y., Sun, W., Zhang, W., and Yu, Y.: Changes in soil
or-ganic carbon of terrestrial ecosystems in China: A mini-review, Science China-Life Sciences, 53, 766–775, doi:10.1007/s11427-010-4022-4, 2010.
Ichii, K., Suzuki, T., Kato, T., Ito, A., Hajima, T., Ueyama, M., Sasai, T., Hirata, R., Saigusa, N., Ohtani, Y., and Takagi, K.: Multi-model analysis of terrestrial carbon cycles in Japan: lim-itations and implications of model calibration using eddy flux observations, Biogeosciences, 7, 2061–2080, doi:10.5194/bg-7-2061-2010, 2010.
IGCAS, Institute of Geography, ChineseAcademy of Sciences: Dig-itized vegetation map of China, Beijing, National Laboratory for GIS and Remote Sensing, 1996.
International Energy Agency (IEA): CO Emissions from Fuel Com-bustion 2011 Edition, IEA, Paris, 134 pp., 2011.
Ito, A.: The regional carbon budget of East Asia simu-lated with a terrestrial ecosystem model and validated us-ing AsiaFlux data, Agric. For. Meteorol., 148, 738–747, doi:10.1016/j.agrformet.2007.12.007, 2008.
Janssens, I. A., Freibauer, A., Ciais, P., Smith, P., Nabuurs, G. J., Folberth, G., Schlamadinger, B., Hutjes, R. W. A., Ceule-mans, R., Schulze, E. D., Valentini, R., and Dolman, A. J.: Europe’s terrestrial biosphere absorbs 7 to 12 % of
Euro-pean anthropogenic CO2emissions, Science, 300, 1538–1542,
doi:10.1126/science.1083592, 2003.
Janssens, I. A., Dieleman, W., Luyssaert, S., Subke, J. A., Re-ichstein, M., Ceulemans, R., Ciais, P., Dolman, A. J., Grace, J., Matteucci, G., Papale, D., Piao, S. L., Schulze, E. D., Tang, J., and Law, B. E.: Reduction of forest soil respiration in response to nitrogen deposition, Nat. Geosci., 3, 315–322, doi:10.1038/ngeo844, 2010.
Jeong, S. J., Ho, C. H., Brown, M. E., Kug, J. S., and Piao, S. L.: Browning in desert boundaries in Asia in recent decades, J. Geo-phys. Res.-Atmos., 116, doi:10.1029/2010jd014633, 2011.
Keeling, C. D. and Whorf, T. P.: Atmospheric CO2Records from
Sites in the SIO Air Sampling Network, in Trends: a Com-pendium of Data on Global Change, Carbon Dioxide Inf. Anal. Cent. Oak Ridge Natl. Lab., Oak Ridge, Tenn, 2005.
Kohlmaier, G., Kohlmaier, L., Fries, E., and Jaeschke, W.: Applica-tion of the stock change and the producApplica-tion approach to Har-vested Wood Products in the EU-15 countries: a comparative analysis, Eur. J. For. Res., 126, 209–223, doi:10.1007/s10342-006-0130-x, 2007.
Krinner, G., Viovy, N., de Noblet-Ducoudre, N., Ogee, J., Polcher, J., Friedlingstein, P., Ciais, P., Sitch, S., and Prentice, I. C.: A dynamic global vegetation model for studies of the cou-pled atmosphere-biosphere system, Global Biogeochem. Cy., 19, GB1015, doi:10.1029/2003gb002199, 2005.
Law, R. M., Kowalczyk, E. A., and Wang, Y. P.: Using atmospheric CO2 data to assess a simplified carbon-climate simulation for the 20th century, Tellus B., 58, 427–437, doi:10.1111/j.1600-0889.2006.00198.x, 2006.
Lawrence, D., Oleson, K. W., Flanner, M. G., Thorton, P. E., Swen-son, S. C., Lawrence, P. J., Zeng, X. B., Yang, Z. L., Levis, S., Skaguchi, K., Bonan, G. B., and Slater, A. G.: Parameterization improvements and functional and structural advances in version 4 of the Community Land Model, J. Adv. Model. Earth Syst., 3, 27 pp., 2011.
Lee, S., Akimoto, H., Nakane, H., Kurnosenko, S., and Kinjo, Y.: Lower tropospheric ozone trend observed in 1989–1997 at Okinawa, Japan, Geophys. Res. Lett., 25, 1637–1640, doi:10.1029/98gl01224, 1998.
Levy, P. E., Cannell, M. G. R., and Friend, A. D.: Modelling the
impact of future changes in climate, CO2 concentration and
land use on natural ecosystems and the terrestrial carbon sink, Global Environ, Change-Human Policy Dimens., 14, 21–30, doi:10.1016/j.gloenvcha.2003.10.005, 2004.
Lin, J. C., Pejam, M. R., Chan, E., Wofsy, S. C., Gottlieb, E. W., Margolis, H. A., and McCaughey, J. H.: Attribut-ing uncertainties in simulated biospheric carbon fluxes to dif-ferent error sources, Global Biogeochem. Cy., 25, Gb2018, doi:10.1029/2010gb003884, 2011.