HAL Id: cea-00344262
https://hal-cea.archives-ouvertes.fr/cea-00344262
Submitted on 13 Sep 2019HAL is a multi-disciplinary open access archive for the deposit and dissemination of sci-entific research documents, whether they are pub-lished or not. The documents may come from teaching and research institutions in France or abroad, or from public or private research centers.
L’archive ouverte pluridisciplinaire HAL, est destinée au dépôt et à la diffusion de documents scientifiques de niveau recherche, publiés ou non, émanant des établissements d’enseignement et de recherche français ou étrangers, des laboratoires publics ou privés.
Fractionation of Suwannee River fulvic acid and Aldrich
humic acid on α-Al_2O_3: spectroscopic evidence
Francis Claret, Thorsten Schäfer, Julien Brevet, Pascal E. Reiller
To cite this version:
Francis Claret, Thorsten Schäfer, Julien Brevet, Pascal E. Reiller. Fractionation of Suwannee River fulvic acid and Aldrich humic acid on α-Al_2O_3: spectroscopic evidence. Environmental Science and Technology, American Chemical Society, 2008, 42 (23), pp.8809-8815. �10.1021/es801257g�. �cea-00344262�
Fractionation of Suwannee River fulvic acid and Aldrich
humic acid on α-Al
2O
3: spectroscopic evidence
FRANCIS CLARET,1,† THORSTEN SCHÄFER,2JULIENBREVET,3 AND PASCAL E. REILLER1,*
1 Commissariat à l’Energie Atomique (CEA), CE Saclay, DEN/DANS/DPC/SECR/Laboratoire de
Spéciation des Radionucléides et des Molécules, Bâtiment 391-P.C. 33, F-91191 Gif-sur-Yvette CEDEX, France
2Institut für Nukleare Entsorgung (INE), Forschungszentrum Karlsruhe, D-76021 Karlsruhe, Germany,
3Université d’Evry Val d’Essonne, Laboratoire Analyse et Environnement pour la Biologie et
l’Environnement, CNRS UMR 8587, Bâtiment Maupertuis, Boulevard François Mitterrand, 91025 Evry CEDEX, France.
* Corresponding author e-mail: pascal.reiller@cea.fr
† Present address BRGM, Environment and Process Division, 3 avenue Claude Guillemin, F-45060
Orleans CEDEX 2, France.
Environmental Science & Technology (42 (23), 8809-8815
http://doi.org/10.1021/es801257g
ABSTRACT
Sorptive fractionation of Suwannee River Fulvic Acid (SRFA) and Purified Aldrich Humic Acid (PAHA) on Al2O3 at pH 6 was probed in the supernatant using different spectroscopic techniques. Comparison
of dissolved organic carbon (DOC) analysis with UV/Vis spectrophotometric measurements at 254 nm, including Specific UV absorbance (SUVA) calculation, revealed a decrease in chromophoric compounds for the non-sorbed extracts after a 24 h contact time. This fractionation, only observable below a certain ratio between initial number of sites of humic substances and of Al O , seems to indicate a higher
confirmed this trend and points to a decrease in phenolic moieties in the supernatant and to an eventual increase in phenolic moieties on the surface. Time-resolved luminescence spectroscopy (TRLS) of Eu(III) as luminescent probe showed a decrease in the ratio between the 5D
0→7F2 and 5D0→7F1 transitions for
the fractionated organic matter (OM) that is thought to be associated to a lower energy transfer from the OM to Eu(III) due to the loss of polar aromatics. These modifications in the supernatant are a hint for the modification of sorbed humic extracts on the surface.
1 Introduction
Sorption to mineral surfaces and complexation by natural organic matter (NOM) are important processes influencing the cycling of toxic metals in the environment (1, 2). Metal sorption onto oxides and clays and metal binding to NOM, e.g., humic substances (HS) composed mainly of humic and fulvic acids (HA and FA), have been extensively studied. NOM influences metal migration (3), organic contaminant transport (4), and colloids stabilities (5, 6).
However, the specific interactions between metal cations and NOM, both in interactions with a mineral surface, are still matters of debate. The use of linear combinations of binary systems to describe ternary systems was sometimes successful (2, 7-9), but also showed significant deviations under varying HA, FA, and metal concentrations (2, 10-14), or need a semi-empirical refinement of the models (15). More recently, Weng et al. proposed the ADAPT model to account for the differences in electrostatic and chemical binding of FA and HA (16). Explanations of these discrepancies can be modifications of NOM conformation and/or composition during sorption, which can be viewed as a modification of the system ‘free energy’ (2, 16-18).
A preferential adsorption of high molecular weight fractions on oxides or kaolinite occurs in the case of aquatic NOM (19-21), whereas the adsorption of low molecular weight fractions was proposed for Aldrich HA on hematite (22, 23). NOM fractionation on mineral surfaces seems to depend both on the NOM origin and on the mineral. The binding of HS to mineral surface is a combination of (i) ligand exchange reaction, via carboxylic and phenolic functions, (ii) electrostatic interaction between positively charged minerals and negatively charged humic samples, (iii) possible cation bridging, and (iv) hydrophobic interactions between more or less hydrophobic moieties. It has been shown that changes in electrostatic description of HS sorbed on minerals have to be accounted for the description of their sorption (16), and that sorption on minerals (24) and change in ionic strength (25) do influence the hydrophobicity of humic sample.
Various techniques have been used to identify NOM fractionation such as chromatographic techniques based on size separation. These techniques are somehow biased by additional fractionation where UV-Visible detection alone is not totally appropriate (26-28). Despite all these efforts, the identification at the molecular scale is still difficult (29, 30). There is a need of molecular level understanding of the sorptive fractionation processes.
HS have being used as a surrogate to estimate NOM properties. It was proposed that HS aggregation results from self-assembled molecules (31-35). The dimension of the smallest observable object is about some nanometres composing larger aggregates of some hundreds of nanometres (34). Fulvic acids only form aggregates at very high concentration (35).
In this work, we combine results of four different techniques to obtain complementary views on the HS sorptive fractionation on α-Al2O3 carrying aluminol sites: UV-visible absorption (UV-Vis), total organic
carbon analysis (TOC), C(1s) near edge X-ray fine structure spectroscopy (NEXAFS) and time-resolved luminescence spectroscopy (TRLS). UV-visible absorption spectra of HS are supposed to give little structural information about the functionality due to the lack of detailed and characteristic bands (36). Its use for determining HS concentration remaining in solution after sorption is unreliable (20). However, a decomposition of UV-Vis spectra to monitor the properties of NOM has been proposed (37). Considering that HS contains ‘building block molecules’ that differ by their substituents (31, 32), one can see HS, in a first approximation, as a distribution of chromophores (38). TOC analysis is the most appropriate to determine accurately the concentration of humic substances (20). Specific UV-Vis Absorbance (SUVA=A254 nm/TOC), is a useful approach for probing aromaticity of humic samples (39).
Synchrotron-based C(1s) NEXAFS have being more recently applied to NOM study and provided semi-quantitative data on the carbon types or modification in NOM samples (40-43). TRLS have being used to study interactions of lanthanides (Ln) and actinides (An) with different organic media and to probe their chemical environment in HS (44-47). Both the spectra and luminescence bi-exponential decays of Ln-HS complexes are remarkable and permit to distinguish humic complexation from a more classical organic complexation (48, 49). Hence, using europium (III) as a luminescence probe allows obtaining a complementary view of fractionation changes in the metal binding environment.
2 Materials and Methods
2.1 Sorption Experiments.
Millipore deionized water (Alpha-Q, 18.2 MΩ cm) was used. SRFA is used as received from the International Humic Substance Society; its total site concentration QSRFA=7.4 mmol/g is taken from ref
50. Purified Aldrich Humic Acid (PAHA) was treated following the procedure describing in ref 51, with
QPAHA=5.34 mmol/g (50). QHS were obtained in the framework of the NICA-Donnan model, which was
applied afterward to determine the actual functionality under our conditions. Alpha alumina (Interchim, Montluçon, France) has a total site capacity for exchange of anions Qα-Al2O3=24 µmol/g, and the surface
properties used hereafter to determine the functionality under our conditions are in ref 52. Carbonates were removed from α-Al2O3 surface as described in (52); the isoelectric point pHIEP 9.5 was determined
by zeta potential measurement (data not shown). Europium (III) stock solution was obtained from the dissolution of Eu2O3 (Johnson Matthey, 99.99%) in HClO4 70% (Merck, GR for analysis).
Sorption studies were performed at pH 6.1 ± 0.1 because of the high variation of sorption results awaited for this kind of mineral phase vs. HS concentration (16). All the suspensions, solutions, and dilutions were done by weighing. The ionic strength I was fixed with NaClO4 to 0.1 mol/kgH2O (m) and pH was adjusted
using freshly prepared NaOH and HClO4. The pH measurements were done using a combined-glass
electrode (Radiometer Analytical XC111) calibrated for its linear response with a 0.01 m HClO4 solution,
an equimolal 0.02 m NaH2PO4/Na2HPO4 solution, and an equimolal 0.02 m Na2CO3/NaHCO3 solution,
all containing NaClO4 to keep [Na+] constant at 0.1 m (pH=2, 6.785, and 9.9 respectively). The electrode
filling solution was modified with NaClO4 0.1 m, NaCl 10-2 m to prevent KClO4 precipitation in the frit
Batch sorption experiments were conducted at room temperature (22 ± 1 °C). Weighed aliquots of α-Al2O3, NaClO4, and humic solution, were suspended in milli-Q water. The detailed results are presented
in Table S1 in supplemental information (SI). The suspensions were shaken for 24 hours and pH was measured afterwards until a constant value was reached (usually 2 to 4 hours). This contact time is sufficient to obtain a quasi-equilibrium. Some works seem to indicate that exchange between the HS, or NOM sub-fractions, is still occurring up to 900 days (22, 53).
The solid phase was separated via a pre-centrifugation step performed in 30 mL Nalgene 3137-0030 centrifuge vials (50,000 g for 1 hour); the supernatant was then ultra-centrifuged in order to settle remaining colloidal particles in 10 mL Beckman 355603 vials (246,960 g for 1 hour). Modifications of the HS composition induced by this centrifugation steps can be ruled out as for the PAHA/α-Fe2O3 system
(30). No filtration step was done before absorbance measurement and particular caution was taken during the sampling to avoid resuspended colloidal particles. Supernatant spectra were consecutively measured using a Shimadzu UV-3150 spectrophotometer and TOC in solution was determined with a Shimadzu 5000 TOC analyzer after acidification and purging with argon. The uncertainties of the determinations were obtained from the regression analyses of the calibrations curves built from weighed aliquots of HS.
2.2 C(1s) NEXAFS
Carbon K-edge NEXAFS spectra were measured at the Scanning Transmission X-ray Microscopy (STXM) beamline X1A1 (NSLS), operated by the State University of New York at Stony Brook, USA. The principle of the methods is described elsewhere (54). STXM sample preparation was performed by drying 1 µL of HS solution for supernatant, and after deposition of the HS-covered α-Al2O3, on a Si3N4
window (100 nm thick). For the supernatant, depending on the organic concentration the spectra was either (i) extracted from images taken at different energies across the absorption edge (stacks method) after aligning them using cross-correlation (55), or (ii) measured by the point spectra procedure (43). The two methods gave comparable results on the same samples. The spectra of the HS-covered α-Al2O3
samples had a very low signal to noise ratio. Energy calibration of the spherical grating monochromator was achieved by using the photon energy of the 290.74 eV CO2 gas adsorption band (56). For comparison,
all NEXAFS spectra were baseline corrected and normalized to 1 at 295 eV.
2.3 Analysis of UV/Vis spectra.
UV/Vis spectra of HS show a classical strong steady increase with decreasing wavelength. In HS, the majority of the chromophores that absorbs in UV are aromatic groups with various degrees of substitution (37, 57). In analogy to benzene, a simplified decomposition approach to allow a better understanding of the chromophoric group functionalities was proposed (37). The 200-400 nm region represents three simulated bands; a very intense local excitation band (LE) around 180 nm, a benzenoid band (Bz) around 203 nm due to vibrational perturbations in the -electron system, and a low intensity electron transfer band (ET) around 253 nm due to strong quantum-mechanical prohibition but strongly affected by the presence of polar groups. The spectra are then fitted with the sum of the three Gaussians using a non-linear regression fitting procedure.
2.4 TRLS
Europium(III) was used to probe the luminescence properties in the supernatant. Eu(III) shows a luminescence spectrum corresponding to the 5D
0→7Fj transition manifold (58). The luminescence
properties of Eu(III) in the supernatant were compared to those in the original humic samples.
The excitation laser beam was generated by a 355 nm tripled output of a Continuum Nd-YAG laser, coupled to an optical parametric oscillator system (Panther II, Continuum, USA). The wavelength was tuned to 394.6 nm, providing about 1.6 mJ of energy in a 5 ns pulse with a repetition rate of 10 Hz. The luminescence signal is collected at 90° and focused into an Andor spectrometer (550-650 nm, resolution 0.2 nm). The signal is collected during a gate width of 300 µs, at a gate delay of 10 µs after excitation by the laser flash. To increase the signal to noise ratio, every spectrum was accumulated 1,000 times. Emission spectra were recorded between using a CCD camera cooled at -15°C. Only 5D
0→7F0 (around
580 nm), 5D
0→7F1 (around 593 nm), and 5D0→7F2 (around 615 nm) bands can be observed. Before TRLS
measurement the pH was adjusted to 4 to limit the signal from EuOH2+ and EuCO
3+ at pH 6.
3 Results and Discussion
3.1 UV/VIS, TOC, and SUVA analyses.
In Figure 1a, the distribution coefficients: Rd (mL/g) = [HS][HS]sorbed (mol/g) solution mol/mL = [HS]sorbed [HS]initial - [HS]sorbed × V (mL) mα-Al2O3 (g) (1), of sorbed HS onto α-Al2O3 are plotted vs. the ratio RHS of initial available sites in HS and α-Al2O3 defined
as:
RHS
(
mol.g-1HS /mol.g-1α-Al2O3)
=QHS (mol.g-1HS)
Qα-Al2O3 (mol.g-1α-Al2O3)
× CHS(mgHS.kg
-1 H2O)
Cα-Al2O3(mgα-Al2O3.kg-1H2O)
(2). The Rd notation reflects that under our conditions the final hypothetical equilibrium conditions is not
reached and that reversibility is not ascertained (59). The concentrations of HS are either determined from the calibration in UV-Vis, which is known to be biased for sorbed samples (26), and in TOC. The adsorption isotherms are reported in SI (Figure S1a). The sorption is constant between 1 and 48 hours (data not shown) and there is no evolution of the SUVA vs. time for RPAHA = 10.4 (Figure S1b). The latter
figure confirmed that fast HS sorption was occurring on aluminum oxides as it had already been noticed for iron oxides (20).
a
R
HS(
mol.g-1;HS/mol.g-1;α-Al2O3)
b
R
HS(
mol.g-1;HS /mol.g-1;α-Al2O3)
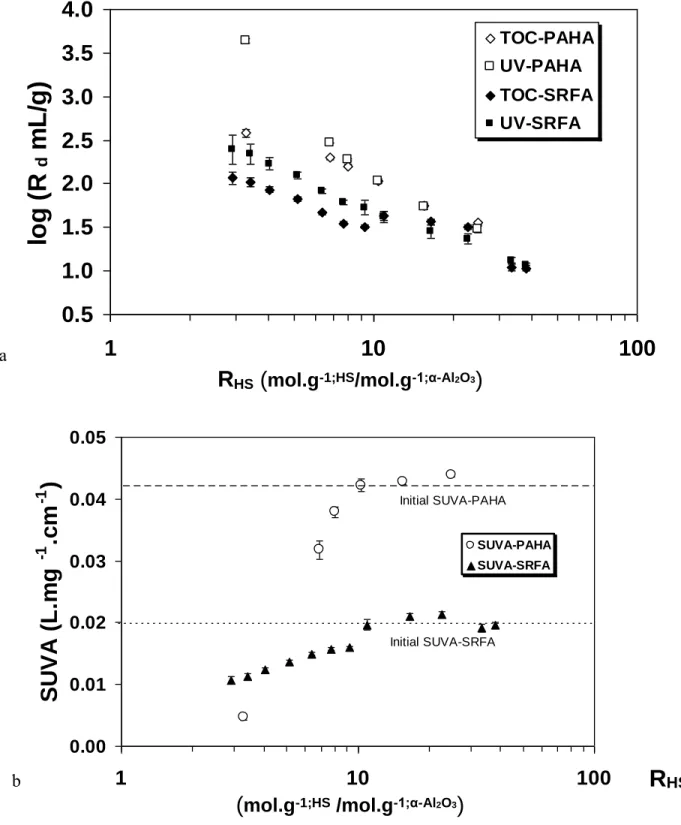
Figure 1. Evolution of Rd (mL/g) for SRFA (closed symbols) and PAHA (open symbols) adsorbed on
-Al2O3 determined in UV-Vis (square) and TOC (diamonds) as a function of RHS (a), and SUVA from
the same experiments for PAHA () and SRFA () (b), pH 6, I=0.1 m.
RHS can be viewed as a dimensionless number representing the amount of humic sites present on the
mineral surface that bears its own functionality. It could permit to directly compare different sets of experiments done under different concentration conditions, different functionalities (humic and fulvic, hydroxides and oxides) or different surface properties (silica, iron or aluminum oxides). It could also be
0.5
1.0
1.5
2.0
2.5
3.0
3.5
4.0
1
10
100
R (mol.g
-1HS/mol.g
-1α-Al
2O
3)
log
(
R
dm
L/
g)
TOC-PAHA UV-PAHA TOC-SRFA UV-SRFA 0.00 0.01 0.02 0.03 0.04 0.051
10
100
R (mol.g
-1HS/ mol.g
-1α-Al
2O
3)
SU
VA
(L
.m
g
-1.c
m
-1)
SUVA-PAHA SUVA-SRFA Initial SUVA-SRFA Initial SUVA-PAHAused to evidence an overcompensation of humic functionality compared to the available surface sites as in ref 60. Application to clays could be more difficult.
In Figure 1a, Rd(PAHA) > Rd(SRFA) as in ref 61. When RHS<10, Rd obtained by UV/Vis are higher
than determined by TOC. This can also be seen on the normalized absorption spectra (Figure S2 and S3 of SI). This was observed for NOM sorption on oxides (20, 37). The SUVA in Figure 1b monitors the same trend. Initial SUVA for PAHA is more important than SRFA due to a more important specific absorbance. This representation results in a change in slope around RHS≈10 corresponding to the point
where UV/Vis and TOC do not correspond (Figure 1a). The greater decrease in SUVA for PAHA indicates a greater fractionation of aromatic moieties. The fractionation is thus only observable when RHS10 but is occurring under all RHS conditions. This loss of polar aromatic in the supernatant must
imply an enrichment of aromatic moieties at the surface.
3.2 NEXAFS analyses and UV/Vis decompositions.
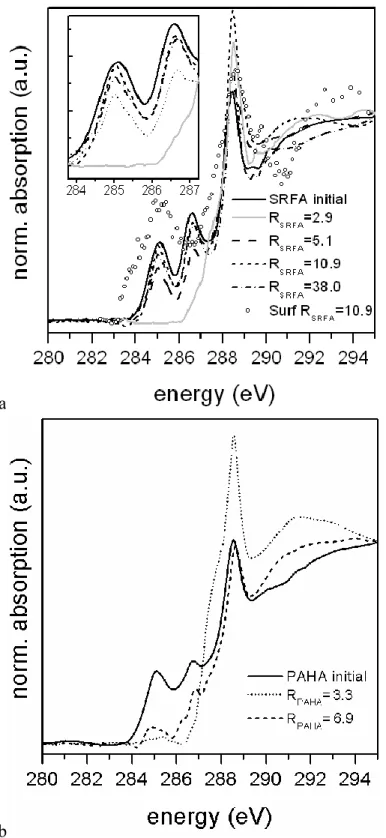
C(1s) NEXAFS measurements are presented on Figure 2a,b for HS supernatants. Only the HS-covered α-Al2O3 sample having RHS 10.9 were analyzed. These spectra revealed very low signal to noise ratio
compared to the quality of data for clays (62). The most plausible reason of these low signal is a more homogeneous covering of oxides and the occurrence of more dense and ‘strong spots’, on the Callovo-Oxfordian argillite. Only data for the most concentrated sample, i.e., RSRFA = 10.9, could be analyzed
(Figure S4 and Figure 2a).
The detailed band assignment of FA via correlation with 1H and 13C NMR is referred to ref 40, knowing
that uncertainties exist when transferring the band assignment to other organic systems both concerning the absolute intensity response of electron transitions and assignment of functional groups due to overlapping resonance ranges of electron transitions (63).
The spectra of the initial HS show three main peaks at 285.2, 286.6, and 288.6 eV corresponding to the C(1s)→π* transitions. The 285.2 eV band corresponds to aromatic C–C or C–H bonds (64). The 286.6 eV
transition can be assigned to aromatic C–O (phenols) or C–X (halogen) bonds (64). The most intense band around 288.6 eV is related to the oscillation strength of the C=O bonds of carboxylic groups (65, 66). This latter peak is clearly asymmetric providing evidence that both the 289.5 eV transition, assigned to the O-alkyl group of alcohols/carbohydrates, and the mixed Rydberg valence band around 287.4 eV, generally assigned to aliphatic groups, are masked (67). The very small 290.2 eV peak can be assigned to remaining carbonates (68).
A steady decrease in aromatic and phenol-type groups occurs when RHS6. This effect is pronounced
for RSRFA=2.9. The same trend is observed for PAHA, but a strong fractionation of aromatics is still visible
at RPAHA=6.9, whereas at RSRFA=10.9 the spectrum looks already similar to initial SRFA.
The C(1s) NEXAFS spectra confirm the SUVA results and give a direct spectroscopic proof that the observed difference between TOC and UV/Vis can be likely both attributed to a reduction of aromatic functional group (peak decrease at 285 eV) and chromophoric groups with polar aromatic functionalities,
a
b
Figure 2. C(1s) NEXAFS spectra obtained before sorption (plain line), for the supernatant after adsorption
on -Al2O3 for different ratio RHS for SRFA (grey RSRFA = 2.9, dashed RSRFA= 5.1, dotted RSRFA = 10.9,
dash-dot RSRFA = 38), and smoothed spectrum for HS-covered α-Al2O3 at RSRFA = 10.9 (original spectrum
in Figure S4) (a), and supernatant PAHA (dashed RPAHA = 6.9, dotted RPAHA = 3.3) (b), pH 6.1, I=0.1 m.
Even if the spectrum of HS-covered α-Al2O3 sample at RSRFA = 10.9 was exhibiting a low signal to
noise ratio (Figure S4), two peaks can be distinguished, around 285 eV and 289 eV. A Savitzky-Golay smoothing (5 points, Origin 8.0) was applied to the spectrum giving the circles on Figure 2a. Other solid
the contribution around 285.2 eV (aromatic carbons) is higher than both the initial SRFA and the corresponding fractionated SRFA. The contribution around 288.6 eV (carboxylic carbons) is slightly higher than the original sample and comparable to the fractionated sample. It could be inferred that enrichment of aromatic moieties on the mineral surface is occurring, but considering the extensive smoothing, these data should be taken with great care.
UV/Vis spectra were decomposed following ref 37 (see equation S2, Figure S2 and S3, Table S1 and S2 in SI), giving A0,LE, A0,Bz, and A0,ET the maximum absorbance of the LE, Bz, and ET bands,
respectively; ΔLE, ΔBz, and ΔET the full widths at mid height of the decomposed bands; E0,LE, E0,Bz, and
E0,ET are fixed at 180 nm, 203 nm, and 253 nm, respectively (37). The A0,Et/A0,Bz ratios, which monitors
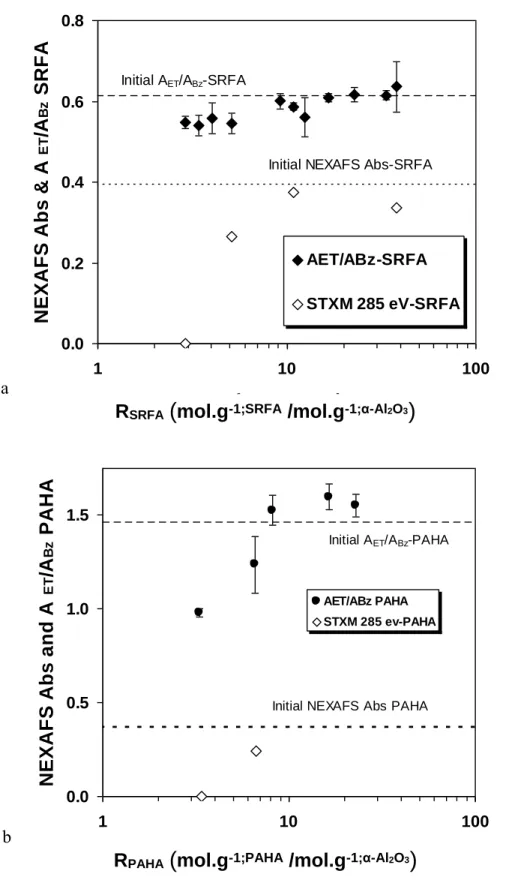
the proportion of aromatics that contains polar groups, are plotted vs. RHS (Figure 3). In the region of
comparable UV/Vis and TOC (RHS>10), A0,ET/A0,Bz≈0.6 for SRFA and A0,ET/A0,Bz≈1.2 for PAHA
indicating that PAHA contains more polar aromatic groups (37). For RSRFA<10, A0,Et/A0,Bz is slightly but
significantly decreasing to values around 0.5. This decrease is more pronounced for PAHA and is in line with SUVA evolution. This is an indication of a stronger fractionation of PAHA as seen in SUVA and STXM. This is also due to the increasing importance of the LE band in the fit (Table S1 and S2 in SI), which decreases the relative importance of A0,Bz. The decrease of A0,ET/A0,Bz and of ΔET/ΔBz (Figure S5
of the SI), and the increase of A0,LE (Table S1 in SI) indicate preferential removal of HS molecules that
contain higher than average concentrations of aromatic units activated with oxygen-containing functional groups in the supernatant, i.e. phenolic, benzoic, aromatic esters and carbonyl groups (37, 57). This is in line with the loss of phenolic groups in NEXAFS, and with the PAHA/α-Fe2O3 system (30). Another
interpretation might be a hypochromism effect (69), which would imply a reversible self-association of molecules. A combination of the two phenomena is more likely.
The correlation between NEXAFS and A0,Et/A0,Bz presented in Figure 3 confirms that the changes in
slopes are occurring for RHS≈10; we cannot fully ascertain the trend for PAHA. The phenomena
underlying UV-Vis and NEXAFS are not directly comparable but the trends are strikingly similar. Direct correlations are useless for the moment being as when RHS3.5 no aromatics can be detected in STXM.
a
RSRFA
(
mol.g-1;SRFA /mol.g-1;α-Al2O3)
b
RPAHA
(
mol.g-1;PAHA /mol.g-1;α-Al2O3)
Figure 3. The A0,ET/A0,Bz and NEXAFS peak height for SRFA (a) and PAHA (b) for different ratios of
available sites, pH 6,1, I=0.1 m. The original data are reported in Figure S2 and S3, and in Table S1 and S2 of the SI 0.0 0.2 0.4 0.6 0.8 1 10 100
R (mol.g
-1HS/mol.g
-1α-Al
2O
3)
N E X A F S A b s & A ET /A Bz S R F A AET/ABz-SRFA STXM 285 eV-SRFA Initial AET/ABz-SRFAInitial NEXAFS Abs-SRFA
0.0 0.5 1.0 1.5
1 10 100
R (mol.g
-1HS/mol.g
-1α-Al
2O
3)
N E X A F S A b s a n d A ET /A Bz P A H A AET/ABz PAHA STXM 285 ev-PAHA Initial AET/ABz-PAHA
3.3 TRLS.
The ratio between 5D
0→7F2and 5D0→7F1 bands (under our conditions 7F2/7F1 = I615 nm/I593 nm) is an
indication of the chemical environment of Eu(III); the 5D
0→7F2 transition is hypersensitive to changes in
the chemical environment. In Figure 4, 7F
2/7F1 are plotted vs. [Eu(III)]/TOC (µmolEu/mgC) for
experiments with supernatants and the original HS. For aqueous Eu3+, 7F
2/7F1=0.25 (dash-dotted line) (44,
49), whereas for a complete binding of Eu(III) to HS, i.e. [Eu]/TOC=0.03, 7F
2/7F1≈2.5 as in ref 45. The
increase is slightly steeper in the case of PAHA0 when compared to the available functionality (QPAHA =
1.75 mmol/g, and QSRFA = 3.9 mmol/g at pH 4, see figure S6 in SI), indicating that PAHA seems to have
slightly stronger complexation capacity for lanthanides-actinides (III) than SRFA, which was also shown for other samples (70, 71).
For the supernatant, when RHS10, the 7F2/7F1 evolution is close to original samples;conversely, when
RHS10, 7F2/7F1 decreases for comparable [Eu]/TOC ratio. One can remark that 7F2/7F1 evolutions are
similar for RSRFA=16.5 and RPAHA=15.9, and that the increase at RSRFA=5.1 is slightly lower that for
RPAHA= 6.9.
Energy transfer from the excited state of the complexed ligand to the 5D
0 level of Eu(III), leading to a
luminescence enhancement, is generally taking place over the triplet levels in the chromophores via the ‘antenna effect’ (72). It could be inferred that this energy transfer is less efficient for fractionated organic matter due to the loss of polar aromatic moieties. For the supernatant at RSRFA=5.1, 7F2/7F1≈1 when
[Eu]/TOC = 0.03 µmolEu.g-1C as for complete complexation of glycolic acid (49); for RPAHA=3.3, when
[Eu]/TOC = 0.08 µmolEu.g-1C, 7F2/7F1 ≈ 0.5 indicating a more pronounced decrease in energy transfer, in
agreement with STXM, A0,ET/A0,Bz, and SUVA.
The evolutions of 7F
2/7F1 vs. [Eu]/TOC on Figure 4 look like complexation isotherms. It was not
possible to perform acid-base titrations of HS in the supernatant because of their low concentration. Furthermore, it was not possible to attain the plateau indicating the complete complexation, it is then impossible to calculate any interaction parameter related to a number of sites. Nonetheless, it seems that the supernatants have a lesser degree of interaction with Eu(III) than original samples as the half reaction point is shifted to higher carbon concentrations with decreasing RHS values. It seems then that humic and
fulvic acids in the supernatant have a lesser affinity with Eu3+. It is up to now not possible to conclude on
this matter as long as the functionality of sorbed fulvic fraction cannot be quantified. Should non-sorbed sample be different from the original samples, then non-sorbed samples should also have different properties than the original humic substances due to the relative enrichment of both polar aromatic groups at the surface, as postulated from STXM results, and modification of functionality (4).
a
b
Figure 4. Evolution of the 7F2/7F1 peak height ratio as a function of [Eu(III)]/TOC (µmolEu.L-1/mgC.L-1)
for SRFA (a) and PAHA (b), and for different values of RHS, pH 4.0, I=0.1 m: dash-dotted line is the
7F
2/7F1 ratio of Eu3+ at pH 4.
Acknowledgment. We acknowledge beamtime allotment by BNL/NSLS, B. Amekraz and C. Moulin
from CEA for helpful discussions, anonymous reviewers for contributing in the manuscript enhancement, and Pr. Ruben Kretzschmar for his patience in editorial handling. This work was financed through the ‘FUNMIG project’ (EC: FUNMIG-NUWASTE-2004-3.2.1.1-1), the ‘OMMI’ project
(MERG-CT-2005-0.0 0.5 1.0 1.5 2.0 2.5 3.0 0.01 0.1 1 10
[Eu] (µmol.L
-1) / [SRFA] (mg
C.L
-1)
7F
2/
7F
1=
I
6 1 5 nm/I
5 9 3 nm R = 5.1 R = 16.5 SRFA0 0.0 0.5 1.0 1.5 2.0 2.5 3.0 0.01 0.1 1 10[Eu] (µmol/L) / [PAHA] (mg
C/L)
7F
2/
7F
1=
I
6 1 5 nm/I
5 9 3 nm R = 3.3 R = 6.9 R = 15.6 PAHA0012338), and the MRTRA project of the Risk Control Domain (CEA/DEN/DDIN/MRTRA) and the CHSOL project of the Basic Research Domain (CEA/DEN/DSOE/RdB) of CEA.
The supplemental information gives: the sorption isotherm expressed as free HS concentration vs. total HS concentration; the kinetic evolution of SUVA and sorption % for RPAHA = 10.4; the normalized
UV-Vis absorbance spectra of initial SRFA, PAHA, and supernatants after sorption on α-Al2O3 at pH 6.1 for
different values of available sites ratio RHS; the initial spectrum of HS-covered α-Al2O3 sample at RSRFA
= 10.9; illustration of the parallel evolution of the intensities of the ET and Bz bands, A0,ET/A0,Bz, and of
the width ratio ΔET/ΔBz, and 7F2/7F1 ratios vs. [Eu]/[HS] (molEu.mol-1;site) for original HS samples. The
experimental data including pH, actual concentration of α-Al2O3, SRFA, and PAHA, distribution
coefficients are given as well as results of the fits and the fitting parameters and fitting uncertainties. Illustration of the parallel evolution of the intensities of the ET and Bz bands, A0,ET/A0,Bz, and of the width
ratio ΔET/ΔBz are also given. This information is available free of charge via the Internet at
http://pubs.acs.org.
4 References
(1) Kretzschmar, R.; Schäfer, T. Metal retention and transport on colloidal particles in the environment. Elements 2005, 1, 205-210. (2) Heidmann, I.; Christl, I.; Kretzschmar, R.
Sorption of Cu and Pb to kaolinite-fulvic acid colloids: Assessment of sorbent interactions. Geochim. Cosmochim. Acta 2005, 69, 1675-1686.
(3) Artinger, R.; Kienzler, B.; Schußler, W.; Kim, J. I. Effects of humic substances on the
241Am migration in a sandy aquifer: column
experiments with Gorleben groundwater/sediment systems. J. Contam.
Hydrol. 1998, 35, 261-275.
(4) Hur, J.; Schlautman, M. A. Influence of humic substance adsorptive fractionation on pyrene partitioning to dissolved and mineral-associated humic substances.
Environ. Sci. Technol. 2004, 38, 5871-5877.
(5) Tipping, E.; Higgins, D. C. The effect of adsorbed humic substances on the colloid stability of haematite particles. Colloids and
Surfaces 1982, 5, 85-92.
(6) Kretzschmar, R.; Hesterberg, D.; Sticher, H. Effects of adsorbed humic acid on surface charge and flocculation of kaolinite. Soil
Sci. Soc. Am. J. 1997, 61, 101-108.
(7) Zachara, J. M.; Resch, C. T.; Smith, S. C. Influence of humic substances on Co2+
sorption by a subsurface mineral separate and its mineralogic components. Geochim.
Cosmochim. Acta 1994, 58, 553-566.
(8) Murphy, R. J.; Lenhart, J. J.; Honeyman, B. D. The sorption of thorium (IV) and uranium (VI) to hematite in the presence of natural organic matter. Colloids Surf. A 1999, 157, 47-62.
(9) Lenhart, J. J.; Honeyman, B. D. Uranium(VI) sorption to hematite in the presence of humic acid. Geochim.
Cosmochim. Acta 1999, 63, 2891-2901.
(10) Vermeer, A. W. P.; McCulloch, J. K.; van Riemsdijk, W. H.; Koopal, L. K. Metal ion adsorption to complexes of humic acid and metal oxides: Deviation from the additivity rule. Environ. Sci. Technol. 1999, 33, 3892-3897.
(11) Christl, I.; Kretzschmar, R. Interaction of copper and fulvic acid at the hematite-water interface. Geochim. Cosmochim. Acta 2001,
65, 3435-3442.
(12) Robertson, A. P., Goethite/humic acid interactions and their effects on copper(II) binding. Ph. D Thesis, Stanford University,
(13) Robertson, A. P.; Leckie, J. O. Humic acid/goethite interactions and their effet on copper binding. In Humic substances in the
global environment and implication on human health; Senesi, N., Miano, T. M.,
Eds. Elsevier, 1994.
(14) Samadfam, M.; Sato, S.; Ohashi, H. Effects of humic acid on the sorption of Eu(III) onto kaolinite. Radiochim. Acta 1998, 82, 361-365.
(15) Lumsdon, D. G. Partitioning of organic carbon, aluminium and cadmium between solid and solution in soils: application of a mineral-humic particle additivity model.
Eur. J. Soil Sci. 2004, 55, 271-285.
(16) Weng, L.; Van Riemsdijk, W. H.; Hiemstra, T. Adsorption of humic acids onto goethite: Effects of molar mass, pH and ionic strength. J. Colloid Interface Sci. 2007, 314, 107-118.
(17) Ochs, M.; Cosovic, B.; Stumm, W. Coordinative and hydrophobic interaction of humic substances with hydrophilic Al2O3
and hydrophobic mercury surfaces.
Geochim. Cosmochim. Acta 1994, 58,
639-650.
(18) Weng, L. P.; Van Riemsdijk, W. H.; Hiemstra, T. Adsorption free energy of variable-charge nanoparticles to a charged surface in relation to the change of the average chemical state of the particles.
Langmuir 2006, 22, 389-397.
(19) Davis, J. A.; Gloor, R. Adsorption of dissolved organics in lake water by aluminum oxide. Effect of molecular weight. Environ. Sci. Technol. 1981, 15, 1223-1229.
(20) Gu, B.; Schmitt, J.; Chem, Z.; Liang, L.; McCarthy, J. F. Adsorption and desorption of natural organic matter on iron oxide: Mechanisms and models. Environ. Sci.
Technol. 1994, 28, 38-46.
(21) Meier, M.; Namjesnik-Dejanovic, K.; Maurice, P.; Chin, Y.-P.; Aiken, G. R. Fractionation of aquatic natural organic
matter upon sorption to goethite and kaolinite. Chem. Geol. 1999, 157, 275-284. (22) Hur, J.; Schlautman, M. A. Molecular
weight fractionation of humic substances by adsorption onto minerals. J. Colloid
Interface Sci. 2003, 264, 313-321.
(23) Hur, J.; Schlautman, M. A. Effects of pH and phosphate on the adsorptive fractionation of purified Aldrich humic acid on kaolinite and hematite. J. Colloid
Interface Sci. 2004, 277, 264-270.
(24) Hur, J.; Schlautman, M. A. Effects of mineral surfaces on pyrene partitioning to well-characterized humic substances. J.
Environ. Qual. 2004, 33, 1733-1742.
(25) Schlautman, M. A.; Morgan, J. J. Effects of Aqueous Chemistry on the Binding of Polycyclic Aromatic-Hydrocarbons by Dissolved Humic Materials. Environ. Sci.
Technol. 1993, 27, 961-969.
(26) Gu, B.; Mehlhorn, T. L.; Liang, L.; McCarthy, J. F. Competitive adsorption, displacement, and transport of organic matter on iron oxide: I. Competitive adsorption. Geochim. Cosmochim. Acta 1996, 60, 1943-1950.
(27) Piccolo, A.; Conte, P. Molecular size of humic substances. Supramolecular associations versus macromolecular polymers (Reprinted from Advances in Environmental Research, vol 3, pg 508-521, 2000). Adv. Environ. Res. 1999, 3, -.
(28) Piccolo, A.; Conte, P.; Cozzolino, A. Chromatographic and spectrophotometric properties of dissolved humic substances compared with macromolecular polymers.
Soil Sci. 2001, 166, 174-185.
(29) Kaiser, K. Sorption of natural organic matter fractions to goethite (-FeOOH): Effect of chemical composition as revealed by liquid-state C-13 NMR and wet-chemical analysis.
Org. Geochem. 2003, 34, 1569-1579.
(30) Reiller, P.; Amekraz, B.; Moulin, C. Sorption of Aldrich humic acid onto
hematite: Insights into fractionation phenomena by electrospray ionization with quadrupole time-of-flight mass spectrometry. Environ. Sci. Technol. 2006,
40, 2235-2241.
(31) Plancque, G.; Amekraz, B.; Moulin, V.; Toulhoat, P.; Moulin, C. Molecular structure of fulvic acids by electrospray with quadrupole time-of-flight mass spectrometry. Rapid Commun. Mass
Spectrom. 2001, 15, 827-835.
(32) These, A.; Winkler, M.; Thomas, C.; Reemtsma, T. Determination of molecular formulas and structural regularities of low molecular weight fulvic acids by size-exclusion chromatography with electrospray ionization quadrupole time-of-flight mass spectrometry. Rapid Commun.
Mass Spectrom. 2004, 18, 1777-1786.
(33) Moulin, V.; Reiller, P.; Amekraz, B.; Moulin, C. Direct characterization of iodine covalently bound to fulvic acids by electrospray mass spectrometry. Rapid
Commun. Mass Spectrom. 2001, 15,
2488-2496.
(34) Rice, J. A.; Tombácz, E.; Malekani, K. Application of light and X-ray scattering to characterize the fractal properties of soil organic matter. Geoderma 1999, 88, 251-264.
(35) Diallo, M. S.; Glinka, C. J.; Goddard, W. A.; Johnson, J. H. Characterization of nanoparticles and colloids in aquatic systems 1. Small angle neutron scattering investigations of Suwannee River fulvic acid aggregates in aqueous solutions.
Journal of Nanoparticle Research 2005, 7,
435-448.
(36) MacCarthy, P.; Rice, J. A. Spectroscopic methods (other than NMR) for determining functionality in humic substances. In Humic
substances in soil, sediment and water;
Aiken, G. R., McKnight, D. M., Wershaw, R. L., MacCarthy, P., Eds. John Wiley &
(37) Korshin, G. V.; Li, C.-W.; Benjamin, M. M. Monitoring the properties of natural organic matter through UV spectroscopy: A consistent theory. Water Res. 1997, 31, 1787-1795.
(38) Del Vecchio, R.; Blough, N. V. On the origin of the optical properties of humic substances. Environ. Sci. Technol. 2004, 38, 3885-3891.
(39) Korshin, G. V.; Kumke, M. U.; Li, C. W.; Frimmel, F. H. Influence of chlorination on chromophores and fluorophores in humic substances. Environ. Sci. Technol. 1999, 33, 1207-1212.
(40) Schäfer, T.; Buckau, G.; Artinger, R.; Kim, J. I.; Geyer, S.; Wolf, M.; Bleam, W. F.; Wirick, S.; Jacobsen, C. Origin and mobility of fulvic acids in the Gorleben aquifer system: implications from isotopic data and carbon/sulfur XANES. Org. Geochem. 2005, 36, 567-582.
(41) Scheinost, A. C.; Kretzschmar, R.; Christl, I.; Jacobsen, C. Carbon group chemistry of humic and fulvic acid: A comparison of C-1s NEXAFS and 13C-NMR spectroscopies.
Spec. Pub. Royal Soc. Chem. 2002, 273,
39-47.
(42) Claret, F.; Bauer, A.; Schäfer, T.; Griffault, L.; Lanson, B. Experimental investigation of the interaction of clays with high-pH solutions: A case study from the Callovo-Oxfordian formation, Meuse-Haute Marne underground laboratory (France). Clays
Clay Miner. 2002, 50, 633-646.
(43) Christl, I.; Kretzschmar, R. C-1s NEXAFS spectroscopy reveals chemical fractionation of humic acid by cation-induced coagulation. Environ. Sci. Technol. 2007,
41, 1915-1920.
(44) Plancque, G.; Moulin, V.; Toulhoat, P.; Moulin, C. Europium speciation by time-resolved laser-induced fluorescence. Anal.
laser-induced fluorescence spectroscopy applied to the Eu(III)-fulvate complexation.
Talanta 2005, 65, 389-395.
(46) Claret, F.; Schäfer, T.; Rabung, T.; Wolf, M.; Bauer, A.; Buckau, G. Differences in properties and Cm(III) complexation behavior of isolated humic and fulvic acid derived from Opalinus clay and Callovo-Oxfordian argillite. Appl. Geochem. 2005,
20, 1158-1168.
(47) Kumke, M. U.; Eidner, S.; Kruger, T. Fluorescence quenching and luminescence sensitization in complexes of Tb3+ and Eu3+
with humic substances. Environ. Sci.
Technol. 2005, 39, 9528-9533.
(48) Horrocks, W. D.; Sudnick, D. R. Lanthanide ion probes of structure in biology - Laser-induced luminescence decay constants provide a direct measure of the number of metal-coordinated water-molecules. J. Am.
Chem. Soc. 1979, 101, 334-340.
(49) Plancque, G.; Maurice, Y.; Moulin, V.; Toulhoat, P.; Moulin, C. On the use of spectroscopic techniques for interaction studies, part I: Complexation between europium and small organic ligands. Appl.
Spectrosc. 2005, 59, 432-441.
(50) Milne, C. J.; Kinniburgh, D. G.; Tipping, E. Generic NICA-Donnan model parameters for proton binding by humic substances.
Environ. Sci. Technol. 2001, 35, 2049-2059.
(51) Kim, J. I.; Buckau, G.; Li, G. H.; Duschner, H.; Psarros, N. Characterization of humic and fulvic acids from Gorleben groundwater. Fresenius J. Anal. Chem. 1990, 338, 245-252.
(52) Alliot, C.; Bion, L.; Mercier, F.; Toulhoat, P. Effect of aqueous acetic, oxalic, and carbonic acids on the adsorption of europium(III) onto alpha-alumina. J.
Colloid Interface Sci. 2006, 298, 573-581.
(53) van de Weerd, H.; van Riemsdijk, W. H.; Leijnse, A. Modelling the dynamic adsorption-desorption of NOM mixture: Effects of physical and chemical
heterogeneity. Environ. Sci. Technol. 1999,
33, 1675-1681.
(54) Jacobsen, C.; Williams, S.; Anderson, E.; Browne, M. T.; Buckley, C. J.; Kern, D.; Kirz, J.; Rivers, M.; Zhang, X. Diffraction-limited imaging in a scanning-transmission X-ray microscope. Optics Commun. 1991,
86, 351-364.
(55) Jacobsen, C.; Wirick, S.; Flynn, G.; Zimba, C. Soft X-ray spectroscopy from image sequences with sub-100 nm spatial resolution. J. Microsc. Oxford 2000, 197, 173-184.
(56) Hitchcock, A. P.; Mancini, D. C. Bibliography and database of inner-shell excitation-spectra of gas-phase atoms and molecules. J. Electron Microsc. Rel.
Phenom. 1994, 67, 1-132.
(57) Scott, A. I. Interpretation of ultraviolet
spectra of natural products; Pergamon
Press: New York, 1964.
(58) Bünzli, J. C. G. Luminescent probes. In
Lanthanides probe in life, chemical and earth sciences - Theory and practice;
Bünzli, J. C. G., Choppin, G. R., Eds. Elsevier: Amsterdam, 1989.
(59) Gu, B.; Schmitt, J.; Chem, Z.; Liang, L.; McCarthy, J. F. Adsorption and desorption of different organic matter fraction on iron oxide. Geochim. Cosmochim. Acta 1995, 59, 219-229.
(60) Vermeer, A. W. P.; van Riemsdijk, W. H.; Koopal, L. K. Adsorption of Humic Acids to Mineral Particles. 1. Specific and Electrostatic Interactions. Langmuir 1998,
14, 2810-2819.
(61) Schlautman, M. A.; Morgan, J. J. Adsorption of aquatic humic substances on colloidal-size aluminum-oxide particles - Influence of solution chemistry. Geochim.
Cosmochim. Acta 1994, 58, 4293-4303.
(62) Schäfer, T.; Claret, F.; Bauer, A.; Griffault, L.; Ferrage, E.; Lanson, B. Natural organic matter (NOM)-clay association and impact
on Callovo-Oxfordian clay stability in high alkaline Solution: Spectromicroscopic evidence. J. Phys. IV 2003, 104, 413-416. (63) Dhez, O.; Ade, H.; Urquhart, S. G.
Calibrated NEXAFS spectra of some common polymers. J. Electron Microsc.
Rel. Phenom. 2003, 128, 85-96.
(64) Cody, G. D.; Botto, R. E.; Ade, H.; Behal, S.; Disko, M.; Wirick, S. Inner-shell spectroscopy and imaging of a subbituminous coal - In-situ analysis of organic and inorganic microstructure using C(1S)-NEXAFS, Ca(2P)-NEXAFS, and C1(2S)-NEXAFS. Energy Fuels 1995, 9, 525-533.
(65) Urquhart, S. G.; Ade, H. Trends in the carbonyl core (C 1s, O 1s) → *c=o
transition in the near-edge X-ray absorption fine structure spectra of organic molecules.
J. Phys. Chem. B 2002, 106, 8531-8538.
(66) Hitchcock, A. P.; Brion, C. E. Inner-shell excitation of formaldehyde, acetaldehyde and acetone studied by electron-impact. J.
Electron Microsc. Rel. Phenom. 1980, 19,
231-250.
(67) Ade, H.; Zhang, X.; Cameron, S.; Costello, C.; Kirz, J.; Williams, S. Chemical contrast in X-ray microscopy and spatially resolved
XANES spectroscopy of organic specimens.
Science 1992, 258, 972-975.
(68) Lindsay, R.; Gutierrez-Sosa, A.; Thornton, G.; Ludviksson, A.; Parker, S.; Campbell, C. T. NEXAFS study of CO adsorption on ZnO(000(1)over-bar1)-O and ZnO (000(1)over-bar)-O/Cu. Surf. Sci. 1999,
439, 131-138.
(69) Conte, P.; Piccolo, A. Conformational arrangement of dissolved humic substances. Influence of solution composition on association of humic molecules. Environ.
Sci. Technol. 1999, 33, 1682-1690.
(70) Kim, J. I.; Rhee, D. S.; Buckau, G. Complexation of Am(III) with humic acids of different origin. Radiochim. Acta 1991,
52/53, 49-55.
(71) Buckau, G.; Kim, J. I.; Klenze, R.; Rhee, D. S.; Wimmer, H. A comparative spectroscopic study of the fulvate complexation of trivalent transuranium ions.
Radiochim. Acta 1992, 57, 105-111.
(72) Alpha, B.; Ballardini, R.; Balzani, V.; Lehn, J.-M.; Perathoner, S.; Sabbatini, N. Antenna effect in luminescent lanthanide cryptates - A photophysical study. Photochem. Photobiol. 1990, 52, 299-306.
![Figure 4. Evolution of the 7 F 2 / 7 F 1 peak height ratio as a function of [Eu(III)]/TOC (µmol Eu .L -1 /mg C .L -1 ) for SRFA (a) and PAHA (b), and for different values of R HS , pH 4.0, I=0.1 m: dash-dotted line is the](https://thumb-eu.123doks.com/thumbv2/123doknet/12988915.379059/13.918.115.812.65.920/figure-evolution-height-ratio-function-different-values-dotted.webp)
![[PDF] Cours BD le modèle relationnel pdf | Cours informatique](data:image/gif;base64,R0lGODlhAQABAIAAAP///wAAACH5BAEAAAAALAAAAAABAAEAAAICRAEAOw==)