HAL Id: hal-02417753
https://hal.archives-ouvertes.fr/hal-02417753
Submitted on 18 Dec 2019
HAL is a multi-disciplinary open access
archive for the deposit and dissemination of
sci-entific research documents, whether they are
pub-lished or not. The documents may come from
teaching and research institutions in France or
abroad, or from public or private research centers.
L’archive ouverte pluridisciplinaire HAL, est
destinée au dépôt et à la diffusion de documents
scientifiques de niveau recherche, publiés ou non,
émanant des établissements d’enseignement et de
recherche français ou étrangers, des laboratoires
publics ou privés.
Heating Measurements inside the OSIRIS Reactor
H. Carcreff, L. Salmon, V. Lepeltier, Jm. Guyot, E. Bouard
To cite this version:
H. Carcreff, L. Salmon, V. Lepeltier, Jm. Guyot, E. Bouard. Last Improvements of the
CAL-MOS Calorimeter Dedicated to Thermal Neutron Flux and Nuclear Heating Measurements inside
the OSIRIS Reactor. ANIMMA (Advancements in Nuclear Instrumentation Measurement Methods
and their Applications), Jun 2017, Lieges, Belgium. �hal-02417753�
Abstract—Nuclear heating inside an MTR reactor needs to be
known in order to design and to run irradiation experiments which have to fulfill target temperature constraints. To improve the nuclear heating knowledge, an innovative calorimetric system CALMOS has been studied, manufactured and tested for the 70MWth OSIRIS reactor operated by CEA. This device is based on a mobile calorimetric probe which can be inserted in any in-core experimental location and can be moved axially from the bottom of the core to 1000 mm above the core mid-plane. Obtained results and advantages brought by the first CALMOS-1 equipment have been already presented. However, some difficulties appeared with this first version. A thermal limitation in cells did not allow to monitor nuclear heating up to the 70 MW nominal power, and some significant discrepancies were observed at high heating rates between results deduced from the calibration and those obtained by the “zero method”. Taking this feedback into account, the new CALMOS-2 calorimeter has been designed both for extending the heating range up to 13W.g-1 and for improving the “zero method” measurement thanks to the implementation of a 4-wires technique. In addition, the new calorimeter has been designed as a real operational measurement system, well suited to characterize and to follow the radiation field evolution throughout the reactor cycle. To meet this requirement, a programmable system associated with a specific software allows automatic complete cell mobility in the core, the data acquisition and the measurements processing. This paper presents the analysis of results collected during the 2015 comprehensive measurement campaign. The 4-wires technique was tested up to around a 4 W.g-1 heating level and allowed to quantify discrepancies between “zero” and calibration methods.
This paragraph of the first footnote will contain the date on which you submitted your paper for review. It will also contain support information, including sponsor and financial support acknowledgment. For example, “This work was supported in part by the U.S. Department of Commerce under Grant BS123456.”
Hubert .Carcreff is with the CEA/DEN/DANS/DM2S/SERMA, 91191, FRANCE (e-mail: Hubert.Carcreffr@ cea.fr).
Laurent.Salmon is with the CEA/DEN/DANS/DM2S/STMF, 91191, FRANCE (e-mail: Laurent.Salmon@ cea.fr).
V.Lepeltier is with the CEA/DRF/PSAC/USPS/SPRE/SRR, 91191, FRANCE (e-mail: Valerie.Lepeltier@ cea.fr).
Jean-Marie Guyot is with the CEA/DEN/DDCC/UADS/SEROS, 91191, FRANCE (e-mail: Jean-Marie.Guyot@ cea.fr).
Eric Bouard is with the CEA/DEN/DDCC/UADS, Gif sur Yvette, 91191, FRANCE FRANCE (e-mail: Eric.Bouard@cea.fr)
Thermal neutron flux and nuclear heating measurements from CALMOS-1 and CALMOS-2 are compared. Thermal neutron flux distributions, obtained with the Self-Power Neutron Detector suited to the CALMOS-2 calorimetric probe, are compared with those obtained with current devices. This campaign allowed to highlight advantages brought by the human machine interface automation, which deeply refined the profiles definition. Finally, the decay of the reactor residual power after shutdown could be performed after shutdown, demonstrating the ability of such type of calorimeter to follow the heating level whatever the thermohydraulic conditions, forced or natural convection regimes.
Index Terms— Nuclear heating, calorimetry, in-core measurements, OSIRIS reactor, calorimetric cell, sample
I. INTRODUCTION
N
uclear heating inside an MTR reactor has to be known in order to predict sample temperatures reached during an irradiation experiment and check that it fulfills experimental requirements, but also for safety reasons, to demonstrate that temperatures will not exceed material limits. This determination is usually obtained through calorimetry [1, 2]. Homemade calorimeters, working in permanent mode, have been used for many years for the qualification of irradiation locations in the pool type OSIRIS reactor, which were of five stage calorimeters [1], piled-up along the core height. Therefore, they provided only five measurement points to fit the heating profile. These calorimeters were reliable but had inherent drawbacks, coming essentially from the static nature of this technology. The main goal of the CALMOS R&D program was to transpose the current in-core static measurement system to a mobile one, in order to plot the nuclear heating distribution as finely as required. This innovative calorimetric system was studied and developed at the Saclay research center. The so-called CALMOS-1 device, equipped with a displacement system suited to in-core measurements was tested in 2014. Results obtained during the cell development, modelling, mock-ups irradiation, and first results obtained with the complete system up to 10 W.g-1 heating level have been already detailed and presented [3, 4].
However, major problems came along while operating CALMOS-1. Indeed, because of safety rules, a thermal limitation does not allow to perform measurements at nominal power in any core locations. Secondly, some significant
Last Improvements of the CALMOS
Calorimeter Dedicated to Thermal Neutron
Flux and Nuclear Heating Measurements
inside the OSIRIS Reactor
H. Carcreff, L. Salmon, V. Lepeltier, J.M. Guyot
E. Bouard
the “zero method” which is thought to be an absolute measurement. The CALMOS-1 design is not suited for investigating further on. In addition, the displacement system is not equipped with any automation functionalities and was operated manually, hence requiring the presence of an operator. Based on this feedback, a new CALMOS-2 calorimeter has been designed with significant improvements brought to the calorimetric cell and on the displacement system. The radiation field characterization was made in all in-core locations and for many core configurations, measuring nuclear heating and thermal neutron flux up to respectively 12 W.g-1 and 2.5 1014 n.cm-2.s-1.
II. CALMOS-2CALORIMETRIC CELL DESIGN
Fig 1 – Cross section of the CALMOS-2 calorimetric probe (dimensions in mm)
The global design is similar to CALMOS-1 (Fig.1). The key point of this design is still to stack up two cells (one empty and one filled with the graphite sample) coaxially inside the same external sleeve and then to move the whole probe with the help of the displacement system. Structural modifications brought to the first version are discussed hereafter. It is thus possible to obtain heating rate data at any level in the core and therefore to determine accurately the heating profile inside and above the core (which was not possible with previous static calorimeters). Description, working modes and advantages of such calorimeter have already been presented and discussed
III. REMINDER OF THE PROBE CALIBRATION AND THE ZERO
METHOD
Prior to any measurement, a calibration is performed under non irradiating conditions and natural convection cooling. Assuming that the calorimeter has a perfect linear response, we define a K calibration coefficient in W.g-1.°C-1 [3]. If the sample and reference cells are in a same irradiation field, the total heating rate ET W.g-1) in graphite is given by:
ET T. K. Kc(E) (1)
Where T is defined as = T sample – T reference. T refers to the temperatures difference between the pedestal and base thermocouples of each cell (Fig.1) [3]. KC (E) is a correction
coefficient taking into account inherent nonlinearities due to heat leakages by radiation, conduction in gas and the aluminum conductivity dependence with temperature [5]. In CALMOS-2, Kc(E) is evaluated both by using the zero method (up to around 4 W.g-1) and with the help of the CAST3M Finite Element Model [4, 6]. Once the probe is calibrated, the heating rate measurement in the radiation field is performed in two steps [3]. Starting from a given static position in the radiation field, temperatures of the sample cell are recorded. Then, taking advantage of the moving system, the whole calorimeter is shifted (upward or downward) and temperatures of the reference cell are recorded when this latter is located at the same position as the sample was. When cells are at the same level, T is measured and heating is deduced using (1). The step by step displacement of the calorimeter, allows plotting the whole profile. An alternative measurement can be performed by the “zero method”. Such procedure aims to match with an absolute measurement [3, 4]. The two cells being at the same altitude in the core, the nuclear energy deposit inside the sample can be evaluated by adjusting an electrical power applied to the reference cell heater (simulating the energy deposit by radiation) so as to equalize T sample and T reference (see Fig.7a). In that case the heating rate ET inside the sample is given by:
(2)
Where We is the dissipated electric power (W) in the reference cell and ME the graphite sample mass (g). As there are inherent
small differences of thermal transfer capabilities between the two cells (slopes in °C.W-1), we add a K0 correction factor [3, 4].
IV. MAJOR IMPROVEMENTS OF CALMOS-2 A - Zero Method by a 4-wires Measurement Technique A first major improvement in CALMOS-2 avoids any assumption about the resistance value of the heater element embedded in the reference cell. In balance process (zero method), the nuclear energy deposit in the sample is evaluated by adjusting the electrical power applied inside the reference cell heater element so as to equalize T sample and T reference. Therefore, calculations of the WE energy deposit assume that the
effective resistance r of the heater element is well known, and more importantly, that r does not change with ageing, temperature or irradiation conditions. To suppress completely this assumption and to measure more accurately the energy deposit by joule effect, the reference cell is equipped with a four wires element heater, two for the intensity and two for the voltage measurements (Fig. 2 and Fig.3a).
Fig.2 – Evolution between both versions of CALMOS (Heater element and thermocouples location)
(a) (b)
Fig. 3 – (a) 4-wires resistance implementation in lower cell, (b) New position of thermocouples on the pedestal
Therefore, the applied electric power We during the zero method is now evaluated by We = U I (instead of We = r I2).However, such implementation led to one of the major difficulty in manufacturing, because the whole wiring has to be inserted inside an overall 17mm diameter with each wire insulated from each other (Fig. 3a). In addition, the heater is only 2.8mm in diameter.
B - Thermocouples Location
The second improvement relates to thermocouples (TC) location. The difference between the two designs is illustrated in Fig. 2 and Fig.3b. While the TC on top of pedestal is unchanged, the TC which was inserted on the base surface (CALMOS-1) is moved to the pedestal bottom. The objective is:
- First, looking for the balance between the two temperatures difference by replacing nuclear energy deposit in the sample cell by joule effect in the reference one, assumes that cells are identical. However, they don’t have exactly the same transfer capability (slope in °C.W-1). The lower the difference is, the lower the K0 influence in equation (2) is. The
best way to tend K0 to unity is limiting the thermal
resistance between the two measurement points to the only aluminum cylinder (pedestal, Fig. 3b). The effect is significant. The slopes difference in CALMOS-1, measured during the calibration phase [3, 4], was 2.2%, whereas in CALMOS-2, the new TCs location leads to an only 0.3% difference. The K0 correction coefficient is now close to 0.99 against
0.955 for CALMOS-1,
- Secondly, instead of having a thermocouple placed in an intermediate position between the external base and the sheath internal surface (with a mechanical clearance), the thermocouple is now embedded inside the pedestal itself, leading to a more accurate modelling assessment. There is almost no difference anymore between calculated and measured slopes during calibration.
C - Volume of Each Cell Base and Rhodium SPND location The height of the base is reduced from 35 to 25mm (Fig. 2a), involving no change on cell slopes (°C.W-1), but the modification reduces absolute temperatures. Indeed, all the energy deposit inside the base plays the role of an offset for absolute temperatures. Lower this volume is, lower the deposit inside is and lower are the temperatures in the pedestal at equal heating level [5]. First, the margin vs boiling point (117°C in OSIRIS conditions) at the envelope external surface is easier to keep. In addition, it is easier to meet the required margin with respect to the melting point of aluminum (650°C for AW1050 alloy [7]) at any point of the cell. Measurements carried out in the 64North location showed, under same conditions, a “pedestal temperature” in CALMOS-2 (420°C at 70MW) around 20°C lower than CALMOS-1. The new design offers wider margins with regard to the aluminum melting temperature.
The new rhodium SPND (10mm in emitter length), specially designed for the R&D CALMOS program, previously located in central axis of the sample cell base is now moved downward to the reference cell (Fig.1). Such change allows to perform measurements in the lower part of the core. The lowest accessible altitude is now -297mm instead of -191mm/core mid-plane for CALMOS-1.
V. FINITE ELEMENT MODEL
Heater element Graphite sample Pedestal Rhodium SPND SPNDTCHeater TC SPND TCHeater TC CALMOS 1 (sample cell) CALMOS 2 (reference cell)
model was adapted from the one used for CALMOS-1. Both models neglect nitrogen convection inside cell cavities. If this effect is significant, it is assumed leading same effects between the reference and the measurement cells. It also neglects heat loss by radiation, which should remain low even at high temperatures because of the presence of polished screens (stainless steel) surrounding the cells, offering a very low emissivity coefficient. Taking into account this effect in the model would require to evaluate correctly the emissivity coefficient of screens internal surface, which is very difficult. Finally we can notice that for both models, material properties are set to depend on temperatures. Therefore, the initial gap between the base and external tube, in the order of magnitude of a few tens of micrometers, depends also on temperature. Differences between CALMOS-2 and CALMOS-1 designs are:
- Geometrical evolutions (height of each cell base, total length of the probe, gas height above the element heater),
- The change of thermocouples location, which are located on both extremities of the pedestal in CALMOS-2,
- The Aluminum (AW 1050 alloy) thermal
conductivity dependence with temperature in CALMOS-1 model was set so as to find good agreements between calculated and measured temperatures in many experiments. But the CALMOS-2 modelling takes into account the real conductivity, which has been measured by a specialized lab (“Laboratoire National de Métrologie et d'Essai”) on specimens withdrawn from the material used for the calorimetric probe manufacturing.
(a) (b)
Fig.4 - CALMOS2 meshing of the probe (a), zoom on the reference cell (b)
Temperatures measured during the calibration phase of CALMOS-2 were compared to calculated ones. Observed discrepancies between calculated and measured cell slopes (close to 7.32 °C.W-1 for each one) do not exceed 0.15%. This excellent C/M agreement comes essentially from the new TCs location, allowing a more relevant modelling of temperatures measurement points. The mechanical clearance between the sheath and the external surface of the base does not play any role anymore in the measured temperature difference.
Comparisons were also made on the zero method experiments and shows results which are in good agreement. However, that led us to emphasize a particular phenomenon: even if T between both cells are equal after applying the Joule effect in the reference cell, absolute temperatures of the sample cell are systematically a little higher than those of the reference one. This effect had been previously observed on CALMOS-1, and could be confirmed in CALMOS-2 thanks to the 4-wires technique. However, the discrepancy between cells remains limited, around 5°C at 4W/g for a T total difference of around 100°C. There is no effect on final measurement uncertainties, but this difference has to be considered in order to perform the measurement, particularly for high heating levels. On the other hand, this phenomenon is perfectly reproduced by modelling. In order to understand this systematic discrepancy, the model was modified by implementing graphite in both cells (both cells are therefore identical). The difference still remains. Therefore that seems to come from a small thermic environment dissymmetry
between cells. Further investigations showed that it is created by nitrogen temperature differences. Indeed, nitrogen in contact with the lower surface of the base of the sample cell is heated up by the reference cell, whereas nitrogen of this latter is cooled by the low part of the external tube. At 1W.g-1, 4W.g-1 and 12W.g-1,differences are respectively: 2.2; 5 and 6°C. Therefore, the higher the nuclear heating is, the higher is the temperature difference. This difference should have very limited effect on heat loss difference between both cells and on the measurement uncertainty. That does not seem to explain why the nonlinearity coefficient Kc seems to follow a parabolic curve with nuclear heating.
VI. GENERALITIES
OSIRIS is a pool type light water reactor with an open core. The core is a compact unit, with an horizontal section of 60cm x 70cm and a height of 70cm. The core housing contains a rack of 56 cells and is loaded with 38 fuel elements and up to 7 beryllium elements (Fig. 5) [3].
Fig. 5 – Cross section of OSIRIS reactor
Fig. 6 – Raw temperatures recorded in 64NE location
Two locations (22, 26) are used for radioisotopes production for medical application. The remaining locations (24, 44 and 64) are dedicated to experiments, and equipped with water boxes which can contain up to four experiment rigs, with a 37mm maximum internal diameter. The CALMOS device is suited to in-core measurements in the 24, 44 and 64 locations. Nuclear heating at mid-plane varies from around 4 to 12 W.g-1 (in graphite), depending on the selected location. Fig. 6 shows an example of signal acquisition at 69.7MWth in the 64NorthEast location with CALMOS-2. On the graph are plotted T sample, T reference and T difference, from which the nuclear heating is deduced. We can see that altitudes lower than -160 mm cannot be reach with the sample cell (red points), whereas those higher than +808m are not accessible with the reference cell (blue points) due to the probe structure (Fig. 1). Zoomed scale (on right) is dedicated to the upper part.
VII. USE OF THE ZERO METHOD IN UPPER PART OF THE CORE
The zero method can be considered as an absolute heating measurement and has to confirm, at least for low heating levels, results obtained with preliminary calibration. To study the linearity loss, an intensive use of this procedure was made during the measurement campaign (Fig. 7). However, it could only be performed in upper part where heating levels remain under around 4 W.g-1, due to the maximum intensity current (2 A) applicable to heater wires. Fig. 8 gathers 21 heating measurements obtained both by calibration and zero methods on the 0 - 4 W.g-1 range. All measurements are obtained by the new 4-wires technique, measuring together voltage (U) and current (I) applied to the reference heater. Fig. 8 shows that all results are within 2% discrepancy up to around 2.5 W.g-1. Accounting for uncertainties, we can consider that both methods are very close to each other up to that point. Beyond that level, the zero method provides values slightly higher than those obtained by calibration. That leads to apply to the calibration a Kc factor close to 1.04 at 3.5 W.g-1 and 1.05 at 4 W.g-1. Step 1 Step 2 electric power T sample 1 T ref 2 = T sample 1 Measurement level
Fig.7 – Zero method procedure (step 1: recording of the T sample at the measurement level, step 2: moving up the probe and applying an energy
Fig. 8 – Results obtained by the zero and the calibration methods in upper part of the core up to 4 W. g-1. Measurement of the Kc correction factor.
VIII. UNCERTAINTIES ON NUCLEAR HEATING
MEASUREMENTS
The following evaluation is restricted to measurements deduced from calibration with relation (1) and up to 4 W.g-1, thanks to the 4-wires technique allowing a Kc experimental evaluation. As a first approach, the K coefficient, the T difference and the Kc coefficient can be assumed as independent:
- The uncertainty associated with K, depending on cell slopes determination (°C.W-1), is 3.8% at one standard deviation (1 ) and independent of the heating level, - T value comes from the measurement of four
temperatures. The uncertainty of each TC (calibration certificate) and those coming from the measurement device, lead to uncertainties decreasing with T rise: 12% for 5°C, 5.5% for 11°C and 1.9% for 42°CT (1 ),
- Kc was evaluated both by the zero method and the CAST3M Finite Element Model [4, 6]. The only experimental process is kept in this evaluation. Despite of the low measurements number, points fit well with the curve in Fig. 8. From an analytical determination we assess a Kc uncertainty to 2% (1
TABLE 1–UNCERTAINTIES ON HEATING MEASUREMENTS DEDUCED FROM CALIBRATION
Heating (W.g-1 in graphite)
0.5 1 2 4
ET/ET at 1 12.7 7.0 5.4 4.7
Therefore, if the measurement is made through the preliminary calibration, associated uncertainties are those of Table 1, as a function of the heating level. If the heating measurement is performed through the zero method, which is the reference, the assessed uncertainty is 4% (1accounting for the main
IX. COMPARISON OF HEATING AND THERMAL FLUX
PROFILES
For each scan, CALMOS-2 allows measuring separately the nuclear heating, the thermal flux or both at the same time. One notes that, the rhodium has a response both in thermal and epithermal ranges. As it moves inside in-core and ex-core areas, the neutron spectrum changes and has to be calculated along the total stroke to be able to transpose the current to a neutron flux. Therefore, the epithermal flux/thermal neutron flux ratio has been calculated by the TRIPOLI-4® Monte Carlo code for all accessible altitudes accounting the cell geometry, rods position and the actual core loading [8]. The associated uncertainty to the conventional thermal flux by this rhodium SPND is 8% (1
Fig.9 – Simultaneous messurement of heating and thermal neutron flux in the 44North-East location. Values are normalized to unity.
Fig.10 – Measurement of the thermal neutron flux in the 44 North-East location. Detail of the thermal flux distribution at the core-moderator transition.
Fig. 9 shows an example with 32 simultaneous measurement points, heating and thermal flux, performed in the 44NorthWest location during the F283 cycle, which allows observing behaviors of both quantities along the scanning height. The Figure shows both distributions normalized to unity. Fig. 10 relates to the only thermal neutron flux in absolute values. That shows the possibilities offered by the HMI automatic displacement system allowing to refine deeply the profiles. Two significant phenomena could be well highlighted and measured:
- As the probe moves away from the core, the heating attenuation is quite different from the thermal flux one (see right scale on Fig. 9 zooming measurements in upper part). Thermal flux decreases faster than heating, around a ratio 2 each 40mm against 80mm for heating, - The slope break in thermal flux evolution at the
moderator-core transition (+320mm/mid-plane), is well emphasized (Fig. 10) with a scanning step reduced to 11mm in this area, only possible by an automatic displacement system.
X. CHECKING OF THE CONSISTENCY BETWEEN BOTH
PROTOTYPES
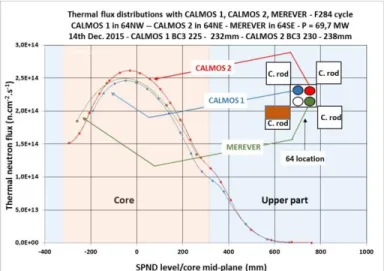
CALMOS-2 and CALMOS-1 were loaded side by side (37mm distance) in the two north positions of the 64 core location during the F284 cycle. Two distributions of thermal flux and nuclear heating were obtained by each device, but operated separately so as to avoid any influence on each other. Fig.11 shows the heating comparison whereas Fig.12 relates to the thermal flux.
Fig. 11 – Distributions of nuclear heating obtained with both prototypes located in 64 North location
Fig. 12 - Distributions of the thermal neutron flux obtained in 64 location with CALMOS-1 (blue) CALMOS-2 (red) and the MEREVER device (green)
equipped with standard rhodium SPNDs
During the scans, made at the 70MWth power, among the 4 control rods surrounding the location only BC3 (in brown) in the south part is in the first third of its stroke. Such configuration leads approximately, to same irradiation conditions in north part of the 64 location. Results show that:
- Both heating profiles are almost identical in Fig. 11. The only significant difference appears in the mid-plane region in which the CALMOS-2 signal (red curve) is around 3% higher,
- Thermal neutron flux distributions in Fig.12 seem to confirm the heating behavior. Indeed, at mid-plane, measurements by CALMOS-2 (red curve) are also higher around 6% than CALMOS-1 (blue curve). However, conversely to heating recording, we note a thermal flux in CALMOS-1 remaining lower up to the fissile-moderator transition in upper part,
- To reinforce this comparison, the current static device called MEREVER was placed also in 64SE location (Fig. 12). It is instrumented with 5 rhodium standard SPNDs (50mm emitter length) inside an aluminum rod and allows to plot the thermal flux profile with 5 in-core measurements covering +/-260mm/mid-plane. In comparison with those obtained with CALMOS devices, we see also that profiles are similar, except for low altitudes under the mid-plane (green curve), demonstrating that the thermal neutron flux is influenced by the rods position, closer to the MEREVER device.
Such results show that, both devices give coherent responses in spite of significant geometry differences (K calibration coefficients with a 16.6% discrepancy). In addition, the global consistency in thermal flux measurement found between CALMOS and MEREVER devices, shows that the 10mm short emitter SPND, specially developed for the CALMOS program, seems qualified. To complete the study, two scanning were performed in this configuration with both CALMOS devices moving downward simultaneously in the core so as to evaluate their mutual influence. Results show that the influence remains
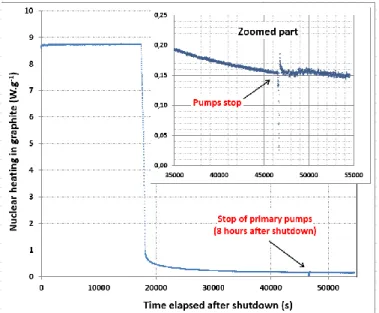
XI. RECORDING OF THE RESIDUAL POWER DECAY
The CALMOS-2 calorimeter has been used to follow the residual power decay after shutdown at the end of the cycle. Fig. 13 shows an example of a 10 hours recording performed after shutdown at the end of the F283 cycle. After an 8 hours elapsed time, the residual heating level is around 150 mW.g-1. At this time, the reactor procedure requires to stop the primary pumps, involving a change of cooling conditions for the calorimeter, switching from the forced convection to the natural convection regime.
Fig. 13 – Decay of the residual power after the end of the F283 OSIRIS cycle. Recording during 10 hours after shutdown. The signal behaviour before and after the change of cooling regime appears in the zoomed part (upper right corner).
The zoomed part in Fig. 13 shows that the signal is disturbed at the time of pumps stop and the noise becomes stronger in natural convection. However, the decay is still coherent after the event, and the signal tends to find again the same slope of decay, demonstrating that the calorimeter remains reliable in both cooling regimes. That allows to use such type of calorimeter to follow the residual power independently of the OSIRIS thermohydraulic conditions.
XII. CONCLUSION
The comprehensive 2015 measurement campaign in the OSIRIS reactor with the CALMOS-2 calorimeter allowed to highlight different possibilities offered by this new device. The automatic cell mobility allows to obtain very well defined profiles, both for nuclear heating and thermal neutron flux measurements. The scanning steps number and the total measurement time can be adjusted to core conditions and to target regions, while keeping relevant measurements with regard to the control rods movement. Implementation of the 4-wires technique in the reference cell allows to be more confident in the zero method. It enables assessing the probe non-linearity and to
complete study, including the model adjustment of the cell and all the data processing during the measurement campaign, is ongoing. The intensive use of CALMOS-2 in the core, cumulating a total 70 hours automatic scanning time, has demonstrated its reliability for in-core conditions for the calorimeter itself and the enhanced displacement system. In addition, it has been demonstrated the ability of such device to measure the evolution of the residual power after shutdown whatever the thermohydraulic conditions, forced or natural convection regimes. The device meets better safety requirements and becomes an equipment well suited to the surveillance and qualification of an MTR, preparing the transfer of this technique to the incoming JHR reactor in France.
ACKNOWLEDGMENTS
Authors wish to thank the DER/SPEx department of CEA/Cadarache for fruitful discussions along this R&D program, the DRSN/SEROS and DM2S/SERMA departments of CEA/Saclay for their help during the measurement campaign and neutron calculations required for results processing.
REFERENCES
[1] [1] IAEA, International Intercomparison of Calorimeters, Report N° 128, 1970.
[2] M.S. Kim, S.Y. Hwang, H.S. Jung, K.H. Lee, “Measurements of Nuclear Heating Rate and Neutron Flux in HANARO CN Hole for Designing the moderator cell of neutron source.” Proceedings of IGORR, (2005). [3] H. Carcreff, L. Salmon, and C. Courtaux, “First In-Core
Measurement Results Obtained with the Innovative Mobile Calorimeter CALMOS inside the OSIRIS Material Testing Reactor”, IEEE Transactions on Nuclear Science, Vol.61, N°.4, Aug 2014.
[4] H. Carcreff and coll, “First In-Core Simultaneous Measurements of Nuclear Heating and Thermal Neutron Flux obtained with the Innovative Mobile Calorimeter CALMOS inside the OSIRIS Reactor“ IEEE Transactions
on Nuclear Science, Vol. 63, N°.5, Oct 2016. [5] J. Brun and coll, “Numerical and Experimental
Calibration of a Calorimetric Sample Cell Dedicated to Nuclear Heating Measurements”, IEEE Transactions on Nuclear Science, Vol.59, N°.6, Dec 2012.
[6] "CAST3M code", http://www-cast3m.cea.fr/ [7] "Alliages d’aluminium", http://www.euralliage.com [8] F. Chevallier, “Calculs d’indice épithermique dans le
dispositif CALMOS-2 pour l’interprétation du signal collectron dans le réacteur OSIRIS”. Forthcoming CEA report.
[9] D. Fourmentel and coll. “Comparison of Thermal Neutron Flux Measured by 235U Fission Chamber and Rhodium Self-Powered Neutron Detector in MTR”. IEEE Transactions on Nuclear Science, Vol.61, N°.4, Aug 2014.