Publisher’s version / Version de l'éditeur:
Vous avez des questions? Nous pouvons vous aider. Pour communiquer directement avec un auteur, consultez la première page de la revue dans laquelle son article a été publié afin de trouver ses coordonnées. Si vous n’arrivez pas à les repérer, communiquez avec nous à [email protected].
Questions? Contact the NRC Publications Archive team at
[email protected]. If you wish to email the authors directly, please see the first page of the publication for their contact information.
https://publications-cnrc.canada.ca/fra/droits
L’accès à ce site Web et l’utilisation de son contenu sont assujettis aux conditions présentées dans le site LISEZ CES CONDITIONS ATTENTIVEMENT AVANT D’UTILISER CE SITE WEB.
EPJ Web of Conferences, 186, 2018-07-27
READ THESE TERMS AND CONDITIONS CAREFULLY BEFORE USING THIS WEBSITE. https://nrc-publications.canada.ca/eng/copyright
NRC Publications Archive Record / Notice des Archives des publications du CNRC : https://nrc-publications.canada.ca/eng/view/object/?id=d9137edb-2a25-44d2-bd59-f5849c02895c https://publications-cnrc.canada.ca/fra/voir/objet/?id=d9137edb-2a25-44d2-bd59-f5849c02895c This publication could be one of several versions: author’s original, accepted manuscript or the publisher’s version. / La version de cette publication peut être l’une des suivantes : la version prépublication de l’auteur, la version acceptée du manuscrit ou la version de l’éditeur.
For the publisher’s version, please access the DOI link below./ Pour consulter la version de l’éditeur, utilisez le lien DOI ci-dessous.
https://doi.org/10.1051/epjconf/201818605001
Access and use of this website and the material on it are subject to the Terms and Conditions set forth at
A bibliometric analysis of observatory publications 2011-2015
A Bibliometric Analysis of Observatory Publications 2011-2015
Dennis Crabtree1, ⋆1National Research Council Canada, Dominion Astrophysical Observatory, 5071 West Saanich Road,
Vic-toria, BC V9E 2E7 Canada
Abstract. Bibliometrics are increasingly used as metrics to measure the performance of individuals, institutions and countries. Refereed publications are the primary output of modern observatories. In this paper, I use bibliometric techniques to examine the performance of astronomical observatories.
1 Introduction
Bibliometrics is increasingly used as an evaluation tool in science. Papers in refereed journals repre-sent the key product of modern astrophysical observatories. These publications reprerepre-sent the obser-vatories’ contribution to knowledge and represent the return on investment for the partners. Observa-tories carefully track the papers based on data from their telescopes as this is of great interest to the various governance bodies and other stake holders.
The number of refereed papers each year is a measure of an observatory’s annual productivity. A telescope’s productivity usually ramps up over a period of 5-10 years following the start of operations. While a telescope’s productivity is one metric of a telescope’s performance, the relevance, or impact, of the publications is another important metric.
Citation counts are a standard measure of the impact of a paper, i.e., the more citations a paper receives, the more relevant the work is to the broad astronomical community.
In this paper, I examine the productivity and impact of most optical telescopes with an aperture large than 3.5-meters. A small number of other telescopes, such as the Hubble Space Telescope (HST) and JCMT are also included in this study.
2 Observatory Publications
Observatories maintain bibliographies of refereed papers that are based on analysis of data from their observatory. To be considered an observatory publication a paper must base some or all of its con-clusions on data from that observatory. IAU Commission 5 has developed a document [1] describing the best practices for creating such a bibliography. At least one observatory now includes papers based on analyses of the catalogs of objects identified from large scale surveys undertaken by their telescope. Papers based on catalogs already form a large part of the SDDS bibliography and will also be a significant fraction of LSST’s bibliography.
included by some observatories.
The basic publication information as well as the bibcode for each paper is stored in a relational database (Microsoft Access). The bibcode for each paper is validated via ADS and corrections made to the data in the case of an invalid bibcode. Once a paper’s bibcode is verified, further information including the number of citations to the paper is retrieved from ADS and added to the database.
3 Impact Metric
The cumulative citation count for a paper increases as the paper ages. It takes at least a year before the citation count is meaningful, and this is the reason this study includes papers only up to 2015. Gen-erally, a paper’s citation rate (number of citations per year) peaks 2 years after publication although each paper’s citation history can exhibit quite different behavior.
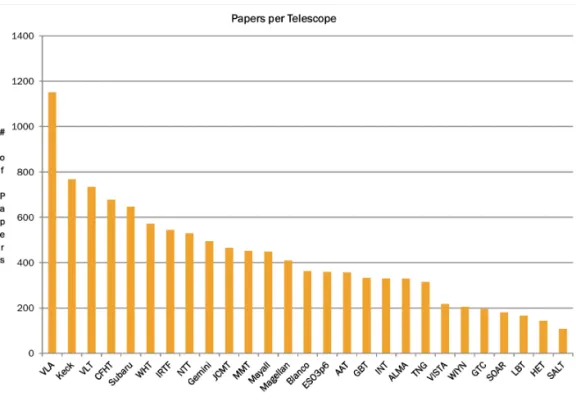
Figure 1. Productivity: Papers per Telescope: 2011 - 2015
Since citation counts grow with time and I will be comparing papers published over a 5-year period, it is necessary to correct the citation counts for this aging effect. My approach is to normal-ize each paper’s citation count by the citation count for the median AJ paper (based on number of citations) of the same year. I refer to this normalized citation count as the impact of a paper.
4 Productivity
The productivity of each telescope in this study for the period 2011-2015 is shown in Figure 1. In the case of a telescope actually representing multiple physical telescopes (e.g., Keck has two, VLT has four) I have normalized the paper count to produce a productivity per telescope.
Note that HST, which produced 4081 papers in the period, is not included in this figure as it would distort the scale of the plot. There is a large range of productivity between the most productive (VLA, Keck) and the least productive (LBT, SALT) telescopes. The low productivity of the LBT and SALT is due to technical issues that have kept the telescopes off-line for periods of time. A variety of factors affect a telescope’s productivity. This includes the quality of the site, quality, and aperture, of the telescope, instrumental capabilities and the user community.
The data used in this study allows an examination of other aspects of refereed publishing in the field of astronomy. The growth in the size of research teams, and the corresponding increase in the number of authors on papers has often been noted. I examined the long-term trend in the number of authors per paper using the data in my observatory publication database which extends back to the early 1990s.
Figure 2 shows the average number of authors on each paper for the period 1991-2015. The smooth line is a fit to the data with an extrapolation to the year 2025. The error bars represent the standard error of the mean. The data prior to 2000 is based on a smaller number of telescopes and the errors are larger. The data indicates that the increase in the number of authors per paper was relatively flat during most of the 1990’s and then began to increase rapidly after 1997. An extrapolation of the data indicates there will be an average of 18 authors on each paper in 2025!
quality of the research. Rather, impact is a measure of the relevance of the paper to other research and researchers in the field. Of course the number of citations is influenced by other factors such as area of research and the citation culture of each sub-field. However, since we are studying large aggregates of papers and not comparing individual authors, the effect of these factors should be minimal.
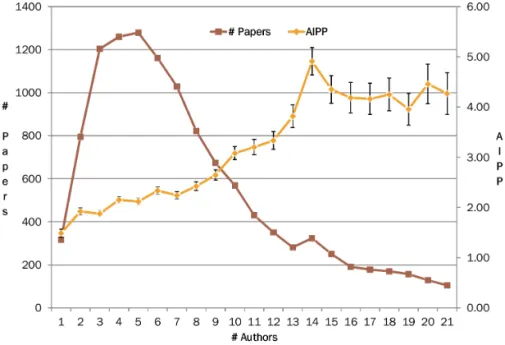
Figure 3. Average impact per paper and the number of papers by year
Before investigating the impact of the observatory papers in this study, I will look at how the impact of a paper correlates with the number of authors. As discussed earlier research teams are increasing in size (indicated by the increasing number of authors per paper).
Figure 3 shows the average impact per paper (AIPP), as well as the number of papers, as a function of the number of authors for all papers in this study. The AIPP curve has error bars that represent the standard error of the mean. Note that there are more papers with eleven authors than there are single author papers.
Note the dramatic increase in impact with the number of authors. The AIPP increases until there are 14 authors per paper and then more or less levels out. This clearly indicates that on average, papers produced by larger teams have higher impact, i.e., higher number of citations.
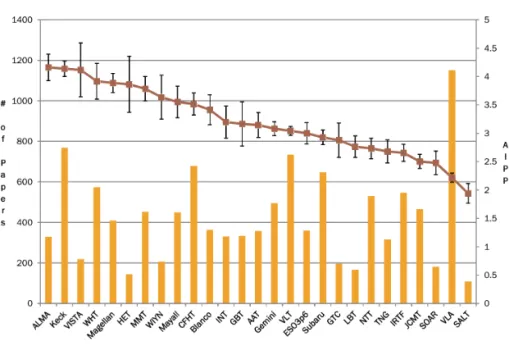
I also investigated the average impact per paper (AIPP) by observatory. Figure 4 shows the AIPP as well as the productivity for each observatory by year. HST is not included in the sample but produced 4081 papers during this period with an AIPP of 3.22. There are considerably smaller differences in impact between observatories than there was in productivity. While Keck is still near the top (#2), ALMA now holds the honor of having the highest average impact per paper for this period. Also
Figure 4. Average impact per paper and the number of papers by observatory
worth noting is that HST’s AIPP falls in the middle of the pack. So while HST produces significantly more publications than ground-based telescopes, the impact of most of its papers are quite average.
impact is simply the sum of the impacts of an observatory’s papers, or the AIPP times the number of papers.
Increased performance indicators (higher productivity, higher AIPP, and higher P10) tend to move together for an observatory. That is, if a telescopes is high in one of these indicators the others will also tend to be higher. However, this is not ironclad. For example, the MMT has a very high P10 for its location in the plot.
Acknowledgments
Thank you to observatory librarians and other staff who maintain their observatory bibliographies. This work would not have been possible without their dedication. This work has made use of NASA’s Astrophysics Data System.
References
[1] Lagerstrom, J., Best Practices for Creating an Observatory or Telescope Bibliography from the IAU Commission 5 Working Group on Librariesin Open Science at the Frontiers of Librarianship, edited by András Holl, Soizick Lesteven, Dianne Dietrich, and Antonella Gasperini (2015), Vol. 492 of Astronomical Society of the Pacific Conference Series, p. 99–103