Publisher’s version / Version de l'éditeur:
Vous avez des questions? Nous pouvons vous aider. Pour communiquer directement avec un auteur, consultez la première page de la revue dans laquelle son article a été publié afin de trouver ses coordonnées. Si vous n’arrivez Questions? Contact the NRC Publications Archive team at
PublicationsArchive-ArchivesPublications@nrc-cnrc.gc.ca. If you wish to email the authors directly, please see the first page of the publication for their contact information.
https://publications-cnrc.canada.ca/fra/droits
L’accès à ce site Web et l’utilisation de son contenu sont assujettis aux conditions présentées dans le site LISEZ CES CONDITIONS ATTENTIVEMENT AVANT D’UTILISER CE SITE WEB.
Intelligent Buildings International, 2019-05-09
READ THESE TERMS AND CONDITIONS CAREFULLY BEFORE USING THIS WEBSITE. https://nrc-publications.canada.ca/eng/copyright
NRC Publications Archive Record / Notice des Archives des publications du CNRC :
https://nrc-publications.canada.ca/eng/view/object/?id=e935cff5-b01c-4ba1-b048-8f1e5e787347 https://publications-cnrc.canada.ca/fra/voir/objet/?id=e935cff5-b01c-4ba1-b048-8f1e5e787347
NRC Publications Archive
Archives des publications du CNRC
This publication could be one of several versions: author’s original, accepted manuscript or the publisher’s version. / La version de cette publication peut être l’une des suivantes : la version prépublication de l’auteur, la version acceptée du manuscrit ou la version de l’éditeur.
For the publisher’s version, please access the DOI link below./ Pour consulter la version de l’éditeur, utilisez le lien DOI ci-dessous.
https://doi.org/10.1080/17508975.2019.1588700
Access and use of this website and the material on it are subject to the Terms and Conditions set forth at Comparing better building design and operation to other corporate strategies for improving organizational productivity: a review and synthesis
Newsham, Guy R.; Veitch, Jennifer A.; Zhang, Meng Qi (nikki); Galasiu, Anca D.
Comparing Better Building Design and Operation to Other Corporate
Strategies for Improving Organizational Productivity: A Review and
Synthesis
“Better buildings” are intended to improve employee well-being and other important organizational productivity metrics, but such effects have been notoriously difficult to quantify convincingly. This paper uses new, multi-metric approaches to develop a framework for valuing these effects. The organizational productivity metrics considered are: absenteeism, employee turnover intent, self-assessed performance, job satisfaction, health and well-being, and complaints to the facilities manager. The effects of several ways of improving building design and operation (improved ventilation, enhanced lighting conditions, green building certification measures) are compared to the effects of other corporate strategies also employed with the intent of influencing employees to improve
organizational productivity: office type (private vs open-plan), workplace health programs, bonuses, and flexible work options. Results were derived from a broad search and synthesis of published information from several disciplines: business, medicine, psychology, engineering, and facilities management. The scope was limited to studies conducted in real organizations in large office buildings, with a geographic focus on studies from North America, Europe, and Australia/New Zealand. In summary, better buildings strategies provided benefits on multiple organizational productivity metrics at levels similar to other corporate strategies. This supports greater consideration being given to better buildings strategies to improve organizational productivity beyond energy savings. In this paper, and for want of more primary research, the “better buildings” category blends the effects of different improvements; this synthesis is proposed as a starting point to encourage more buildings research in this context, allowing future differentiation of the effects of specific interventions.
Keywords: benchmarks, building operation, office design, organizational productivity
Introduction
Linking Building Systems to Organizational Productivity
Corporate decision-makers desire to maximize organizational productivity, and seek
evidence in the form of established metrics and quantifiable economic effects as the
basis for their decisions. There is a long history of research establishing linkages
between the physical office environment and the comfort of occupants (Brill, Margulis,
Konar, & BOSTI Associates, 1984; Sundstrom, 1986). However, linkages between
work environments and metrics with arguably a more direct effect on organizational
productivity, such as employee health and well-being, and real-world task performance,
are less established and recognized.
The potential economic value of this line of enquiry has long-been understood. The cost
of staff typically dwarfs the cost of the buildings they occupy. A common rule of thumb
is that the annual operational costs of an office space are, on average $300/ft2for staff
payroll, $30/ft2for space rent, and $3/ft2for utilities (Best, 2014). Nevertheless,
real-estate decisions are more commonly steered by the latter two costs (Oseland and
Burton, 2012).
At one time decision-makers sought very simple cause-and-effect relationships; i.e. “If I
replace building feature X then the amount of work produced by an individual will
increase by Y%”. There is increasing acceptance that such a model is not applicable to
most white-collar workplaces, where the economic output of an organization is rarely
measurable in such simple terms. Instead, productivity is better represented by multiple
metrics that all influence the overall balance of costs and revenues in an organization.
Modern organizations are now accustomed to multi-metric (or “balanced scorecard”)
Two recent publications map out an approach to valuing better buildings using multiple
metrics. Thompson, Veitch, & Newsham (2014) proposed a scorecard structure, with a
focus on the effect of building automation systems (BAS). The World Green Building
Council (WGBC, 2014), provided a similar internationally-agreed, multi-metric
framework, which included metrics related to: human resources (HR) outcomes,
workplace perception, complaints to the facility manager (FM), and physical measures
of the indoor environment.
Establishing Values
The balanced scorecard approach recognizes that, (1) not all metrics can be converted in
a straightforward, meaningful or universal way into monetary units, and (2) the same
metric will have a different monetary value to different organizations. Organizations
may choose the metrics that represent their goals and may choose to undergo a
monetization exercise using assumptions and multipliers that are unique to them.
Another way to judge the utility of building investments is to compare their effects to
other forms of investment that organizations might make, using consistent,
metric-specific, units. This is the approach taken here: a comparison between building design
and operation interventions against the success of other corporate programs designed to
deliver productivity effects. Organizations may weigh the costs and benefits of building
technologies against these other programs.
As with building energy efficiency upgrades, the process should begin with
benchmarking. Benchmarks enable decision-makers to understand whether or not their
own building’s metrics are lower than desired. This might motivate them to look at
Scope
This investigation is a synthesis of already published material. The literature review
included peer-reviewed, contemporary studies in real office buildings, the vast majority
of which were in North America, Europe, and Australia/New Zealand. Data to facilitate
a formal meta-analysis were not available; rather this work is a semi-quantitative
synthesis of studies across multiple disciplines with substantial variation in methods.
Nevertheless, where applicable, this work followed the PRISMA framework for
literature reviewing (http://www.prisma-statement.org/) in its development and
reporting.
Goal
This work represents the first attempt (to the authors’ knowledge) to put the effects of
buildings on multiple, individual-level organizational productivity metrics side-by-side
with the effects of other corporate strategies in order to learn how the effects compare in
size and direction. This comparison may bring the value of investing in buildings to
greater prominence in the eyes of HR and corporate decision-makers.
Numerous studies and reviews have addressed the broad topic of the effects of various
indoor environment conditions on occupant comfort, and on corporate strategies more
generally on aspects of productivity. However, these studies have been typically limited
to single disciplines. Further, prior studies that focussed on the effects of buildings (e.g.
Newsham et al, 2009; Al Horr et al, 2016; Appel-Meulenbroek & Feijts, 2007), for
example, have limitations in providing convincing information to corporate
decision-makers. Shortfalls include no systematic definition of productivity as an outcome;
frequent reliance on a single, very narrow dependent variable as a measure of
decision-makers; and, excessive reliance on laboratory studies that have limited
real-world context. This work provides a unique contribution in several ways:
Effects are presented for a specific and consistent set of broadly accepted productivity-related metrics;
Effects are compared from multiple disciplines and corporate strategies on the same metrics;
Focus is on results derived from real workplaces. Review and Analysis Framework
Definition of Key Performance Indicators
This investigation focused on making effects clear to corporate decision-makers and
comparable, despite the wide variety in information sources and disciplines included in
the review. Outcomes derived using different scales were rescaled to a common scale to
improve interpretation using a procedure described below.
Absenteeism (unit: Days/person/year)
Organizations code absences in various ways, making comparisons difficult. The focus
of this review was on short-term sick leave that an employee takes based on their own
health assessment. This type of absence seems more likely to be attributable to the
office environment than long-term absences or those taken to support family members.
Employee Turnover (unit: 0-100 scale (likelihood to look for another job))
The focus of the chosen metric was on whether someone leaves their job voluntarily,
again because the office environment might contribute to such a decision (American
statistical databases, based on industry reporting. Turnover intent is more frequently
used as a survey question in research studies and social surveys, and is the focus here. A
typical question might read, “How likely is it that you will make a genuine effort to find
a new job with another employer within the next year?” Note that if the response is
mapped to a 0-100 scale, an average response of 25 would mean that employees say
they are “somewhat unlikely” to be looking for another job, not that 25% of employees
are actively looking for a new job.
Self-assessed Performance (unit: 0-100 scale)
Objective measures of task performance in real workplaces are not often available to
researchers for publication, if indeed they exist at all for many occupations. However,
there exist several studies in which employees had been asked to self-assess their own
productivity. A typical question phrasing by researchers might be, “Please estimate how
you think your personal productivity at work is increased or decreased by the physical
environmental conditions”, with a seven-point response scale from -30% to +30%
(Wilson & Hedge, 1987). There is some debate as to the interpretation of this metric. It
is unlikely to be a reliable measure of an employee’s actual material output, and is more
likely a measure of how the indoor environment supports the employee’s ability to do
their job.
Job Satisfaction (unit: 0-100 scale)
Job satisfaction is the antecedent to many other workplace behaviours that affect an
organization’s productivity (Roznowski and Hulin, 1992, p. 158). Many different
question wordings have been used, and judgement was applied to interpret the
Health and Well-being (symptoms) (unit: 0-100 scale)
In the buildings research domain, Sick Building Syndrome (SBS) events led to the use
of surveys to assess associated symptoms. These symptoms included dry eyes, runny
nose, back pain etc., and surveys sought to isolate symptoms that occurred in the
workplace, but receded when the employee went home.
Health and Well-being (overall) (unit: 0-100 scale)
Both national and international social surveys and individual research studies have been
used to determine an individual’s general state of health or well-being.
Complaints to Facility Manager (unit: complaints/person/year)
These data are routinely recorded by the building managers in most large office
buildings. Complaints are typically related to unsatisfactory temperature, air quality
issues, cleanliness, lamps burned out etc.
Definition of Corporate Strategies to Improve Organizational Productivity
The focus of this work was strategies that would be familiar to a building manager, or
which might be implemented with the participation of the building manager. The
strategies are categorical and could encompass numerous specific actions.
Better Buildings
Studies included upgrades to specific building systems (e.g. ventilation enhancement,
advanced lighting controls), or whole-building approaches typically including a
collection of enhanced elements (e.g. green building certification). For this review,
different specific building interventions were grouped into an overall better buildings
buildings to appreciate that building improvements, in general, have effects comparable
to other corporate strategies. Further, there are not enough studies of any one
intervention type to be able to see reliable effects across multiple metrics (the specific
building interventions are detailed in Appendix C).
Office Type
Private offices were compared to open-plan accommodation. This is a scenario that has
been studied relatively frequently, as it is a design option explored by a large number of
organizations.
Workplace Health Programs (WHP)
WHPs often form part of the benefits package in large organizations, typically offered
as bundles of measures; e.g., health counselling, gym access, nutrition programs, stress
management, medical tests (e.g., blood pressure). These are distinct from health
insurance benefits, which differ widely from one country to another and were therefore
outside the scope of this review.
Bonuses
It is a common belief that financial incentives will elicit employee behaviours that will
benefit organizational productivity. This review focused on bonuses provided for
general job performance, typically evaluated by a manager, rather than bonuses for a
specific behaviour.
Flexible Work Options
Studies have typically looked at a package of options, and might include flexibility in
multiple workplace locations within the building, or the ability to telework.
Literature Search
The bibliographic databases and sources searched were: Scopus, PsycInfo, Google
Scholar, APA Center for Organizational Excellence, Conference Board of Canada. For
the benchmarks, the sources were: General Social Survey (University of Chicago), US
Dept. of Labour, Labour Statistics, Statistics Canada, Nobscott Statistics, National
Institute for Occupational Safety and Health (NIOSH), Organization for Economic
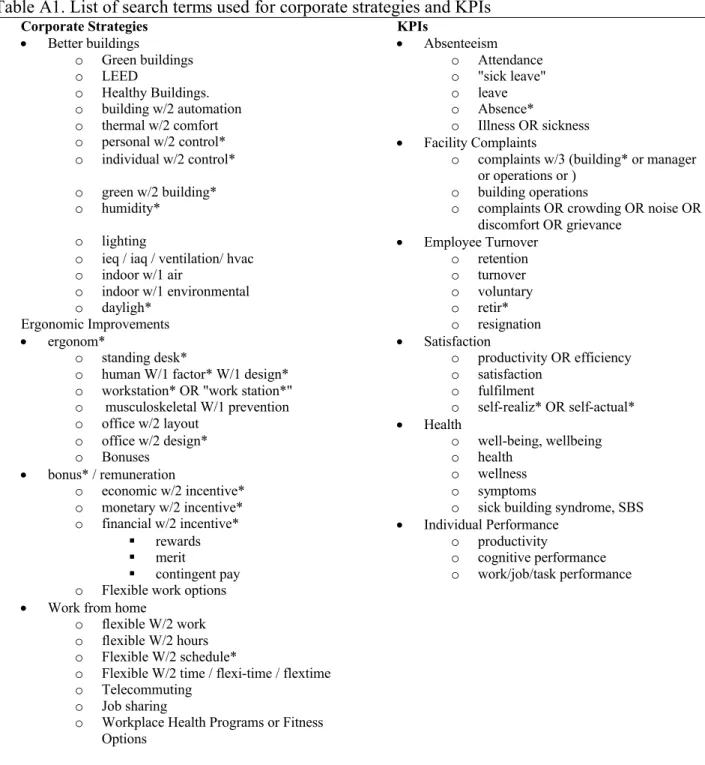
Co-operation and Development (OECD), Gallup, General Social Survey. The list of search
terms is shown in Appendix A. Table 1 shows the number of publications identified and
those used to derive the results. Over 550 abstracts were reviewed, and if the abstract
looked promising the full paper was obtained and read. If the contents of the paper
passed the screening criteria, and provided results in a format compatible with the
derivation of the main effects of treatments/strategies, then it was included in the final
results table.
For inclusion in this investigation, studies needed to include a comparison between the
outcomes with and without the target strategy, or to be a meta-analysis or review of the
topic. Papers were examined to ensure that the work met criteria for research quality.
Results were required to be reported in sufficient statistical detail in order to enable
comparisons and, if necessary, to rescale results from heterogeneous studies into
equivalent units. Appendix B explains the rescaling method, for those studies that
required it.
Results
Table 2 presents a tabulated summary of the resultsi. This is supplemented below by a
narrative section on each KPI, describing the benchmark derivation and citing studies
used to derive the effects of strategies, and other supporting studies. The numbers in the
cells in the body of Table 2 represent the preponderance of available information in
studies that met the inclusion criteria, and is based on judgement (i.e., it is not the result
of a quantitative meta-analysis). If several studies contributed a variety of results, the
cell shows the range. That range might start at zero if several studies found no effect
and several others found consistent, non-zero effects. An arrow indicates the direction
of the effect. Empty cells denote combinations of corporate strategies and KPIs for
which no relevant studies that met our inclusion criteria were found. Appendix C
provides details of the studies that contributed to the conclusions for each cell of Table
2.
Table 2 shows only simple main (direct) effects. These are easy to interpret, but there
are likely to be indirect effects as well. For example, if a strategy improves job
satisfaction, there would likely be a consequent reduction in employee turnover, even if
there are no studies for that strategy directly evaluating retention effects. These indirect
effects are not explicitly addressed in Table 2 nor in this paper.
[Table 2 Here]
Absenteeism
Absenteeism: Benchmarks
Absenteeism data are available from national statistical databases, but there are
because they are more directly comparable to the scientific studies of the effects of
strategies.
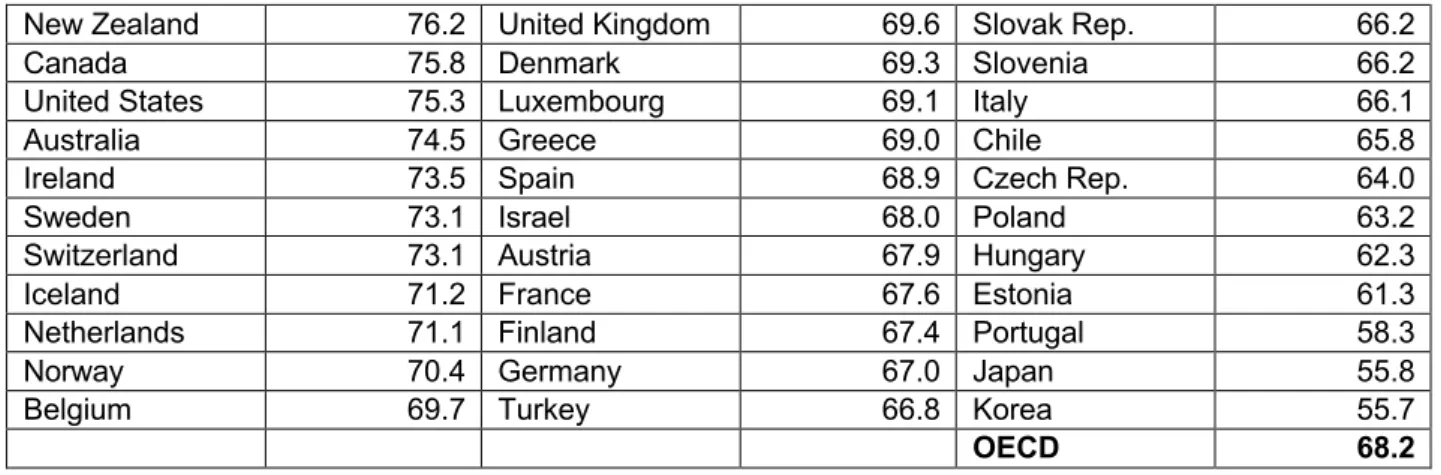
Figure 1 shows OECD (2017) data, which is the best source of country-to-country
comparison. Some of the variation between countries may be methodological, although
other differences caused by differences in culture, health care provision, and
employment contract norms may also be expected.
Figure 1. Absenteeism data from multiple OECD countries; if a country has data for more than one year the value shown is the mean over those years.
Within countries, there is often considerable variation in absenteeism by industry type.
Table 3 shows data by industry type for Canada (Statistics Canada, 2016). Therefore,
for benchmarking a national average might be of limited value, and a corporate
decision-maker might be well-advised to consider industry-specific data.
[Table 3 Here]
Newsham et al. (2013) conducted a post-occupancy evaluation of 12 “green” and 12
matched conventional buildings across Canada and the Northern USA. Mean
self-reported sick leave was equivalent to 7.1 days/pers/yr (N=782), consistent with the
national data sets.
Absenteeism: Effects of Corporate Strategies
Effects of Better Buildings: Not surprisingly, these depend on the specific better
building feature: Milton, Glencross, and Walters (2000) found that a higher outdoor air
depending on age and gender, compared to a lower outdoor air rate (~12 l/s/p). Niemela,
Seppanen, Korhonen, and Reijula (2006) reported that an air quality intervention
(cleaning the ventilation system, replacement of duct lining, and air flow balancing) was
associated with a reduction in short-term absenteeism equivalent to 0.65 days/pers/yr.
Veitch, Newsham, Mancini and Arsenault (2010) found that new direct-indirect electric
lighting with personal dimming control allied with new office furniture (lower,
lighter-coloured panels defining cubicles) compared to the pre-existing electric lighting of
direct parabolic luminaires with older office furniture (higher, darker-coloured panels)
was associated with a reduction in absenteeism of 0.4 days/pers/yr. Preller, Zweers,
Brunekreef, and Boleij (1990) also found that elements of personal control, in their case
ability to adjust temperature and open windows, were associated with lower sick leave.
Singh, Syal, Korkmaz, and Grady (2011) observed statistically-significant, though small
improvements in staff absenteeism following a move from conventional to green
(LEED certified) buildings, but effects were limited to employees with specific medical
conditions (e.g. asthma, respiratory allergies).
Effect of Office Type: Pejtersen, Feveile, Christensen, and Burr (2011) demonstrated
that private offices were associated with 3.2 days/pers/yr lower sick leave compared to
open-plan offices with more than six occupants (any office with more than one occupant
was associated with higher sick leave)iii. Bodin Danielsson, Chungkham, Wulff, and
Westerlund (2014) also reported an overall trend for open-plan spaces to have a higher
(risk of) sick leave than private offices.
Effect of Workplace Health Programs: Baicker, Cutler, and Song's meta-analysis (2010)
suggested an (unweighted) mean reduction of 1.8 days/pers/yr due to WHPsiv.
“There is moderate evidence that work health promotion decreases sickness absences”.
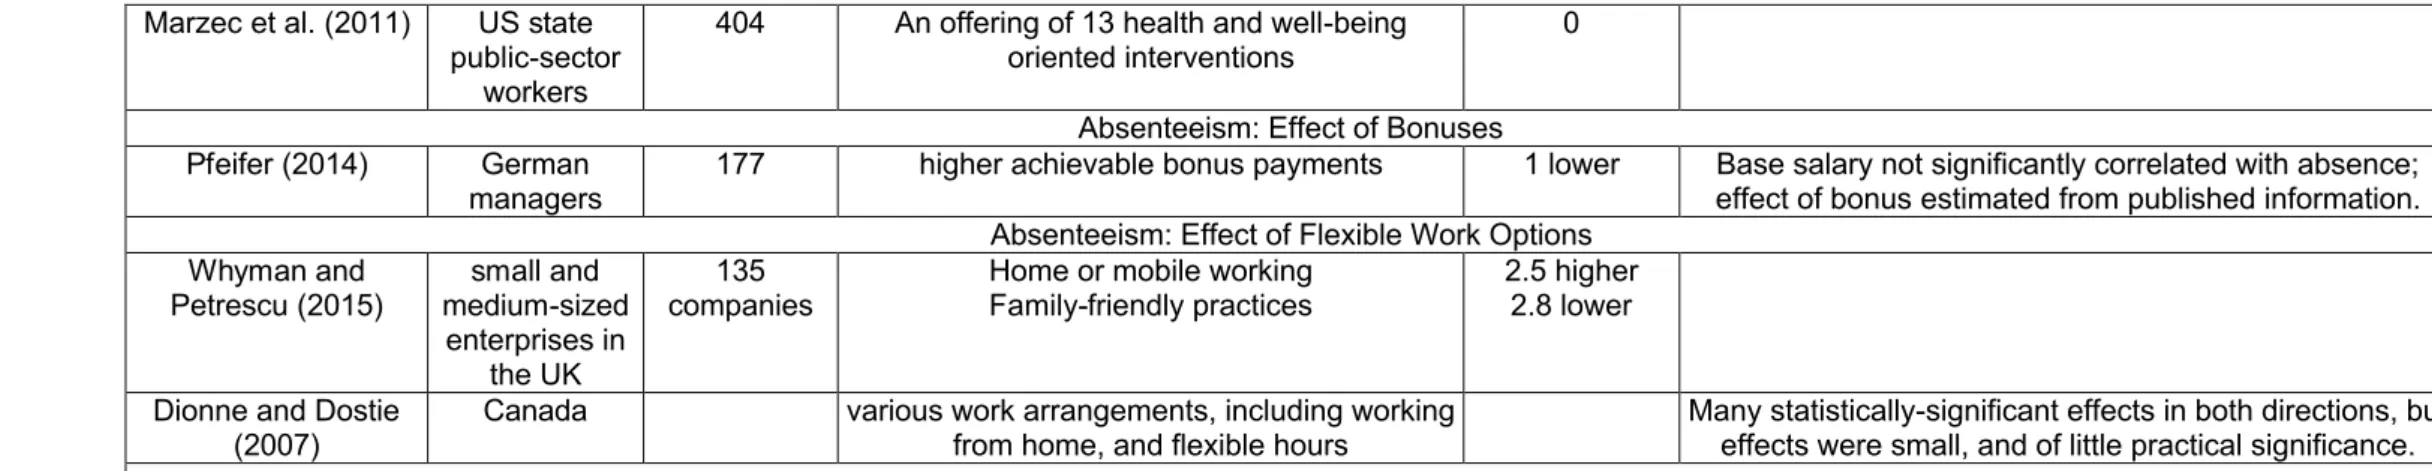
Marzec et al. (2011), however, found no statistically-significant effect.
Effect of Bonuses: Pfeifer (2014) found that higher achievable bonus payments
correlated with fewer sick days. The most conservative estimate of the effect was a
reduction of absenteeism of 29% (equivalent to 1 day/pers/yr) for each log-point
increase in the maximum achievable bonus. A one log-point increase in this sample, in
the middle of the range, was equivalent to around €8500.
Effect of Flexible Work Options: In Whyman and Petrescu (2015), home or mobile
working was associated with higher absenteeism (by 2.5 days/pers/yr); and,
family-friendly practices were linked to lower absenteeism levels (by 2.8 days/pers/yr). Dionne
and Dostie (2007) examined a variety of work arrangements, including working from
home, and flexible hours. Many statistically-significant effects were found in both
directions, but these effects were very small, and of little practical significance.
Employee Turnover
Employee Turnover: Benchmarks
National-level data on turnover intent are typically captured in social surveys directed at
households. Medina (2012) looked at the 2010 data for the University of Chicago
General Social Surveyv(N=4618) and reported that the average likelihood of looking
for a new job was 23 on a 0-100 scale. This is comparable to other North American
samples: The University of Michigan Work, Family and Health Study (2015)
aggregated data over 2009-2012 from two US companies (IT and extended care,
N=9148) and reported an average likelihood of looking for a new job of 30 on a 0-100
office employees in Canada and the northern US, data from 2010-2011). Turnover
intent appears to be lower in Japan, with a score of 18 for 2010 (Tanioka, Maeda, &
Iwai, 2010).
Employee Turnover: Effects of Corporate Strategies
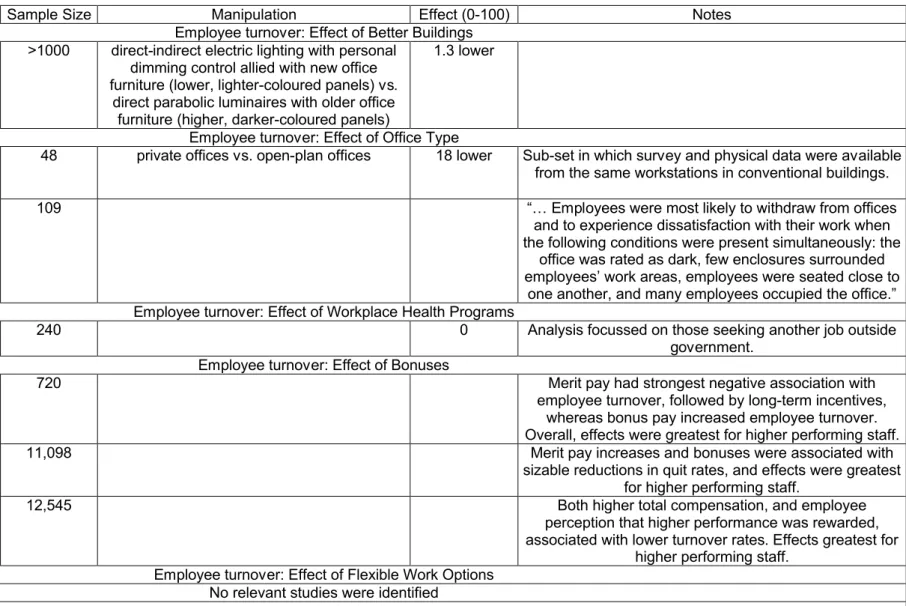
Effect of Better Buildings: Veitch et al. (2010) measured turnover intention using the
same scale as Newsham (2013). Direct-indirect electric lighting with personal dimming
control allied with new office furniture was associated with a 1.3 point reduction in
turnover intent compared to the pre-existing electric lighting and furniture.
Effect of Office Type: A subset of data from Leder, Newsham, Veitch, Mancini, &
Charles (2016), limited to conventional buildings in the sample, indicated an 18-point
lower intent to turnover score in private offices compared to open-plan offices; there
were no statistically-significant main effects by job type or tenure. Oldham and Fried
(1987) concluded that, “… Employees were most likely to withdraw from offices and to
experience dissatisfaction with their work when the following conditions were present
simultaneously: the office was rated as dark, few enclosures surrounded employees’
work areas, employees were seated close to one another, and many employees occupied
the office.”
Effect of Workplace Health Programs: Caillier (2016) found no direct effect of health
and wellness programs on intent to turnover.
Effect of Bonuses: Studies in this category reported actual turnover, not intent to
turnover, but there was insufficient information to form a numerical conclusion. Park
and Sturman (2016) found that all forms of pay-for-performance were associated with
had the strongest negative association with employee turnover, followed by long-term
incentives, whereas bonus pay actually increased employee turnover. Overall, effects
were greatest for higher performing staff. Salamin and Hom (2005) found that both
merit pay increases and bonuses were associated with sizable reductions in quit rates,
and, overall, effects were greatest for higher performing staff. In Nyberg (2010), both
higher total compensation and employee perception that higher performance was
rewarded, were associated with lower turnover rates. Again, overall, effects were
greatest for higher performing staff.
Effect of Flexible Work Options: No relevant studies were identified.
Self-assessed Performance
Self-assessed Performance: Benchmarks
There appear to be no relevant national level databases. Given the typical format of such
questions (-30% to +30% scale), one would expect that an environment that is neutral
would yield a value of zero. For example, Veitch, Charles, Farley, & Newsham, (2007)
collected data from nine office buildings across Canada and the USA; the mean
response was -1.5% (N=747). Newsham, et al. (2013) recorded a mean response of
0.1% (N= 2523).
Self-assessed Performance: Effects of Corporate Strategies
Effect of Better Buildings: Singh et al. (2011) found a 2% improvement in perceived
productivity associated with the move to green buildings. Agha Hossein, El-Jouzi,
Elmualim, Ellis, and Williams (2013) found the equivalent of a 5% improvement in
self-assessed performance associated with staff moving from an older HQ building to a
refurbishment achieved a high sustainable building certification. Baird, Leaman, and
Thompson’s (2012) analysis of data from a worldwide set of buildings reported a
statistically-significant difference in the effect of environmental conditions on perceived
productivity of 7.8% favouring sustainable buildings. Thomas (2010) reported an
improvement of 9.6% in self-reported productivity associated with a staff move from a
conventional building to a new building with a superior sustainability certification. In
Oseland and Burton (2012), office workers in 1950s legacy buildings indicated a mean
perceived productivity rating 2.2% lower than in more recently-built buildings, and
4.8% lower than in the newest building.
Effect of Office Type: Data from Newsham, et al. (2013) indicate a statistically
significant main effect of office type, suggesting a 7.7% improvement associated with
private officesvi. Bergstrom, Miller, and Horneij (2015) studied office workers moving
from private to open-plan offices and found the equivalent of an 8.1% decline in
perceived productivity associated with the move. Brennan et al. (2002) studied office
workers moving from (mostly, 76%) private offices in a downtown high-rise to (mostly,
81%) shared/open-plan offices in a business park. A decline in perceived productivity
equivalent to 13.0% was associated with the move. Lee’s (2010) study of
LEED-certified buildings indicated that private offices had statistically-significantly higher
perceived productivity scores than all types of shared or open offices. For example, the
mean response from private offices was 14.6% higher than for high-panel cubicle
offices.
Effect of Workplace Health Programs: Coffeng et al. (2014) found a
statistically-significant effect of WHP equivalent to ~5-10%. Rongen, Robroek, van Lenthe, and
Two of these included a measure of productivity, one of which showed a significant
positive effect of a WHP, and the other showed no effect. Other studies have
demonstrated no effect of WHPs on self-reported performance (Vuokko et al., 2015;
Blake, Zhou, and Batt, 2013; Pereira, Coombes, Comans, and Johnston, 2015).
Effect of Bonuses: Studies in this section typically used an objective performance
metric, rather than a self-assessed measure. In Stajkovic and Luthans (2001), simple
bonuses for increased performance were associated with a statistically-significant
improvement in performance over baseline of 11%; bonuses allied with a formal
process to identify organizational deficiencies increased performance by 32%. In
O’Neill (2014), although there was an increase in mean sales per week after a bonus
was applied, this difference was not statistically significant. However, when the bonus
was subsequently removed, there was a statistically-significant decrease in sales of
22.4%. In Raj, Nelson, and Rao (2006), employees (N=18) who were offered monetary
rewards and extra paid leave exhibited significantly higher performance assessed by
management-appointed observers. Nevertheless, other non-monetary interventions
(feedback, flexible dress code, flexible working hours) had similar or larger benefits.
In Lowery, Petty, and Thompson (1995), of all employees, 70% agreed that the bonus
plan had a positive effect on their work habits and performance, but only 47% agreed
that it had improved their personal productivity; nevertheless, 70% agreed that it had
improved the company’s performance. Garbers and Konradt's meta-analysis (2014)
showed that the overall effect of incentives for individuals (116 studies) was statistically
significant, and positive. Effects were larger for qualitative, rather than quantitative,
performance measures, and for more complex tasks.
Job Satisfaction
Job Satisfaction: Benchmarks
Benchmarks for job satisfaction exist in national and international social surveys.
Typically these data came from the working population as a whole, and were not limited
to office workers. The University of Chicago General Social Survey (2016) shows an
average of 65-66 on a 0-100 scale between 2002-2014, based on ~2000-4500
respondents in the USA general population. The University of Michigan Work, Family,
and Health Study (2015) reported average job satisfaction was 78, and Gallup data
(2017) show an average job satisfaction of 67-76. Workplace survey results are
consistent: Newsham, et al. (2013), average = 77. Veitch, et al.’s (2007) average = 68.
The range of job satisfaction averages is similar around the world. The Japanese
average was 66 (Tanioka et al., 2010), and Figure 2 presents the mean responses in
2013 from a sub-set of European countries (Eurostat, 2015).
Figure 2. Job satisfaction data for a sample of European countries.
Job Satisfaction: Effects of Corporate Strategies
Effect of Better Buildings: In Veitch et al. (2010), direct-indirect lighting with personal
control (+new cubicles) was associated with an improvement in job satisfaction of 6
points when normalized to a 100-point scale, compared to direct parabolic lighting
(+old cubicles). Hongisto, Haapakangas, Varjo, Helenius, and Koskela (2016) studied a
collection of work environment improvements, including better environmental
switches), increased privacy, and more ergonomic furniture (including sit-stand desks).
The refurbishment was associated with a statistically-significant increase in job
satisfaction of the equivalent of 4 points. In Agha Hossein et al. (2013), the newly
refurbished office was associated with a statistically-significant increase in job
satisfaction of the equivalent of 9 points.
On balance, studies suggest that “better buildings” are associated with higher overall job
satisfaction. However, Newsham, et al. (2013) found no statistically-significant
difference in job satisfaction between green and conventional buildings. Similarly,
McCunn and Gifford (2012) also found no correlation between the number of green or
sustainability features present in a building and the overall engagement of employees in
their work (a composite variable including self-reported productivity, affective
organizational commitment, and job satisfaction).
Effect of Office Type: In Bergstrom et al. (2015), the prior, private offices were
associated with a statistically-significant higher mean response of the equivalent of 10
points, compared to the new open offices. Pejtersen et al. (2011), found a systematic
decline from single-person offices to offices shared with increasing numbers of people.
The comparison of private offices to the largest shared spaces was associated with a
higher mean response of the equivalent of 4.7 points. Bodin Danielsson and Bodin
(2009), asked whether “the workspace design did not contribute to job satisfaction".
There was a statistically-significant effect of office type, with 31% of occupants of
private offices agreeing with this statement, compared to 64% of the occupants of large
open-plan offices. De Croon Sluiter, Kuijer, and Frings-Dresen's review of 49 studies
(2005) concluded that “… working in open workplaces reduces privacy and job
satisfaction” was attributable to four workplace characteristics: social density, number
of enclosures, interpersonal distance, and room darkness; the first three characteristics
all relate to office layout, and the maximum enclosure value would correspond to a
private office.
Effect of Workplace Health Programs: In Caillier (2016), results indicated a
statistically-significant and positive association between health and wellness programs
and job satisfaction, equivalent to a 12-point improvement. Conn, Hafdahl, Cooper,
Brown, and Lusk's meta-analysis (2009) found a statistically-significant and positive
effect, in which physical activity programs improved job satisfaction for studies of one
research design type (two-group pre-post) but not for two other research design types
(two-group post-test, treatment pre-post). Marzec et al. (2011) found no effect on job
(dis)satisfaction. Blake et al. (2013) did show a statistically-significant improvement in
job satisfaction associated with the wellness intervention, but the size of the effect was
so small as to have no practical significance.
Effect of Bonuses: In Lowery et al. (1995), only 46% of all employees agreed that the
bonus plan had a positive effect on their job satisfaction, although the figure was 61%
for the sub-group of employees who were managers.
Effect of Flexible Work Options: Fonner and Roloff (2010) compared teleworkers who
worked remotely at least three days per week with office-based workers who were in an
office environment at least three days per week. The direct effect of telework was a
statistically-significant improvement in job satisfaction of the equivalent of 10.3 points.
Consideration of indirect effects, through benefits of telework on aspects including
work-life balance, information exchanges, and management of interruptions, elevated
flexible work options, neither telework nor flex-time, on job satisfaction. Nijp, Beckers,
van de Voorde, Geurts, and Kompier (2016) found no statistically-significant effect of
temporal and spatial flexibility in work patterns on job satisfaction.
Health and Well-being (symptoms)
Health and Well-being (symptoms): Benchmarks
National statistical databases or social surveys appear not to address SBS-like
symptoms in the general population. The benchmarks shown in Table 2 are based on
research study populations (Newsham et al., 2013; Hongisto et al., 2016) in
conventional buildings or prior to any intervention hypothesized to improve symptoms.
Both of these studies measured frequency of occurrence of a collection of multiple
symptoms. Although the specific symptoms, and the response scale differed between in
the studies, in both cases a score of zero meant no symptoms ever occurred, and a score
of 100 meant all symptoms occurred all the time; see Appendix B.3 for details. Physical
symptoms average 32 (Newsham et al., 2013) to 56 (Hongisto et al., 2016) on a 0-100
scale; visual symptoms tend to have lower frequency of occurrence for individuals: 29
(Newsham et al., 2013) to 45 (Hongisto et al., 2016).
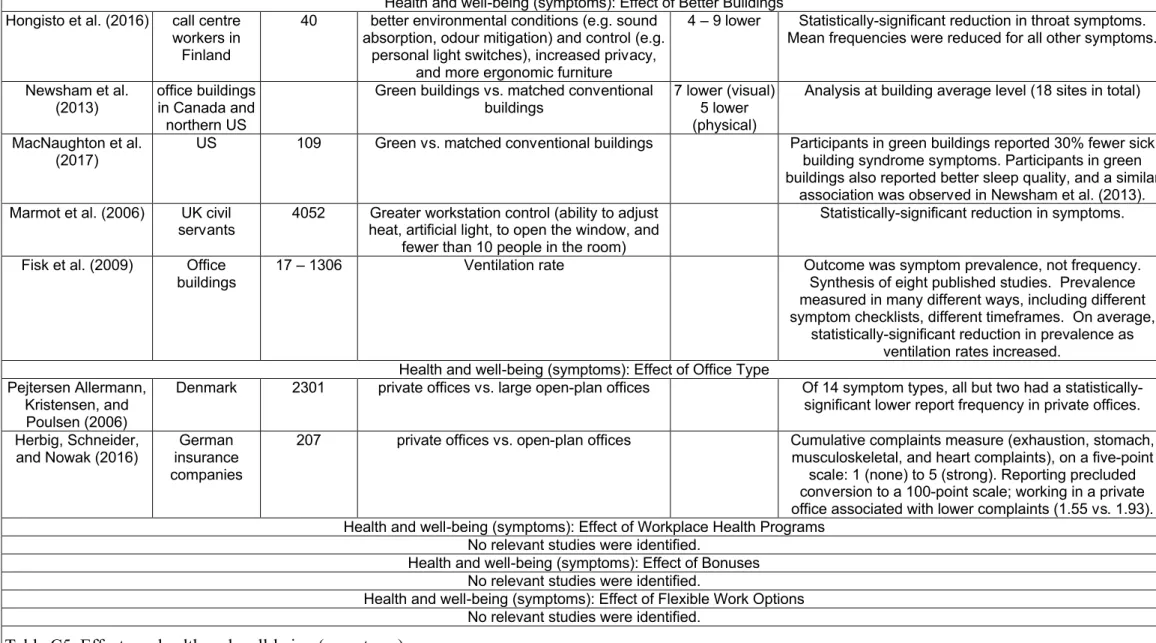
Health and Well-being (symptoms): Effects of Corporate Strategies
Effect of Better Buildings: Hongisto et al. (2016) tested a set of work environment
improvements, which was associated with a statistically-significant reduction in throat
symptoms. Mean frequencies were reduced for all other symptoms, including a notable
trend for reduced headache, suggesting a reliable reduction in symptoms overall; the
size of the effects was equivalent to 4-9 points. In Newsham et al. (2013), green
physical symptom frequency, compared to conventional buildings; the size of the
effects was equivalent to 7 (visual) and 5 (physical) points. In MacNaughton et al.
(2017), participants in green buildings reported 30% fewer sick building syndrome
symptoms, compared to participants in similar conventional buildings. Interestingly,
participants in green buildings also reported better sleep quality, a finding that agrees
with a similar beneficial association with green buildings reported by Newsham et al.
(2013). In Marmot et al. (2006), a combined measure of workstation control (ability to
adjust heat, artificial light, to open the window, and fewer than 10 people in the room)
was associated with a statistically-significant reduction in symptoms. Seppanen et al.
(1999) synthesized results from multiple studies in real buildings examining the effect
of ventilation rate on SBS symptoms. In Fisk et al. (2009) additional studies were
considered in producing an average overall relationship. Symptom prevalence was
measured in many different ways across studies. Nevertheless, on average, and
assuming a baseline symptom prevalence of 20%, an increase in ventilation rate from
10 l/s/pers to 25 l/s/pers was associated with a reduction in symptom prevalence of
6.8%.
Effect of Office Type: Pejtersen Allermann, Kristensen, and Poulsen (2006), studied 14
symptom types, finding that all but two had a statistically-significant lower report
frequency in private offices compared to large, open offices. Herbig, Schneider, and
Nowak (2016) reported that working in an open-plan office was associated with a
statistically-significant increase in cumulative complaints compared to private offices.
Effect of Workplace Health Programs: No relevant studies were identified.
Effect of Flexible Work Options: No relevant studies were identified.
Health and Well-being (overall)
Health and Well-being (overall): Benchmarks
The OECD publishes data on perceived health status for their member countries
(OECD, 2015). Methodology varies by country, but is generally based on a single item,
such as asking respondents to rate their health as “excellent”, “good”, “fair”, or “poor”
(Bowling, 2004), . The following multipliers converted this to a 0-100 scale: “Good or
very good”=80; “fair”=50; “bad or very bad”=20. The result is shown in Table 4.
[Table 4 Here]
The cited studies below used different scales to evaluate various concepts of overall health or well-being. For comparison, each of these concepts was treated as equivalent, and each scale was converted to a 0-100 point score where a higher score meant better well-being, as with the OECD benchmark. Details for each study are shown in Table C6.
Health and Well-being (overall): Effects of Corporate Strategies
Effect of Better Buildings: Baird et al.’s analysis (2012) suggested an improvement in
overall health of the equivalent of approximately 10 points attributable to sustainable
buildings. In Agha Hossein et al. (2013), a move to the refurbished building was
associated with the equivalent of a 6-point improvement in self-assessed health.
Effect of Office Type: Bergstrom et al. (2015) reported the equivalent of a 12-point
drop in self-reported overall health associated with the move from private to open-plan
offices. Herbig et al. (2016) found that working in an open-plan office was associated
Seddigh, Berntson, Bodin Danielson, and Westerlund (2014) found no main effect of
office type on general health, but private offices were associated with lower reported
levels of cognitive stress. Pejtersen et al. (2006) found no statistically-significant
difference between office sizes on general health and mental health.
Effect of Workplace Health Programs: Marzec et al. (2011) reported no
statistically-significant change in health risk as a result of wellness interventions and no effect on
self-reported stress. There was, however, a statistically-significant reduction on life
dissatisfaction, but a statistically-significant increase in blood pressure. Kuoppala et al.
(2008) reviewed seven studies conducted in an office setting, and concluded that WHP
had no effect on physical well-being. Rongen et al.’s meta-analysis (2013) included two
office studies that included a measure of general health. One of these showed a
significant positive effect of a WHP, whereas the other showed no effect. Butterworth,
Linden, McClay, and Leo (2006) found no significant effect of WHPs on physical
health, but there was a significant improvement of 3.5 points on mental health. Vuokko
et al. (2015) reported no effective improvement in physical or mental health from a
WHP intervention. Blake (2013) reported no effect on general health or mood.
Effect of Bonuses: No relevant studies were identified.
Effect of Flexible Work Options: Nijp et al. (2016) found no statistically-significant
effect of temporal and spatial flexibility in work patterns on stress. There were
statistically-significant, but small effects on both fatigue and general health. There was
actually a decline in self-reported health equivalent to 6 points associated with
Complaints to the Facilities Manager
No relevant studies pertaining to any organizational strategy were identified.
Nonetheless, there is some related work that can inform further investigation. Federspiel
(1998) analyzed complaint logs from more than 600 US buildings. There were more
than 4,000 complaints related to environmental conditions, and thermal sensation was
the biggest single cause. Most complaints were the result of poor control performance
and heating, ventilation, and air-conditioning (HVAC) system faults, and thermal
sensation complaints took, on average, around two hours of technician time to resolve.
Further, Wang, Federspiel, and Arens (2005) established a statistically-significant
correlation between dissatisfaction with the thermal environment, assessed via survey,
and unsolicited complaints to the facility manager.
Discussion and Recommendations
The goal of this work was to take a broad look at the available information across
multiple metrics, methodologies and domains; the value of this study is in the
comparisons it facilitates. There were relatively few studies that met the inclusion
criteria, and adequate information was not available to facilitate a reliable formal
meta-analysis. Given the breadth of disciplines and outcomes, no such review could claim to
be truly comprehensive with any reasonable set of resources. Nevertheless, the literature
search conducted in this study was very broad, and given its consistent framework,
provides a sound basis for further development. Further, our interpretation and rescaling
of results from multiple diverse studies onto common scales required a certain degree of
subjectivity: Data were not available or suitable for a more formal meta-analysis. Thus,
this work is better considered as a semi-quantitative assessment necessitating some
elsewhere. Although certainly not definitive, this work is a useful starting point to
inform future work on the full valuation of “better buildings” technologies, and to open
dialogue with organizational decision-makers concerning the connections between real
estate and HR departments.
The review showed consistently that, in general, “better buildings” offer benefits across
multiple productivity metrics that are comparable in size to the benefits from other
corporate programs. The Stoddart Review (2016) concurred that improving the physical
environment in workplaces is an important and under-recognised lever to increasing
productivity. Comparison to other corporate programs provides an appealing and
meaningful basis for corporate decision-makers to value “better buildings” investments.
However, “better buildings” as defined here is a broad category including different
intervention types, this was simply because there was an insufficient number of primary
sources that met our inclusion criteria on which intervention-specific conclusions could
be based. Although one may conclude that improvements in building environments
generally may be reasonably expected to have positive effects on corporate KPIs,
decision-makers will likely need more specific information. It is hoped that this paper
will stimulate future buildings research to be designed to deliver more such information.
Thus, it remains for future research to develop clear guidance concerning the effects of
specific better buildings strategies on the full slate of KPIs, to enable decision-makers to
choose between alternative ways to improve their buildings and to have the best overall
effect on their organization’s performance.
Further, enhancement of the productivity metrics with investments in buildings will, in
many cases, have benefits not only to the organization, but also to the individual
occupant health and well-being.
The effects in Table 2 are likely not additive. Nevertheless, one might expect a second
positive strategy to have a positive effect, although perhaps a smaller effect than it
would have if it were applied first. The analysis here focussed on direct effects, but
some cited studies did look at indirect effects and effects of strategies on multiple
productivity metrics.
Although the effect sizes of different strategies may be similar in their outcomes, the
mechanisms might be quite different. A private office might reduce absenteeism by
limiting the airborne transport of pathogens, whereas a bonus might reduce absenteeism
by eliciting greater enthusiasm for time on task, for example.
In addition to the overall effects of “better building” strategies, the data show also show
consistently that private offices produce better outcomes than open-plan offices. This is
supported by the large dataset collected under the Leesman Index (2016). Despite this,
open-plan offices dominate the market. Two explanations are often suggested: savings
in real-estate costs; and, the belief (with little support in objective data (Brill et al.,
2001; Veitch, 2012)) that open offices enhance collaboration and communication.
Nonetheless, the overall organizational productivity consequence of abandoning private
offices for all job types might not be what organizations expect.
Although the directions of effects in Table 2 are almost always as hypothesized, and in
agreement with common sense, we cannot rule our publication bias among the primary
sources available to our review. Studies that found null results, or results that
contradicted common hypotheses, might not have been submitted or accepted for
which the stated effect sizes are based, is surprisingly limited. Thus, new information
could change the magnitude, and possibly the direction, of some effects. These results
cannot be considered robust until more studies have been completed.
There are several workplace outcomes that have a high emerging profile among
white-collar organizations, but which do not have associated study data to allow them to be
metrics in this study. One example of this is employee engagement; there are industry
surveys on engagementvii, but there is no firmly established operational definition
among researchers (e.g. Byrne, Peters, & Weston, 2016). Other concepts that managers
and designers often expect to improve via workplace design, but which await validated
outcome measures, include creativity (Stokols, Clitheroe, & Zmuidzinas, 2002),
communication, attraction (of new employees), and presenteeism (Hemp, 2004). One
avenue for future work would be to establish valid, reliable measures for these concepts
and to demonstrate their sensitivity to building characteristics.
Despite the fact that the task performance of individuals is not synonymous with
organizational productivity in the modern service-based economy, the performance of
individuals does play a role. It would be very valuable for researchers to develop
meaningful, generalizable ways to quantify employee performance in the white-collar
workplace. One possibility would be to use standardized testing, as in MacNaughton et
al. (2017): Office workers completed standard cognitive function tests. Participants in
green buildings scored 26.4% higher than participants in similar conventional buildings.
Although this standard task represents only one component of the work behaviours
necessary for an employee to make a positive contribution to organizational
productivity, the direction of the effect is as many would predict.
examined here and to develop new metrics for organizational productivity. For example,
the increasing density of sensors at fixed locations (e.g. integrated into new LED
lighting systems) together with objects that form the “Internet of Things” (IoT) and data
from wearable sensors carried by occupants, could be used to track assets, space use,
communication patterns, occupancy etc.
To facilitate comparisons between studies, researchers should coalesce on standard
methods of evaluating organizational productivity metrics. Where applicable, choosing
methods that are used by national statistical organizations (or similar), and which form
the benchmarks in this study, would be valuable. Such methods are then validated with
large datasets, and have a point of reference that is maintained over time.
Another barrier to the effective comparison of studies was diverse standards of
reporting, particularly with respect to potential use of the information by corporate
decision-makers who are not research experts. Researchers should report basic
descriptive statistics such as means and standard deviations, even when the focus is
correlations between variables or tests of causal theory. Simple main effects could
deflect attention from more complex interactions, moderating and mediating effects etc.,
but if work is to affect practice positively, results must be presented in a manner that is
meaningful and actionable by corporate decision-makers. Recognition of main effects
may be an appropriate stimulus to the exploration of more subtle interactions.
There is also a strong need for longitudinal data and analysis. Many of the studies cited
here are cross-sectional, and often illustrate correlations. In most cases there are
sensible hypotheses and mechanisms from which to imply causation, but these should
be proven in future research. Long-term data collection could also verify whether
A surprising gap in the literature was the lack of studies employing complaints to the
facility manager as an outcome. These data are routinely collected and archived in most
large organizations. Responding to a complaint has tangible costs, therefore reducing
complaints via investments in “better buildings” would have a relatively straightforward
business case.
Conclusions
This literature synthesis demonstrated that better buildings strategies (e.g. improved
ventilation, enhanced lighting conditions, green building certification measures) provide
benefits to multiple organizational productivity metrics at levels similar to other popular
corporate strategies that are implemented at the employee level. This supports the
greater consideration by HR and corporate decision-makers of better buildings
strategies as measures to improve organizational productivity.
References
* Denotes papers from the literature review that contributed to the conclusions in Table 2.
*Agha-Hossein, M. M., El-Jouzi, S., Elmualim, A. A., Ellis, J., & Williams, M. L. (2013). Post-occupancy studies of an office environment: Energy performance and occupants' satisfaction. Building and Environment, 69, 121-130.
Al Horr, Y., Arif, M., Kaushik, A., Mazroei, A., Katafygiotou, M., Elsarrag, E. (2016). Occupant productivity and office indoor environment quality: a review of the literature. Building and Environment, 105, 369-389.
American Society of Interior Designers (ASID). (1999). Recruiting and retaining qualified employees - By design. American Society of Interior Designers. Retrieved from https://www.asid.org/sites/default/files/RecruitingRetaining.pdf.
Appel-Meulenbroek, R., Feijts, B. (2007). CRE effects on organizational performance: measurement tools for management. Journal of Corporate Real Estate, 9(4), 218-238.
*Baicker, K., Cutler, D., & Song, Z. (2010). Workplace wellness programs can generate savings. Health Affairs, 29(2), 304-311. doi: 10.1377/hlthaff.2009.0626
*Baird, G., Leaman, A., & Thompson, J. (2012). A comparison of the performance of sustainable buildings with conventional buildings from the point of view of the users. Architectural Science Review, 55(2), 135-144.
*Bergström, J., Miller, M., & Horneij, E. (2015). Work environment perceptions following relocation to open-plan offices: A twelve-month longitudinal study. Work: A Journal of Prevention, Assessment & Rehabilitation, 50(2), 221-228. doi: 10.3233/WOR-131798
Best, B. (2014, October 21). True or false: Saving energy in the workplace automatically drives productivity, from
http://www.energymanagertoday.com/true-false-saving-energy-workplace-automatically-drives-productivity-0105930/
Blake, H., Zhou, D., & Batt, M. E. (2013). Five-year workplace wellness intervention in the NHS. Perspectives in Public Health, 133(5), 262-271. doi:
10.1177/1757913913489611
*Bodin Danielsson, C., & Bodin, L. (2009). Difference in satisfaction with office environment among employees in different office types. Journal of Architectural and Planning Research, 26(3), 241-257.
*Bodin Danielsson, C., Chungkham, H. S., Wulff, C., & Westerlund, H. (2014). Office design's impact on sick leave rates. Ergonomics, 57(2), 139-147. doi:
10.1080/00140139.2013.871064
Bowling, A. (2005). Just one question: If one question works, why ask several? Journal
of Epidemiology and Community Health, 59, 342-345.
*Brennan, A., Chugh, J. S., & Kline, T. (2002). Traditional versus open office design: A longitudinal field study. Environment and Behavior, 34(3), 279-299.
Brill, M., Margulis, S. T., Konar, E., & BOSTI Associates (Eds.). (1984). Using office design to increase productivity. Buffalo, NY: Workplace Design and
Brill, M., Weidemann, S., Allard, L., Olson, J., Keable, E. B., & BOSTI Associates. (2001). Disproving widespread myths about workplace design. BOSTI Associates/Kimball International. Retrieved from
http://www.bosti.com/public.htm.
*Butterworth, S. W., Linden, A. L., McClay, W., & Leo, M. C. (2006). Effect of motivational interviewing-based health coaching on employees' physical and mental health status. Journal of Occupational Health Psychology, 11(4), 358-365. doi: 10.1037/1076-8998.11.4.358
Byrne, Z. S., Peters, J. M., & Weston, J. W. (2016). The struggle with employee
engagement: measures and construct clarification using five samples. Journal of Applied Psychology, 101(9), 1201-1227. doi: 10.1037/1076-8998.11.4.358. doi: 10.1037/apl0000124
*Caillier, J. G. (2016). Do work-life benefits enhance the work attitudes of employees? Findings from a panel study. [Article in Press]. Public Organization Review, 1-16. doi: 10.1007/s11115-016-0344-4
Coffeng, J. K., Hendriksen, I. J. M., Duijts, S. F. A., Twisk, J. W. R., van Mechelen, W., & Boot, C. R. L. (2014). Effectiveness of a combined social and physical environmental intervention on presenteeism, absenteeism, work performance, and work engagement in office employees. Journal of Occupational and
Environmental Medicine, 56(3), 258-265. doi: 10.1097/jom.0000000000000116 *Conn, V. S., Hafdahl, A. R., Cooper, P. S., Brown, L. M., & Lusk, S. L. (2009).
Meta-analysis of workplace physical activity interventions. American Journal of Preventive Medicine, 37(4), 330-339. doi: 10.1016/j.amepre.2009.06.008
*De Croon, E. M., Sluiter, J. K., Kuijer, P. P. F. M., & Frings-Dresen, M. H. W. (2005). The effect of office concepts on worker health and performance: A systematic review of the literature. Ergonomics, 48(2), 119-134.
*Dionne, G., & Dostie, B. (2007). New evidence on the determinants of absenteeism using linked employer-employee data. Industrial and Labor Relations Review, 61(1), 108-120. doi: 10.1177/001979390706100106.
Eurostat. (2015). Quality of life in Europe - facts and views – employment. Retrieved from
http://appsso.eurostat.ec.europa.eu/nui/show.do?dataset=ilc_pw01&lang=en;
http://ec.europa.eu/eurostat/statistics- explained/index.php/Quality_of_life_in_Europe_-_facts_and_views_-_employment#Job_satisfaction
Federspiel, C. C. (1998). Statistical analysis of unsolicited thermal sensation complaints in commercial buildings. Paper presented at the 1998 ASHRAE Winter Meeting, San Francisco, CA., USA.
*Fisk, W.J., Mirer, A.G. & Mendell, M.J. (2009). Quantitative relationship of sick building syndrome symptoms with ventilation rates. Indoor Air, 19, 159-165. *Fonner, K. L., & Roloff, M. E. (2010). Why teleworkers are more satisfied with their
jobs than are office-based workers: When less contact is beneficial. Journal of Applied Communication Research, 38(4), 336 - 361.
Gallup. (2017). Gallup historical trends: Work and workplace. Retrieved from: http://www.gallup.com/poll/1720/work-work-place.aspx.
*Garbers, Y., & Konradt, U. (2014). The effect of financial incentives on performance: A quantitative review of individual and team-based financial incentives. Journal of Occupational and Organizational Psychology, 87(1), 102-137. doi:
10.1111/joop.12039
Hemp, P. (2004). Presenteeism: At work - But out of it. [Review]. Harvard Business Review, 82(10), 49-58.
*Herbig, B., Schneider, A. S., & Nowak, D. A. (2016). Does office space occupation matter? The role of the number of persons per enclosed office space,
psychosocial work characteristics, and environmental satisfaction in the physical and mental health of employees. Indoor Air, 26(5), 755-767. doi:
10.1111/ina.12263
*Hongisto, V., Haapakangas, A., Varjo, J., Helenius, R., & Koskela, H. (2016). Refurbishment of an open-plan office – Environmental and job satisfaction. Journal of Environmental Psychology, 45, 176-191. doi:
http://dx.doi.org/10.1016/j.jenvp.2015.12.004
Kaplan, R. S., & Norton, D. P. (Eds.). (1992). The balanced scorecard -- translating strategy into action. Cambridge, MA: Harvard Business School.
*Kuoppala, J., Lamminpaa, A., & Husman, P. M. (2008). Work health promotion, job well-being, and sickness absences - A systematic review and meta-analysis. Journal of Occupational and Environmental Medicine, 50(11), 1216-1227. doi: 10.1097/JOM.0b013e31818dbf92
*Lee, Y. S. (2010). Office layout affecting privacy, interaction, and acoustic quality in LEED-certified buildings. Building and Environment, 45(7), 1594-1600. doi: 10.1016/j.buildenv.2010.01.007
Leesman Ltd. (2016). 100,000+ data report. London, UK: stodd Ltd. Retrieved from http://leesmanindex.com/wp-content/uploads/Leesman-100k-data-report-Jan16-INT-SP.pdf
*Lowery, C. M., Petty, M. M., & Thompson, J. W. (1995). Employee perceptions of the effectiveness of a performance-based pay program in a large public utility. Public Personnel Management, 24(4), 475-492. doi:
10.1177/009102609502400407
*MacNaughton, P., Satish, U., Cedeno Laurent, J.G. , Flanigan, S., Vallarino, J., Coull, B., Spengler, J.D., & Allen, J.G. (2017). The impact of working in a green certified building on cognitive function and health. Building and Environment, 114, 178-186
*Marmot, A. F., Eley, J., Stafford, M., Stansfeld, S. A., Warwick, E., & Marmot, M. G. (2006). Building health: An epidemiological study of "sick building syndrome" in the Whitehall II study. Occupational and Environmental Medicine, 63(4), 283-289. doi: 10.1136/oem.2005.022889
*Marzec, M. L., Golaszewski, T. J., Musich, S. A., Powers, P. E., Shewry, S. L., & Edington, D. W. (2011). Effects of environmentally-focused interventions on health risks and absenteeism. International Journal of Workplace Health Management, 4(3), 200-215. doi: 10.1108/17538351111172572
Medina, E. (2012). Job satisfaction and employee turnover intention: What does organizational culture have to do with it? Unpublished Master’s thesis, Columbia University, New York. Available at:
http://static1.1.sqspcdn.com/static/f/1528810/23319899/1376576545493/Medina +Elizabeth.pdf.
*Milton, D. K., Glencross, P. M., & Walters, M. D. (2000). Risk of sick leave associated with outdoor air supply rate, humidification, and occupant complaints. Indoor Air, 10(4), 212-221. doi:
Newsham, G.R., Brand, J., Donnelly, C.L., Veitch, J.A., Aries, M., Charles, K.E.
(2009). Linking indoor environment conditions to organizational productivity: a field study. Building Research & Information, 37 (2), 129-147.
*Newsham, G. R., Birt, B. J., Arsenault, C. D., Thompson, A. J. L., Veitch, J. A., Mancini, S., . . . Burns, G. J. (2013). Do ‘green’ buildings have better indoor environments? New evidence. Building Research & Information, 41(4), 415-434. doi: 10.1080/09613218.2013.789951
Newsham, G. R., Veitch, J. A., Zhang, M. Q. (Nikki), Galasiu, A. D., Henderson, I. S., Thompson, A. J. L. (2017). Improving Organizational Productivity with
Building Automation Systems. Continential Automated Building Association (CABA), Ottawa, Canada.
http://www.caba.org/productivity/
*Niemela, R. I., Seppanen, O. A., Korhonen, P. A., & Reijula, K. E. (2006). Prevalence of building-related symptoms as an indicator of health and productivity.
American Journal of Industrial Medicine, 49(10), 819-825. doi: 10.1002/ajim.20370
*Nijp, H. H., Beckers, D. G. J., van de Voorde, K., Geurts, S. A. E., & Kompier, M. A. J. (2016). Effects of new ways of working on work hours and work location, health and job-related outcomes. Chronobiology International, 33(6), 604-618. doi: 10.3109/07420528.2016.1167731
*Nyberg, A. (2010). Retaining your high performers: Moderators of the performance– job satisfaction–voluntary turnover relationship. Journal of Applied Psychology, 95(3), 440-453.
*O'Neill, S. S. (2014). The effects of charitable donations and cash bonuses on employee performance: A field study of call center sales agents. (Doctoral Dissertation), Golden Gate University, US. ProQuest Dissertations Publishing database. (3578561)
OECD (Organization for Economic Co-operation and Development). (2017). Health
status data. Retrieved from:
http://stats.oecd.org/index.aspx?DataSetCode=HEALTH_STAT
OECD. (2015). Health at a glance: 3. Health status – perceived health status. retrieved from:
lance-2015-14-en&mimeType=text%2fhtml&containerItemId=%2fcontent%2fserial%2f19991 312&accessItemIds=
*Oldham, G. R., & Fried, Y. (1987). Employee reactions to workspace characteristics. Journal of Applied Psychology, 72(1), 75-80.
*Oseland, N., & Burton, A. (2012). Quantifying the effect of environmental conditions on worker performance for inputting to a business case to justify enhanced workplace design features. Journal of Building Survey, Appraisal, and Valuation, 1(2), 151-164.
McCunn, L. J., & Gifford, R. (2012). Do green offices affect employee engagement and environmental attitudes? Architectural Science Review, 55(2), 128-134. doi: 10.1080/00038628.2012.667939.
*Park, S., & Sturman, M. C. (2016). Evaluating form and functionality of pay -for-performance plans: The relative incentive and sorting effects of merit pay, bonuses, and long-term incentives. Human Resource Management, 55(4), 697-719. doi: 10.1002/hrm.21740
*Pejtersen, J. H., Allermann, L., Kristensen, T. S., & Poulsen, O. M. (2006). Indoor climate, psychosocial work environment and symptoms in open-plan offices. Indoor Air, 16(5), 392-401. doi: 10.1111/j.1600-0668.2006.00444.x
*Pejtersen, J. H., Feveile, H., Christensen, K. B., & Burr, H. (2011). Sickness absence associated with shared and open-plan offices--a national cross sectional
questionnaire survey. Scandinavian Journal of Work, Environment & Health, 37(5), 376-382.
*Pereira, M. J., Coombes, B. K., Comans, T. A., & Johnston, V. (2015). The impact of onsite workplace health-enhancing physical activity interventions on worker productivity: A systematic review. Occupational and Environmental Medicine, 72(6), 401-412. doi: 10.1136/oemed-2014-102678
*Pfeifer, C. (2014). Base salaries, bonus payments, and work absence among managers in a German company. Scottish Journal of Political Economy, 61(5), 523-536. doi: 10.1111/sjpe.12056
*Preller, L., Zweers, T., Brunekreef, B., and Boleij, J.S.M. (1990). Sick leave due to work-related health complaints among office workers in the Netherlands.
Proceedings of Indoor Air '90, Fifth International Conference on Indoor Air Quality and Climate (Toronto), Vol. 1, 227-230.
*Rongen, A., Robroek, S. J. W., van Lenthe, F. J., & Burdorf, A. (2013). Workplace health promotion: A meta-analysis of effectiveness. American Journal of Preventive Medicine, 44(4), 406-415. doi: 10.1016/j.amepre.2012.12.007 Roznowski, M., & Hulin, C. (1992). The scientific merit of valid measures of general
constructs with special reference to job satisfaction and job withdrawal. In C. J. Cranny, P. Cain Smith & E. F. Stone (Eds.), Job satisfaction: How people feel about their jobs and how it affects their performance (pp. 123–163). New York, NY: Lexington Books.
*Salamin, A., & Hom, P. W. (2005). In search of the elusive u-shaped performance-turnover relationship: Are high performing Swiss bankers more liable to quit? . Journal of Applied Psychology, 90(6), 1204-1216. doi:
10.1037/0021-9010.90.6.1204
*Seddigh, A., Berntson, E., Bodin Danielson, C., & Westerlund, H. (2014).
Concentration requirements modify the effect of office type on indicators of health and performance. Journal of Environmental Psychology, 38, 167-174. doi: 10.1016/j.jenvp.2014.01.009
Seppanen, O.A., Fisk, W.J., & Mendell, M.J. (1999). Association of ventilation rates and CO2concentrations with health and other responses in commercial and
institutional buildings. Indoor Air, 9, 226-252.
*Singh, A., Syal, M. G., Korkmaz, S., & Grady, S. C. (2011). Costs and benefits of IEQ improvements in leed office buildings. Journal of Infrastructure Systems, 17(2), 86-94. doi: 10.1061/(asce)is.1943-555x.0000046
*Stajkovic, A. D., & Luthans, F. (2001). Differential effects of incentive motivators on work performance. Academy of Management Journal, 44(3), 580-590. doi: 10.2307/3069372
Statistics Canada. (n.d.) .Table 279-0030 1: Work absence statistics of full-time
employees by sex and North American Industry Classification System (NAICS). Retrieved from:
http://www5.statcan.gc.ca/cansim/a26?lang=eng&retrLang=eng&id=2790030& &pattern=&stByVal=1&p1=1&p2=38&tabMode=dataTable&csid=