HAL Id: hal-02632934
https://hal.inrae.fr/hal-02632934
Submitted on 27 May 2020
HAL is a multi-disciplinary open access
archive for the deposit and dissemination of sci-entific research documents, whether they are pub-lished or not. The documents may come from teaching and research institutions in France or abroad, or from public or private research centers.
L’archive ouverte pluridisciplinaire HAL, est destinée au dépôt et à la diffusion de documents scientifiques de niveau recherche, publiés ou non, émanant des établissements d’enseignement et de recherche français ou étrangers, des laboratoires publics ou privés.
Adaptation to climate through flowering phenology: a
case study in Medicago truncatula
Concetta Burgarella, Nathalie Chantret, Laurène Gay, Jean-Marie Prosperi,
Maxime Bonhomme, Peter Tiffin, Nevin D. Young, Joelle Ronfort
To cite this version:
Concetta Burgarella, Nathalie Chantret, Laurène Gay, Jean-Marie Prosperi, Maxime Bonhomme, et al.. Adaptation to climate through flowering phenology: a case study in Medicago truncatula. Molecular Ecology, Wiley, 2016, 25 (14), pp.3397-3415. �10.1111/mec.13683�. �hal-02632934�
Version postprint
Accepted
Article
This article has been accepted for publication and undergone full peer review but has not been through the copyediting, typesetting, pagination and proofreading process, which may lead to differences between this version and the Version of Record. Please cite this article as Received Date : 11-Dec-2015
Revised Date : 26-Apr-2016 Accepted Date : 27-Apr-2016 Article type : Original Article
Adaptation to climate through flowering phenology: a case study in
Medicago truncatula
Concetta Burgarella (1,2), Nathalie Chantret (2), Laurène Gay (2), Jean-Marie Prosperi (2),
Maxime Bonhomme (3,4), Peter Tiffin (5), Nevin D. Young (5, 6) and Joelle Ronfort (2)
Affiliations (1)
UMR 232 DIADE/DYNADIV, Institut de Recherche pour le Developpement (IRD), Montpellier, France
(2)
UMR AGAP, Equipe Génomique évolutive et gestion des populations, Institut national de Recherche Agronomique (INRA), Montpellier 34060, France
(3)
Université de Toulouse, UPS, Laboratoire de Recherche en Sciences Végétales, BP42617, Auzeville, F-31326, Castanet-Tolosan, France
(4)
CNRS, Laboratoire de Recherche en Sciences Végétales, BP42617, Auzeville, F-31326, Castanet-Tolosan, France
(5)
Department of Plant Biology, University of Minnesota, St. Paul, Minnesota 55108, USA
(6)
Version postprint
Accepted
Article
Corresponding author
Concetta Burgarella
IRD - Institut de Recherche pour le Développement 911 avenue AGROPOLIS
34394 Montpellier cedex 5, France Email: concetta.burgarella@gmail.com
Keywords
Flowering time, climate adaptation, candidate genes, association genetics, mixed model
Running title
Climate adaptation through flowering phenology
Abstract
Local climatic conditions likely constitute an important selective pressure on genes underlying important fitness-related traits such as flowering time and in many species flowering phenology and climatic gradients strongly covary. To test whether climate shapes genetic variation on flowering time genes and to identify candidate flowering genes involved in the adaptation to environmental heterogeneity, we used a large M. truncatula core
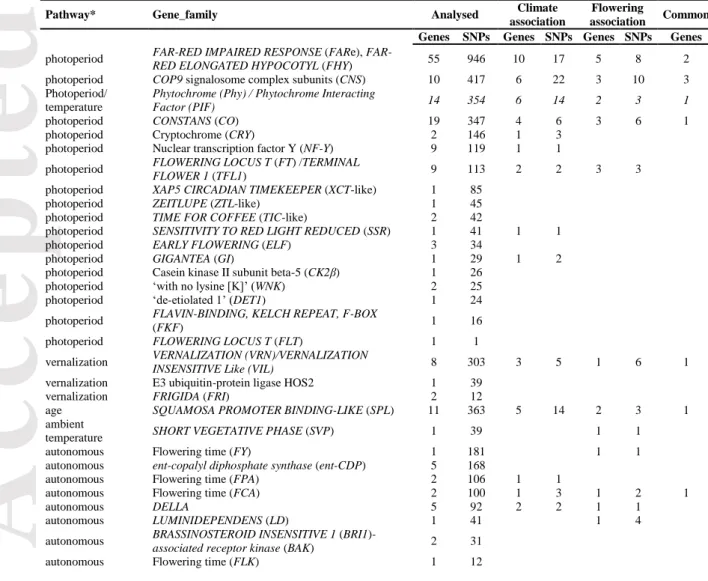
collection to examine the association between nucleotide polymorphisms at 224 candidate genes and both climate variables and flowering phenotypes. Unlike genome-wide studies, candidate gene approaches are expected to enrich for the number of meaningful trait associations because they specifically target genes that are known to affect the trait of interest. We found that flowering time mediates adaptation to climatic conditions mainly by variation at genes located upstream in the flowering pathways, close to the environmental
Version postprint
Accepted
Article
stimuli. Variables related to the annual precipitation regime reflected selective constraints on flowering time genes better than the other variables tested (temperature, altitude, latitude or longitude). By comparing phenotype and climate associations, we identified 12 flowering genes as the most promising candidates responsible for phenological adaptation to climate. Four of these genes were located in the known flowering time QTL region on chromosome 7. However, climate and flowering associations also highlighted largely distinct gene sets, suggesting different genetic architectures for adaptation to climate and flowering onset.
INTRODUCTION
Concerns about the impact of climate change on agriculture and biodiversity are growing, especially in regions such as the Mediterranean Basin where a substantial decrease in precipitation and a pronounced warming are expected in the near future (IPCC 2001; Petit
et al. 2005). Deciphering the genetic architecture of adaptive responses to climate might help
inform the potential for and manner in which species response to climate change. The recent expansion of the genomic toolbox available for both model and non-model species and the access to functional genetic variation have opened new possibilities to tackle this challenge. New sequencing and high-throughput genotyping technologies allow the screening of nucleotide variation at hundreds of loci of many individuals sampled from across wide geographical ranges. Such data enable inferences about population structure, gene flow, and genetic drift and can be used to identify genes responsible for past adaptation.
Several approaches can be used to identify the molecular targets of selection. One avenue is to search for genomic regions exhibiting patterns of diversity, haplotype structures
or population subdivision (assessed by FST) that are inconsistent with what is expected under
neutrality (Siol et al. 2010; De Mita et al. 2013). These approaches are useful to identify genes/alleles that have evolved in response to selection but do not give clear insight into the
Version postprint
Accepted
Article
nature of either the underlying selective pressure or the trait under selection. Based on the idea that the action of environment-specific selection should be reflected in statistical associations between genetic and environmental data (Endler, 1986; Manel et al. 2003; Hancock et al. 2010), other approaches looking for unusually strong correlations between allele frequencies and climatic variables have been proposed (e.g. Joost et al. 2007; Poncet et
al. 2010; Coop et al. 2010). Such approaches were recently applied to several model species
(Hancock et al. 2010; Fumagalli et al. 2011; Hancock et al. 2011; Yoder et al. 2014) and detected large and diverse sets of genes encoding proteins involved in several biological processes and functions (e.g. energy metabolism, development and response to biotic and abiotic stresses). However, the complexity of phenotype-genotype relationships makes identifying the phenotypic traits responsible for adaptation based on a population genetic signature of adaptation extremely difficult (Fumagalli et al. 2011). To relate climate adaptation to both phenotypic changes and allelic variation, the combination of selection scans with complementary analyses establishing links between molecular and phenotypic variation (like association studies or QTL analyses) appears promising (e.g. Stinchcombe & Hoekstra 2008; Mariac et al. 2010).
For sessile organisms like plants, the timing of reproduction is an essential component of fitness (Remington & Purugganan, 2003; Roux et al. 2006; Korves et al. 2007; Rafferty et
al. 2015) and flowering time is under selection in many plant species (Munguía-Rosas et al.
2011). Flowering time has also been repeatedly shown to be affected by a variety of climate-related factors such as day length, average temperature and drought stress (Metcalf & Mitchell-Olds 2009; Méndez-Vigo et al. 2013). Moreover, flowering phenology exhibits clinal variation along latitudinal or altitudinal gradients in several perennial (e.g. Lacey 1988; Olsson & Agren 2002; García-Gil et al. 2003; Hall et al. 2007; Leinonen et al. 2012) and
Version postprint
Accepted
Article
annual (e.g. Julier et al. 2007; Samis et al. 2008, 2012; Montesinos-Navarro et al. 2011; Banta et al. 2012) species, suggesting that the timing of flowering contributes to adaptation to local climatic conditions.
The genetic architecture of flowering time has been extensively studied in model species, especially in Arabidopsis thaliana (reviewed in Amasino 2010; Andrés & Coupland 2012), but also in crop species (Yano et al. 2001; Lifschitz et al. 2006; Buckler et al. 2009). A large number of flowering time candidate genes have been identified and in A. thaliana several genetic pathways involved in the control of flowering time have been characterized. The photoperiod and vernalization pathways regulate the response to seasonal changes in daylength and temperature respectively, the ambient temperature pathway responds to daily temperatures, whereas the age, autonomous and gibberellin pathways respond to endogenous signals and are mostly independent from environmental cues (Fornara et al. 2010). These multiple pathways converge on a small number of genes, referred to as floral integrator genes. Overall, almost 200 genes are involved in this complex network (Fornara et al. 2010), however only a small fraction have been shown to contribute to natural variation in flowering time (Yano et al. 2001; Shalit et al. 2009; Buckler et al. 2009; Brachi et al. 2010; Grillo et al. 2013; Dittmar et al. 2014) or have been screened for their potential contribution to local adaptation (e.g. Balasubramanian et al. 2006; Ikeda et al. 2009; Ma et al. 2010; Ikeda & Setoguchi 2010).
Medicago truncatula, also known as “barrel medic”, is an annual, diploid and highly
self-fertilizing plant species with a natural geographic distribution covering the Mediterranean basin. This species emerged as a model for the analysis of development during plant - Rhizobium symbiosis and other aspects of Fabaceae genetics and genomics (Cook 1999). Large geo-referenced collections (Ronfort et al. 2006), a high-quality reference genome (Young et al. 2011), and a high-density SNP map of more than 250 genotypes
Version postprint
Accepted
Article
(Stanton-Geddes et al. 2013) are all available for this species. M. truncatula is a temperate species with most accessions behaving as winter annuals, i.e. plants germinate in autumn, overwinter as rosettes and flower in spring. Despite its relatively limited geographic range,
M. truncatula harbors considerable genetic variation for flowering date (Julier et al. 2007;
Stanton-Geddes et al. 2013), with most northern accessions flowering later than southern accessions (Julier et al. 2007). The northern accessions come from areas with greater seasonality, day length fluctuations, and higher annual rainfalls than the areas from which the southern accessions were sampled. Like most annual Medicago species, flowering in M.
truncatula is promoted by both exposure to prolonged period of cold (vernalization) and
long-days (Clarkson and Russell, 1975; Moreau et al. 2007; Pierre et al. 2008). Moreover, a signature of adaptive divergence in flowering time has been observed between two M.
truncatula populations from southern France (Bonnin et al. 1996). Unexpectedly however, a
recent genome scan looking for climate associated SNPs in M. truncatula using high-resolution sequence data (www.Medicagohapmap.org, Yoder et al. 2014) did not detect any flowering candidate genes.
Here we use a candidate-gene approach for phenotype-genotype and environment-genotype associations to look further into the implication of flowering time variation in the adaptation of M. truncatula to climate heterogeneity around the Mediterranean Basin. Unlike genome-wide studies, candidate gene approaches target genes of a priori interest and therefore are expected to enrich for the number of meaningful genotype-phenotype associations (e.g. Ehrenreich et al. 2009). We focused on a large set of candidates involved in flowering phenology in A. thaliana and in other species. We examined the association between nucleotide polymorphisms in these candidate genes and both environment and flowering phenotypes in a large M. truncatula core collection using a mixed model approach. We then compared the candidate genes with strong association in each analysis to identify
Version postprint
Accepted
Article
genes putatively underlying variation in both flowering time and climatic conditions; these common genes are likely involved in local adaptation mediated through changes in flowering time.
MATERIAL AND METHODS
Plant material
We studied 174 accessions from the core collection CC192 of Medicago truncatula
maintained at INRA Montpellier (INRA M. truncatula Stock Center:
www1.montpellier.inra.fr/BRC-MTR/). This core-collection was built using microsatellite data as well as geographic information in order to maximize the allelic variation and the represented geographic area. As a result, most sampling sites (local populations) are represented by a single accession and the CC192 is meant to be representative of the whole geographic distribution of the species (Ronfort et al. 2006; Supplementary Table S1).
Environmental data and flowering time measurements
For each accession, the sampling site was geo-referenced for latitude, longitude and altitude. Associated climatic data were extracted from the WorldClim database (www.worldclim.org), which gives a spatial resolution of about 1 square kilometer and is based on records from 1950 – 2000 (Hijmans et al. 2005). The following climatic variables were extracted for each sampling location: monthly minimum and maximum temperatures, monthly mean precipitation, and 19 Bioclimatic summary variables (Supplementary Table S2). To describe the climate conditions of the sampling sites and to explore correlations among environmental variables, we performed a Principal Component Analysis (PCA) on the monthly values of temperature and precipitation for the sampling locations of all 174 accessions using the function dudi.pca of the R-package Ade4 (Dray and Dufour 2007).
Version postprint
Accepted
Article
Flowering time data were collected for each accession during each of 6 years (2001, 2002, 2004, 2008, 2009 and 2011) at the INRA station of Montpellier. Each year, the 174 accessions were sown either in autumn or in spring, and grown in an unheated greenhouse under ambient light and temperature. Flowering time was measured as the number of days from sowing to the emergence of the first flower (here denoted as DF, Days to Flowering). Flowering time was also converted to degree.day (or thermal time, here denoted as ThF, Thermal Flowering time), with thermal time calculated as the sum of the mean daily effective temperatures estimated for each day between sowing and the emergence of the first flower (Bonhomme 2000). The mean daily effective temperature was estimated as the day’s mean
temperature (Tm) minus the base temperature (Tb), using Tb=5°C reported by Moreau et al.
(2006) for the M. truncatula reference line A17. For each accession, we also calculated the mean and among-year standard deviation for DF (Mean_DF, Std_DF) and ThF (Mean_ThF,
Std_ThF). To examine variation in the sensitivity to vernalization, two sowing dates were
used during two consecutive years (2008 and 2009). These dates correspond to different levels of vernalization: sowing in autumn results in a long vernalization period and sowing in spring results in a short vernalization period. The vernalization sensitivity (Vern-Index) of each genotype was estimated as its reaction norm, i.e. as the slope of the regression of the genotype value across environments (spring and autumn sowing) on the environmental value (mean of the entire population for spring and autumn sowing): (DF_s – DF_a)/(mean DF_s − mean DF_a) (Falconer & McKay 1996). In total, we obtained sixteen flowering time related measures for analysis (Supplementary Table S3).
Selection of flowering candidate genes and SNP data
We screened relevant literature on A. thaliana and legume species to build a list of genes expected to be involved in the flowering pathway. We then looked in the M. truncatula annotation Mt3.5 v.4 (www.Medicagohapmap.org) to retrieve all M. truncatula genes
Version postprint
Accepted
Article
annotated as homologs of previously identified flowering time related genes. We identified 289 candidate genes (Supplementary Table S4). Whole genome SNP data were obtained from the M. truncatula HapMap project (Stanton-Geddes et al., 2013; Yoder et al., 2014, www.Medicagohapmap.org) with identified SNP markers by mapping Illumina 90-bp sequence reads from 288 M. truncatula accessions to the M. truncatula A17 reference genome assembly v.3.5. This 288-panel included the 174 samples studied here. Missing SNP data in the 289 flowering time candidate genes were imputed following the procedure described in Bonhomme et al. (2014).
For analyses, we included all polymorphic sites found within annotated coding regions as well as those within 500 bp upstream and downstream or annotated start and stop sites. In total, we identified 36784 polymorphic sites. We then applied two filters to keep only sites i) with data missing from fewer than 15% of the accessions and ii) with a minor allele frequency (MAF) ≥ 0.05. The final data set contained 5206 SNPs in 224 genes (average of 23 SNPs per gene, SD ± 22) (Supplementary Table S4). The distribution of SNPs among functional categories (intergenic, coding, intron, 3’UTR and 5’UTR) is reported in Supplementary Table S7. The mean linkage disequilibrium between two SNPs within a gene was r²=0.21 (SD ± 0.14), with more than 98% of pairwise r² values < 0.8 (Supplementary Figure S1). This value is consistent with the genome wide estimate of r² = 0.24 (± SEM 0.22-0.27) for 2kb lengths found by Bonhomme et al. (2015).
Population genetic structure and relatedness
Accounting for population structure and for the degree of relatedness among individuals can reduce type I error in association studies (Yu et al. 2006, Zhao et al. 2007). The degree of confounding is expected to be greater if phenotype and structure are correlated (Larsson et al. 2013) or covary with geography (e.g. Atwell et al. 2010). However, a loss of
Version postprint
Accepted
Article
power is expected if the same genotypic information is used both to test marker effect and to estimate relatedness (Listgarten et al. 2012; Rincent et al. 2014). Thus, we used an independent set of intergenic SNPs to estimate the structure (Q) and the kinship (K) matrices. The spatial structure of M. truncatula has been described previously (Ronfort et al. 2006; De Mita et al. 2011). To confirm previous results on the genetic stratification of the CC192, the assignment probability of each individual to a genetic group (i.e. the Q matrix) was assessed using two methods: the Bayesian clustering algorithm implemented in the software Structure v.2.3.3. (Pritchard et al. 2000) and the discriminant analysis of principal components, DaPC (Jombart et al. 2010) implemented in the R-package adegenet (Jombart and Ahmed 2011). Structure analysis was performed using 968 unlinked SNPs, as described in Bonhomme et al. (2014). To perform DaPC, we extracted from the imputed data a set of 20382 intergenic SNPs covering the entire genome and with a missing rate < 2%. As no a priori information about genetic groups was used, we followed authors’ guidelines to assign accessions to genetic clusters (algorithm k-means) and to determine the most likely number of groups using the Bayesian Information Criterion. The BIC value was minimized for K=2 and K=3, but no evident elbow differentiated these two values, suggesting that the configuration K=3 does not substantially improve the model. Thus, we set K=2 to be in agreement with previous results (De Mita et al. 2011; Bonhomme et al. 2014). To build the Q-matrix, the results of DaPC and Structure for K=2 were merged and compared. The genetic differentiation between the
inferred groups was further explored with a pairwise FST analysis on the full set of intergenic
SNPs (20382) using the R-package hierfstat (de Meeûs and Goudet 2007). The set of 20382 intergenic SNPs was also used to estimate the K matrix with the software Tassel v. 3.0 (Bradbury et al. 2007).
Version postprint
Accepted
Article
SNP association with climate and phenotype
To identify polymorphisms underlying the response to climate-mediated selection, we used a mixed linear model (MLM) to explain variation in each of the environmental variables (i.e. the dependent variable) with individual SNPs. Of course, SNPs are not themselves responsible for environmental variation but can be associated with environmental variation through one or more unmeasured phenotypic trait(s) (see Eckert et al. 2010, Méndez-Vigo et
al. 2011 for similar approaches). We used the MLM method of Yu et al. (2006) as
implemented in Tassel v. 3.0 (Bradbury et al. 2007). To account for the confounding effect of multiple levels of population structure, the matrix of relative assignment to a genetic group (the Q matrix) and the kinship matrix (K) were included in the model as fixed and random effects respectively:
y = µ + Xα + Qβ + u + e
where y is the vector of an environmental variable characterizing the accession’s provenance, X is a matrix of genotypes for the studied SNP, α is the vector of fixed allelic effects to be estimated, Q is the structure matrix, β is a vector of subpopulation effects, u is a matrix of
random effects meant to capture the variance due to background genetic kinships (u ~ Nn(0,
σg² K) with σg² the genetic variance), and e is the matrix of residual random effects (e ~ Nn(0,
σe² I) with σe² the residual variance). The significance of the genotype effects was obtained
using an F-test. We used the same mixed model and the same set of candidate SNPs to identify polymorphisms significantly associated with each of the 16 phenotypic measures of flowering time variation. The use of the same model makes the results of analyses of SNP-climate and SNP-flowering time directly comparable.
To correct for multiple testing we applied the False Discovery Rate approach (FDR, Storey & Tibshirani 2003), which provides a measure of the rate of false positives among results declared significant. Very stringent significance thresholds result in a situation where
Version postprint
Accepted
Article
the false-negatives far outnumber the false-positives (Panagiotou et al. 2012). For work focused on gene discovery, minimizing the false positive rate is a more important consideration than controlling the false negative rate (Barsh et al. 2012). Here, however, we are more interested in identifying putative associations with genes already known to act on flowering time variation and drawing a general picture of the genetic architecture of climate adaptation. In addition, correlations among trait measurements and among environmental variables can reduce the number of independent tests for each analysis, likely making multiple test corrections more conservative. For these reasons, we retained all tests with a q-value ≤ 10% (i.e. we expect 10% false positives among the significant results).
To quantify the proportion of the phenotypic variance in flowering time explained by climate-associated SNPs versus flowering time-associated SNPs and the degree of
confounding between them, we used variance partitioning (VP) methods. VP methods were introduced by Borcard et al. (1992) to partial out spatial components of ecological variation in species abundance data. The approach is based on constrained and partial canonical
ordination techniques and attempts to partition the explanatory power of different explanatory matrices in relation to the same response matrix. The variation explained by each set of variables or matrix is partitioned into fractions of “variation attributable purely” to each set of variables and fractions of “shared variation” attributable to two or more sets of variables. For our analysis, we used the three flowering time variables showing the largest number of significant associations (i.e. Mean_ThF, DF_a and DF01_s) as response variables and the two sets of identified SNPs (climate-SNPs and flowering time-SNPs) as explanatory matrices. We performed VP analyses using the function varpart as implemented in the R-package vegan (Oksanen et al. 2016). This function is based on redundancy analysis (rda)
and uses adjusted R2 to express explained variation. The significance of the inferred partitions
Version postprint
Accepted
Article
To get a general picture of the involvement of flowering genes in climate adaptation we performed an enrichment analysis at different significance thresholds. We considered SNPs associated with the climate as candidate SNPs and looked at the enrichment of these candidates in SNPs associated with flowering time with increasing p-value thresholds
(ranging from 10-1 to 10-5). The enrichment ratio (x/y) was defined as the proportion of
polymorphisms associated with at least one flowering measure among those associated with at least one environmental variable (x) and among the whole set of 5206 SNPs (y). The climate association was performed on a larger number of variables (58) than the flowering association (16). We therefore adjusted the threshold p-values for association with flowering time by multiplying it by 3.625 (the ratio between the number of variables in the climate versus flowering association analyses, 58/16). Following Brachi et al. (2010), the significance of the enrichment ratio was assessed by randomizations that preserves the linkage disequilibrium structure of the data, to avoid inflate significance values due to autocorrelations along the chromosomes. Briefly, for each p-value, a null distribution of enrichment was generated by randomizing SNP positions in climate association results relative to flowering association results, without disrupting the chromosomal order of either SNP set.
RESULTS
Population structure of the studied panel
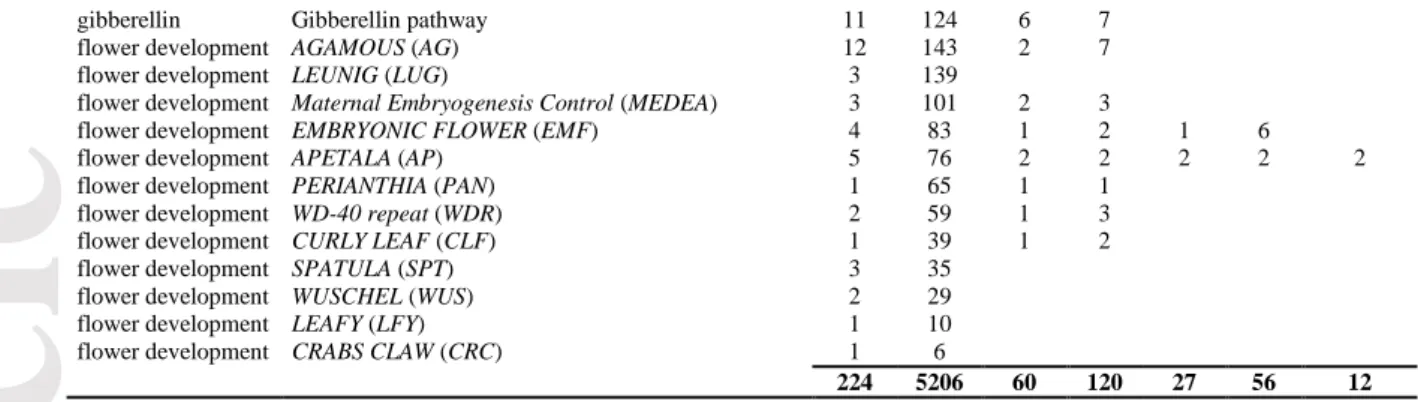
Both the Bayesian clustering method STRUCTURE and the multivariate analysis DaPC confirmed the well-known split of Medicago truncatula into two major genetic groups (Figure 1a): a western group comprising accessions from the extreme west of the Mediterranean basin (the Iberian Peninsula, Morocco and the west of Algeria) and a central-eastern group comprising accessions from France and the east of Algeria to the central-easternmost
Version postprint
Accepted
Article
sites (De Mita et al. 2011). The FST analysis revealed significant differentiation between the
two groups (p < 0.001) accounting for 18% of the total molecular variation (95% confidence interval = 0.175 – 0.193). STRUCTURE and DaPC assignments disagreed for only four accessions from Algeria, which appears to be a contact zone between the two genetic groups. For subsequent analyses these individuals were attributed to each group with a 50% probability (Supplementary Table S1).
Geographic, climatic and flowering time variation of the 174 accessions panel
To characterize the range of environments occupied by M. truncatula, we performed a principal components analysis (PCA) on the 36 monthly climatic variables obtained for all sample locations (mean precipitation, minimum and maximum temperatures, Table S2). The first two axes (PC1 and PC2) explained 70% of the total variation (49.5% and 20.5%, respectively, Figure 1b). Consistent with results from Yoder et al. (2014) based on a larger sample, summer precipitation and winter maximum temperature contributed most to PC1 while PC2 captured variation in mean winter temperature and winter precipitation (Figure 1b and Supplementary Figure S2). PC1 therefore highlights the important differences occurring between sites from Southern France (colder and moister during the warmest months) and sites from the Middle-East (warmer and drier during the coldest months). As illustrated on Figure 1b, the two genetic groups share similar climatic ranges, although the eastern group exhibits more extreme environments on PC1. Although most variables were highly correlated and well-represented on the main axes (Supplementary Figure S2), some variables contributed little to the first two PCs; we thus decided to use the whole set of geographic and climatic variables to look for climate associated SNPs.
Version postprint
Accepted
Article
As previously observed (Pierre et al. 2008), M. truncatula exhibits large variation in flowering time despite its relatively small geographic range: for most measures, the difference in flowering start date between the earliest and the latest flowering accessions exceeded 45 days (~500 degree.day, Supplementary Figure S3). As expected given the high heritability of flowering time in M. truncatula (> 0.75, Pierre et al. 2008), measurements of flowering dates per accession were highly correlated between years (all r > 0.4). Similar to the range of climatic conditions, the two genetic groups identified by STRUCTURE and DaPC exhibited similar patterns of flowering time variation, although the range of flowering time was slightly greater for the eastern than western group (Figure 1c). All measures of the onset of flowering showed clear spatial clines and were positively correlated with latitude (i.e. flowering starting date is delayed in northern latitudes) and negatively correlated with longitude (i.e. west to east decay of flowering starting date). These clines are related to the combined effects of daylength and climatic conditions experienced by local populations. Flowering occurs earlier in warm and dry sites and later in cold and moist sites. In fact, flowering times were strongly positively correlated to both spring and summer precipitation (e.g. for MeanThF and precipitation of driest quarter, BIO17, r = 0.69 and precipitation of the warmest quarter, BIO18, r = 0.70) and strongly negatively correlated with annual mean temperature (BIO1, r = -0.59) and precipitation seasonality (BIO15, r = -0.67). In contrast, no significant relationship was found between flowering time and altitude (Supplementary Figure S4).
Climate and flowering time association analyses
To identify polymorphism in flowering time candidate genes involved in adaptation to climate, we fitted linear mixed models to predict the 58 environmental variables using 5206 SNPs identified in 224 potential flowering genes (301,948 tests), while controlling for
Version postprint
Accepted
Article
possible confounding effects of population stratification (Q+K model, Yu et al. 2006). The
parallel flowering time association analyses resulted in 83,296 tests (5206 x 16 flowering measures).
Two hundred and eighteen climate x SNP association tests exhibited a FDR q-value ≤
10% with associated p-values ranging from 3.31x10⁻⁸ to 1.46x10⁻³ (Supplementary Table S5).
These tests identified 120 SNPs tagging 60 genes (Table 1). The two climate variables with the greatest number of associations were precipitation seasonality (Bio15, 77 SNPs) and July precipitation (34 SNPs, Supplementary Figure S6). These two variables, which contributed strongly to the climate PCA axis, were strongly negatively correlated (r = -0.74, p < 0.01): sites with low precipitation in July had the largest coefficients of variation in seasonal precipitation. Identified SNPs were distributed over the M. truncatula genome (Figure 2), were not in strong linkage disequilibrium (LD, only 1.4 % had pairwise r² ≥ 0.5, Supplementary Figure S1), and the number per chromosome was not significantly different than expected by chance (χ² test p = 0.08). Most of the identified SNPs were located in genes putatively involved in plant response to external stimulus, especially in the light dependent pathway, e.g. PHYTOCHROME INTERACTING FACTOR-like (PIF-like), CONSTANS-like (CO-like) whereas relatively few SNPs tagged genes involved in later stages of the flowering pathways (i.e. integration of signals from multiple pathways or flower organ development, Table 1). This distribution of gene functions was however not significantly different from the one observed in the whole dataset (p > 0.1), i.e. there was no significant enrichment in a specific pathway. The MAF distribution was significantly different from the one observed in the 5206 candidate SNPs (Figure 3), with more low frequency (< 0.10; χ² test, p < 0.05) and intermediate frequency (> 0.40; χ² test, p < 0.005) variants associated to climate variables than expected by chance. Since statistical power is higher for intermediate frequency variants,
Version postprint
Accepted
Article
however, we could expect that they are more likely to be identified and thus represented among the significant associations.
Using the same q-value threshold, association analyses performed with the 16 flowering related measures as response variables resulted in 86 significant tests, tagging 56 SNPs located in 27 candidate genes (Table 1) with associated p-values ranging between
1.93x10⁻⁶ and 8.89x10⁻⁴ (Supplementary Table S6). LD for significant SNPs was slightly
higher than for climate-associated SNPs, with 3.6 % of pairwise r² ≥ 0.5 (Supplementary Figure S1). Three flowering time variables were responsible for most of the significant associations: Mean_ThF, DF_a and DF01_s (Supplementary Figure S5). Similar to climate-associated SNPs, most of the flowering time-climate-associated genes were involved in the light dependent pathway, e.g. FAR-RED IMPAIRED RESPONSE-like (FAR-like), FAR-RED
ELONGATED HYPOCOTYL-like (FHY-like), CO-like. Some genes involved in the
autonomous pathway and in flower development were also identified (Table 1). Flowering-associated SNPs were detected on 6 chromosomes (no SNPs on chromosomes 3 and 6), but nearly half of the candidates (48%) were located in a 10 Mb window on chromosome 7 (Figure 4), that has been previously identified as being responsible for variation in flowering time (Pierre et al. 2008; Stanton-Geddes et al. 2013). In this region, the number of significant
SNPs was higher than expected by chance (26/56 SNPs, χ² test p = 5.2x10⁻⁷), tagging 10 of
the 22 candidate genes. As for climate associations, the MAF distribution of flowering-associated SNPs was significantly different from the whole candidate SNP set, with more SNPs exhibiting intermediate frequencies (0.30-0.40) than expected by chance (χ² test, p < 0.001; Figure 3).
Version postprint
Accepted
Article
Relationship between climate adaptation and flowering time
To examine the genetic ties between climate adaptation and flowering time, we looked at the enrichment ratios of flowering associations in climate-associated SNPs. This showed that, for p-values ≤ 0.1, associations with flowering traits are significantly over-represented among associations with climate (Figure 5 and Supplementary Figure S7). For
instance, for p-values ≤ 10-3, SNPs associated with climate were about 2.6 times more likely
to be also associated with flowering time than other SNPs (Figure 5) and this ratio increases
to 4.7 for p-values ≤ 10-4 (Supplementary Figure S7).
Variance partitioning analyses were performed on the three flowering time traits that showed the largest number of significant associations (i.e. Mean_ThF, DF_a and DF01_s) using the two sets of significant climate-SNPs and flowering time-SNPs as explanatory matrices. As expected, since flowering phenotype data were used in the flowering time association analyses, the climate-associated SNPs always explained a lower fraction of flowering time variability (adjusted-r² values < 52%) than flowering-associated SNPs (adjusted-r² values < 67%; Table 2). However, both sets of SNPs explained a significant fraction of flowering time variation (Table 2). Interestingly, the confounding effects of the two SNP sets, i.e. the fraction of variation explained by both sets of SNPs, were large for all three flowering time traits (37-50%). This redundancy can be attributed to shared SNPs between the two association analyses (see below), but probably also to linkage disequilibrium between the two sets of SNPs (1.2% of pairwise r² ≥ 0.5). Taken together, these results provide additional support to the hypothesis that climate-association analyses identified genes or genomic regions involved in the determination of flowering time.
Finally, we compared the individual effect sizes of the two sets of SNPs. For example, for Mean_ThT, average absolute effect sizes were significantly lower for climate-associated SNPs (10.96 degree.day) compared to flowering time-associated SNPs (48.95 degree.day,
Version postprint
Accepted
Article
Wilcoxon rank sum test p = 1.37x10⁻¹⁰, Figure 3). Similar results were obtained for DF01_s
(mean effects of climate- versus flowering-associated SNPs = 2.5 days versus 8.1 days, p =
6.02x10⁻⁹) and DF_a (1.46 versus 3.18, p = 1.17x10⁻⁵).
Genes associated to both climate and flowering time
Combining results from the two analyses should highlight genes and polymorphisms most involved in adaptive phenological responses to climate heterogeneity. Nine SNPs tagging 5 genes were associated to both climate and flowering time (Table 3). The five genes included one gene related to the vernalization pathway (VERNALIZATION INSENSITIVE-like, VIL, Medtr4g127880) significantly associated to March precipitation and to several flowering time variables, and 4 genes involved in the light dependent pathway all strongly associated to precipitation seasonality (BIO15): 2 homologs to COP9 signalosome complex subunits (CNS-like, Medtr5g079750, Medtr7g087530), a CO-like (Medtr7g083540) and a gene coding for a FAR-1 related protein (FAR-RED IMPAIRED RESPONSE1-like gene, Medtr7g083480). Interestingly, the latter three genes are located in the same small genomic region on chromosome 7 (Figure 4). Variance partitioning analyses showed that this set of 9 SNPs explained up to 27% (for Mean_ThT, p = 0.001) of the flowering time variation and SNP individual effect size ranged from 30 to 102 degree.day. Three low-frequency SNPs (i.e. MAF ≤ 0.1), located in VIL, FAR1-like, and one of two CNS-like genes, each had a strong effect on flowering time (> 82 degree.day, Supplementary Figure S8). This contrasts with three common SNPs (MAF ≥ 0.34) of relatively weak effect on flowering time (< 45 degree.day) in the two CNS-like genes (Supplementary Figure S8 for an example). The remnant 3 SNPs exhibited intermediate frequencies and effects.
Version postprint
Accepted
Article
Seven other genes were associated to both climate and flowering time, but different polymorphisms were involved within each gene (no common SNP, Table 3). Among them, two genes are involved in the light dependent pathway (CNS-like, FAR1-like), one in the temperature dependent pathway (PIF-like), two in the autonomous or age dependent pathway (SQUAMOSA PROMOTER BINDING-like (SPL-like), and FLOWERING CONTROL
LOCUS A-like (FCA-like)) and two in later stages of flower development (2 APETALA2-like
genes (AP2-like)). Interestingly, three of these genes (the CNS-like Medtr2g034320 and the
AP2-like Medtr2g093060 and Medtr5g016810) were among those exhibiting the largest
effects on flowering time, > 124 degree.day as measured by Mean_ThF.
DISCUSSION
Climate is expected to be a major selective pressure driving the evolution of genes underpinning variation in important phenological traits such as flowering time. Here, we tested this prediction by examining climate associations in flowering-time candidate genes in the model legume Medicago truncatula, using a set of accessions covering the whole species distribution. Our analysis showed that flowering time mediates adaptation to climate heterogeneity in M. truncatula and identified at least 12 genes that potentially contribute to adaptation via flowering time.
Flowering time mediates adaptation to climate heterogeneity
Combining climate and phenological data, we found several pieces of evidence showing that flowering time genes in M. truncatula are involved in climatic adaptation. First, we found that polymorphisms with flowering associations are over-represented among those with climate associations (enrichment analysis) and, at 10% FDR, almost half of the flowering-associated genes (12/27 genes) also exhibited an association with at least one
Version postprint
Accepted
Article
climatic variable. Second, climate-associated polymorphisms cumulatively explain a large portion (up to 50 %) of the variation in flowering time observed in our sample. Moreover, among the 12 genes associated with both flowering traits and climatic variables, three were among those exhibiting the largest effects on flowering time. Finally, several SNPs associated with both flowering time and climate were located in an approximately 10 Mbp length region of chromosome 7. This region has been repeatedly shown to be an important contributor to flowering time variation in M. truncatula. It contains a QTL explaining between 20 and 60% of the variation observed in three RIL populations (Julier et al. 2007; Pierre et al. 2008) and includes more than 75% of the 200 top flowering-associated SNPs reported by Stanton-Geddes et al. (2013) in a genome-wide association analysis. Altogether, these results give strong support to the reliability of our analyses and reinforce the notion that climate-association studies are able to detect genomic regions directly involved in the determination of flowering time in M. truncatula. They also indicate that flowering time mediates adaptation to climate at the species range level.
In this study, we used a priori knowledge on A. thaliana flowering time gene network to extract candidate genes from the M. truncatula genome and used polymorphisms in these candidate genes to perform an association study. While genome-wide association studies are helpful to explore trait architecture or search for new potential candidates, the associations not corresponding to obvious candidates need functional validation (Bergelson & Roux 2010). We did not choose a genome-wide approach in order to avoid dilution of the signal we are looking for due to spurious/indirect associations (e.g. Platt et al. 2010). The “candidate genes” approach is common in human epidemiology (Pasche et al. 2010; Patnala et al. 2013) and it has been used extensively in plants, with some studies jointly targeting flowering genes and climate associations (e.g. Ingvarsson et al. 2006 on Populus tremula; Samis et al. 2008, Méndez-Vigo et al. 2011 on A. thaliana; Keller et al. 2012 on P. balsamifera). Most recent
Version postprint
Accepted
Article
studies have examined climate x genotype correlations at the genome-wide scale without any focus on an adaptive trait (e.g. Eckert et al. 2010; Hancock et al. 2011; Yoder et al. 2014).
Perhaps surprisingly, the genome-wide screening of climate associated nucleotide variants performed on M. truncatula by Yoder et al. (2014) did not identify any commonly known flowering genes. This lack of overlap may be due to several methodological differences between the two studies. Yoder et al. focussed on the 100 most significant climate-associated SNPs among a genome-wide set of nearly 2 million SNPs whereas we examined SNPs only in candidate genes and considered as “associated” the SNPs with q-values that exceeded a critical threshold. Yoder et al. (2014) used only the kinship (K-matrix) to account for relatedness while we used both kinship and population structure (K-matrix +
Q-matrix). In addition, we imputed genetic data (Bonhomme et al. 2014), and the two studies
examined a slightly different set of individuals. Another important difference between the two studies is that we considered a large set of climatic variables (n=58), while Yoder et al. (2014) used only three climatic variables that represented the major axes of climate variation across the species’ range, i.e. annual mean temperature (BIO1), precipitation in the wettest month (BIO13) and isothermality (BIO3). Interestingly, our results show that these three climatic variables are only weakly associated with flowering candidate genes (Supplementary Figure S6), suggesting that genotype-environment association studies may miss important genes if they focus on only the major axis of climate variation across a species range. It remains that the associations identified by Yoder et al. and our study have not been empirically validated and some of these are likely to be false positives (Bergelson & Roux 2010).
Version postprint
Accepted
Article
Flowering time associated genes
Combining flowering time measurements obtained on the M. truncatula CC192 under various greenhouse conditions (6 years measurements, fall or spring sowing), our analysis highlighted 27 candidate genes. Little is known concerning the genetic control of flowering time in M. truncatula (Putterill et al. 2013) but our results were mostly consistent with previous genetic (Julier et al. 2007; Pierre et al. 2008, Stanton-Geddes et al. 2013) and functional (Laurie et al. 2011; Yeoh et al. 2013) analyses. First, 10 of the flowering time-associated genes were located in the known flowering time QTL interval on chromosome 7. Among those genes, two were previously reported as involved in flowering time variation in
M. truncatula: a FAR1 homolog (Medtr7g087480), detected by Stanton-Geddes et al. (2013),
and a CO-like gene (Medtr7g083540), that expression data shows to be the most promising candidate gene responsible for the flowering time QTL (Pierre et al. 2011). This region also contains three FT-like genes (FTa1, FTa2 and FTc), located next to each other within a ~30 kb window. Laurie et al. (2011) and Yeoh et al. (2013) have shown that FTa1 is regulated by both vernalization and Long Day (LD) photoperiod in M. truncatula. Patterns of expression and responses to environmental cues also suggested possible roles in flowering time determination for FTa2 and FTc although the clear function of these two genes remains unknown (Putterill et al. 2013). Interestingly, we detected significant associations between flowering time and FTa2 and FTc, but none involving FTa1. However, a SNP in the 3’UTR of FTa1 was significantly associated with latitudinal variation (Supplementary Table S5), which is also expected to reflect variation in photoperiod and temperature in the Mediterranean area. Notably, in A. thaliana the promoter region of FT appears to be a target of selection for early flowering (Roux et al. 2006), which allows speculating the role of selection in M. truncatula. Moreover, in A. thaliana the activation of the FT promoter is assured by PIF genes (Kumar et al. 2012), which were associated with both flowering time
Version postprint
Accepted
Article
and temperature in M. truncatula (Supplementary Table S5 and S6), suggesting a similar mechanism in the PIF-mediated temperature regulation of flowering time between the two species.
The individual allelic effects of most of the flowering time-associated SNPs were low to intermediate, but we also detected a small set of large-effect SNPs. This genetic architecture of flowering time in M. truncatula appears as intermediate between the one observed so far in rice and A. thaliana (where flowering time variation is mostly controlled by a few genes of large effect) and the one observed in maize (with numerous QTLs of small effect sizes, reviewed in Savolainen et al. 2013). This pattern, as well as the fact that several of the detected SNPs were concentrated in a relatively small genomic region on chromosome 7, fit with the expected genetic architecture of an adaptive trait under stabilizing selection, migration and drift, assuming that the optimum value of the trait varies between populations (Barton and Turelli, 1989; Yeaman and Whitlock, 2011; Savolainen et al. 2013).
Twelve of the 27 flowering time associated genes were significantly associated with climatic variables (Table 3), especially with summer precipitation, making these 12 genes major ecologically relevant flowering time candidate genes. Interestingly, 10 of these 12 genes are involved in flowering time signalling pathways, and seven of them are involved in the light dependent signalling pathway in A. thaliana. Assuming that these genes have similar functions in M. truncatula (e.g. transcript levels of the CO-like gene Medtr7g083540 have been shown to weakly cycle under long days conditions; Pierre et al. 2008, 2011), these data suggest that most signalling pathway genes are particularly important contributors of flowering time variation. This result conforms well with theoretical predictions about the roles of genes in adaptive evolution depending on their position in regulatory networks (reviewed in Olson-Manning et al. 2012): adaptation to environmental heterogeneity is expected to proceed mostly through variation in genes located at the network edges (like
Version postprint
Accepted
Article
genes that directly interact with environmental stimuli), while genes located at the core of the network are expected to be more constrained. Nevertheless, the role of most of these genes in
M. truncatula remains unknown and preliminary functional analyses have suggested that
flowering time regulation in M. truncatula differs from that in A. thaliana (Putterill et al. 2013). Indeed, although M. truncatula is a vernalisation-responsive plant like A. thaliana, it lacks both FLC and VRN2, the repressors that inhibit flowering before spring in A. thaliana and cereals respectively (Hecht et al. 2005; Putterill et al. 2013). Also, the role of CO-like genes in the flowering control in M. truncatula seems to differ from the role of CONSTANS in A. thaliana (Putterill et al. 2013). If the control of flowering time has different genetic bases in the two species, then our selection of candidate genes based on the knowledge available on A. thaliana could have missed some M. truncatula specific flowering gene. Further investigations are thus needed to better understand the function of these genes in the flowering time network of M. truncatula as well as their potential role in adaptation to climate heterogeneity.
Different outcomes from climate and flowering analyses
Although our analysis highlighted a relatively large set of SNPs associated to either climatic variables (n=120) or flowering time (n=56), few polymorphisms were common (n=9). This result first suggests that few flowering genes are involved in the adaptation to climate conditions, as proposed by Yoder et al. (2014). Since our analysis specifically targeted flowering candidate genes, this would also mean that some of these a priori flowering time genes are involved in climate-adapted phenotypic traits other than flowering time. Several instances of flowering time genes having pleiotropic effects on a range of physiological (e.g. Loudet et al. 2003; Masle et al. 2005; Lovell et al. 2013) and morphological traits (e.g. Brock et al. 2009, 2012) have been reported in A. thaliana and
Version postprint
Accepted
Article
other species (e.g. Nakamura et al. 2011). This could explain, at least partly, the limited overlap we observed between our two association analyses. Nevertheless, climate-associated SNPs were able to explain up to 50% of the flowering time variation in our sample, suggesting that the two association analyses identified partially different sets of genes but that both sets of genes were involved in flowering time variation. In support of this, climate-associated SNPs also exhibited on average lower individual allelic effect on flowering time compared to flowering time associated SNPs. Such small effects loci could be difficult to detect through flowering time association analyses (Korte & Farlow 2013; Rincent et al. 2014). Our climate association analysis also highlighted two genes (GIGANTEA and FTa1) with known functions in the genetic control of flowering time in other legumes like pea (in pea, GIGANTEA and FTa1 are homologs of LATE1 and GIGAS respectively) and soybean (Watanabe et al. 2011; Weller & Ortega, 2015), as well as in phenological variation along climatic gradients in forest trees like poplar and spruce (Chen et al. 2014; Keller et al. 2012). This suggests that despite the low overlap between the two sets of SNPs identified, the climate association analysis succeeded in the discovery of genes that contributes to climate adaptation though flowering phenology changes.
Finally, complex dynamics of local adaptation might also explain the lack of correspondence between environment and flowering association analyses. For instance, selection on flowering time might differ among environments if the genetic basis of variation differs among habitats. Such patterns of selection might result in alleles being conditionally neutral (e.g. Verhoeven et al. 2008), under which case we would not expect a one-to-one correspondence between flowering-time and climate associations.
Besides biological explanations, the limited overlap between the two sets of detected SNPs could also be an outcome of our analyses. It is indeed well acknowledged that the power of association studies to detect rare SNP variants as well as SNPs with small effect
Version postprint
Accepted
Article
sizes is limited (Korte & Farlow 2013; Rincent et al. 2014). Controlling for population structure (as we did) when studying traits partially covarying with it, such as flowering time, reduces false-positive rate but also strongly reduces the power of the analysis (see Brachi et
al. 2010, 2011). Our flowering time association analysis could thus have succeeded in the
identification of genomic regions with large effect sizes on flowering time but failed in the identification of those responsible for small phenotypic variation, which would be more often involved in the response to climate variation. We also observed that among the 12 variables measuring the onset of flowering, few were involved in the flowering time associations (Supplementary Figure S5). That these variables represent repeated measures of the same trait expressed under varying environmental conditions (several years, different vernalization treatments) suggests the occurrence of QTL x environment interactions for flowering time (as reported in e.g. Weinig et al. 2002 and Brachi et al. 2010), but also underscores that the genetic architecture of a trait revealed through association analyses may largely depend on the environment in which plants are grown and the measure used.
Summary
Our analyses confirmed that flowering time mediates adaptation to climate heterogeneity in M. truncatula at the species level and suggested that adaptation mainly proceeds through variation in genes acting in the signalling pathways, which are directly influenced by the environmental stimuli. Twelve genes associated to both flowering time and climate variation were identified, and thus represent good candidates for further analyses. Significant polymorphisms in these genes were either common or rare and the effect sizes of the highlighted SNPs were also variable (weak or strong effects), as expected for a quantitative trait such as flowering time. In most cases, climate associations involved two variables that explained most of the species-wide climatic variation (i.e. precipitation
Version postprint
Accepted
Article
seasonality and summer precipitation), suggesting that selection on flowering time is more closely related to patterns of precipitation than to the other climatic variables tested.
ACKNOWLEDGMENTS
This research was supported by the INRA (French National Institute of Agronomical Research) Department of Genetics and Plant Breeding, and by ARCAD, a flagship project of the Agropolis Foundation. The authors thank Magali Delalande and Denis Tauzin for their involvement in the production of the phenotypic dataset, Miguel Navascués and Yves Vigouroux for fruitfull discussions and four anonymous reviewers for helpful comments. N. Young and P. Tiffin received support from NSF grant 1237993 and M. Bonhomme by the French laboratory of excellence project (LABEX) "TULIP" (ANR-10-LABX-41).
REFERENCES
Amasino R (2010) Seasonal and developmental timing of flowering. The Plant Journal, 61, 1001–1013.
Andrés F, Coupland G (2012) The genetic basis of flowering responses to seasonal cues.
Nature Reviews Genetics, 13, 627–639.
Atwell S, Huang YS, Vilhjalmsson BJ et al. (2010) Genome-wide association study of 107 phenotypes in Arabidopsis thaliana inbred lines. Nature, 465, 627–631.
Balasubramanian S, Sureshkumar S, Agrawal M et al. (2006) The PHYTOCHROME C photoreceptor gene mediates natural variation in flowering and growth responses of
Arabidopsis thaliana. Nature Genetics, 38, 711–715.
Banta JA, Ehrenreich IM, Gerard S et al. (2012) Climate envelope modelling reveals
intraspecific relationships among flowering phenology, niche breadth and potential range size in Arabidopsis thaliana. Ecology Letters, 15, 769–777.
Barsh GS, Copenhaver GP, Gibson G, Williams SM (2012) Guidelines for genome-wde association studies. PLoS Genet, 8, e1002812.
Barton NH, Turelli M (1989) Evolutionary quantitative genetics: how little do we know?
Annual review of genetics, 23, 337–370.
Bergelson J, Roux F (2010) Towards identifying genes underlying ecologically relevant traits in Arabidopsis thaliana. Nat Rev Genet, 11, 867–879.
Bonhomme M, André O, Badis Y et al. (2014) High-density genome-wide association mapping implicates an F-box encoding gene in Medicago truncatula resistance to Aphanomyces euteiches. The New Phytologist, 201, 1328–1342.
Bonhomme M, Boitard S, Clemente HS et al. (2015) Genomic signature of selective sweeps illuminates adaptation of Medicago truncatula to root-associated microorganisms.
Version postprint
Accepted
Article
Bonhomme R (2000) Bases and limits to using “degree.day” units. European Journal of
Agronomy, 13, 1–10.
Bonnin I, Prosperi J-M, Olivieri I (1996) Genetic markers and quantitative genetic variation in Medicago truncatula (Leguminosae): a comparative analysis of population structure.
Genetics, 143, 1795–1805.
Borcard D, Legendre P, Drapeau P (1992) Partialling out the spatial component of ecological variation. Ecology, 73, 1045–1055.
Brachi B, Faure N, Horton M et al. (2010) Linkage and association mapping of Arabidopsis
thaliana flowering time in nature. PLoS Genet, 6, e1000940.
Brachi B, Morris GP, Borevitz HO (2011) Genome-wide association studies in plants: the missing heritability is in the field. Genome Biology, 12, 232
Bradbury PJ, Zhang Z, Kroon DE et al. (2007) TASSEL: software for association mapping of complex traits in diverse samples. Bioinformatics, 23, 2633–2635.
Brock MT, Kover PX, Weinig C (2012) Natural variation in GA1 associates with floral morphology in Arabidopsis thaliana. New Phytologist, 195, 58–70.
Brock MT, Stinchcombe JR, Weinig C (2009) Indirect effects of FRIGIDA: floral trait (co)variances are altered by seasonally variable abiotic factors associated with flowering time. Journal of Evolutionary Biology, 22, 1826–1838.
Buckler ES, Holland JB, Bradbury PJ et al. (2009) The genetic architecture of maize flowering time. Science, 325, 714–718.
Chen A, Li C, Hu W et al. (2014) PHYTOCHROME C plays a major role in the acceleration of wheat flowering under long-day photoperiod. Proceedings of the National Academy of
Sciences, 111, 10037–10044.
Clarkson N, Russell J (1975) Flowering responses to vernalization and photoperiod in annual medics (Medicago spp.). Australian Journal of Agricultural Research, 26, 831–838. Cook DR (1999) Medicago truncatula — a model in the making!: Commentary. Current
Opinion in Plant Biology, 2, 301–304.
Coop G, Witonsky D, Di Rienzo A, Pritchard JK. 2010. Using environmental correlations to identify loci underlying local adaptation. Genetics 185, 1411–1423.
de Meeûs T, Goudet J (2007) A step-by-step tutorial to use HierFstat to analyse populations hierarchically structured at multiple levels. Infection, Genetics and Evolution, 7, 731– 735.
De Mita S, Chantret N, Loridon K, Ronfort J, Bataillon T (2011) Molecular adaptation in flowering and symbiotic recognition pathways: insights from patterns of polymorphism in the legume Medicago truncatula. BMC Evolutionary Biology, 11, 229.
De Mita S, Thuillet A-C, Gay L et al. (2013) Detecting selection along environmental gradients: analysis of eight methods and their effectiveness for outbreeding and selfing populations. Molecular Ecology, 22, 1383–1399.
Dittmar EL, Oakley CG, Ågren J, Schemske DW (2014) Flowering time QTL in natural populations of Arabidopsis thaliana and implications for their adaptive value. Molecular
Ecology, 23, 4291–4303.
Dray S, Dufour A-B (2007) The ade4 Package: Implementing the duality diagram for ecologists. Journal of Statistical Software, 22, 1–20.
Eckert AJ, Bower AD, González-Martínez SC et al. (2010) Back to nature: ecological genomics of loblolly pine (Pinus taeda, Pinaceae). Molecular Ecology, 19, 3789–3805. Ehrenreich IM, Hanzawa Y, Chou L et al. (2009) Candidate gene association mapping of
Arabidopsis flowering time. Genetics, 183, 325–335.
Endler JA (1986) Natural Selection in the Wild. Princeton University Press.
Falconer, D. S. and T. F. C. Mackay. 1996. Introduction to quantitative genetics. Longmans Green, Harlow, Essex, UK. p133.
Version postprint
Accepted
Article
Fornara F, de Montaigu A, Coupland G (2010) SnapShot: control of flowering in
Arabidopsis. Cell, 141, 550–550.e2.
Fumagalli M, Sironi M, Pozzoli U et al. (2011) Signatures of environmental genetic
adaptation pinpoint pathogens as the main selective pressure through human evolution.
PLoS Genet, 7, e1002355.
García-Gil MR, Mikkonen M, Savolainen O (2003) Nucleotide diversity at two phytochrome loci along a latitudinal cline in Pinus sylvestris. Molecular Ecology, 12, 1195–1206. Grillo MA, Li C, Hammond M, Wang L, Schemske DW (2013) Genetic architecture of
flowering time differentiation between locally adapted populations of Arabidopsis
thaliana. New Phytologist, 197, 1321–1331.
Hall D, Luquez V, Garcia VM et al. (2007) Adaptive population differentiation in phenology across a latitudinal gradient in European Aspen (Populus tremula, L.): a comparison of neutral markers, candidate genes and phenotypic traits. Evolution, 61, 2849–2860. Hancock AM, Brachi B, Faure N et al. (2011) Adaptation to climate across the Arabidopsis
thaliana genome. Science, 334, 83–86.
Hancock AM, Witonsky DB, Ehler E et al. (2010) Colloquium Paper: Human adaptations to diet, subsistence, and ecoregion are due to subtle shifts in allele frequency. Proceedings
of the National Academy of Sciences, 107, 8924–8930.
Hecht V, Foucher F, Ferrándiz C et al. (2005) Conservation of Arabidopsis flowering genes in model legumes. Plant Physiology, 137, 1420–1434.
Hijmans RJ, Cameron SE, Parra JL, Jones PG, Jarvis A (2005) Very high resolution
interpolated climate surfaces for global land areas. International Journal of Climatology,
25, 1965–1978.
Ikeda H, Fujii N, Setoguchi H (2009) Molecular evolution of phytochromes in Cardamine
nipponica (Brassicaceae) suggests the involvement of PHYE in local adaptation. Genetics, 182, 603–614.
Ikeda H, Setoguchi H (2010) Natural selection on PHYE by latitude in the Japanese archipelago: insight from locus specific phylogeographic structure in Arcterica nana (Ericaceae). Molecular Ecology, 19, 2779–2791.
Ingvarsson PK, García MV, Hall D, Luquez V, Jansson S (2006) Clinal variation in phyB2, a candidate gene for day-length-induced growth cessation and bud set, across a latitudinal gradient in European Aspen (Populus tremula). Genetics, 172, 1845–1853.
IPCC (2001) Climate Change 2001: The Scientific Basis. Contribution of Working Group I to the Third Assessment Report of the Intergovernmental Panel on Climate Change
[Houghton, J.T., Y. Ding, D.J. Griggs, M. Noguer, P.J. van der Linden, X. Dai,
K.Maskell, and C.A. Johnson (eds.)]. Cambridge University Press, Cambridge, United Kingdom and New York, NY, USA, 881pp
Jombart T, Ahmed I (2011) adegenet 1.3-1: new tools for the analysis of genome-wide SNP data. Bioinformatics, 27, 3070-3071.
Jombart T, Devillard S, Balloux F (2010) Discriminant analysis of principal components: a new method for the analysis of genetically structured populations. BMC Genetics, 11, 94. Joost S, Bonin A, Bruford MW et al. (2007) A spatial analysis method (SAM) to detect
candidate loci for selection: towards a landscape genomics approach to adaptation.
Molecular Ecology, 16, 3955–3969.
Julier B, Huguet T, Chardon F et al. (2007) Identification of quantitative trait loci influencing aerial morphogenesis in the model legume Medicago truncatula. Theoretical and
Applied Genetics, 114, 1391–1406.
Keller SR, Levsen N, Olson MS, Tiffin P (2012) Local adaptation in the flowering-time gene network of balsam poplar, Populus balsamifera L. Molecular Biology and Evolution, 29, 3143–3152.