HAL Id: hal-02789117
https://hal.inrae.fr/hal-02789117
Preprint submitted on 5 Jun 2020HAL is a multi-disciplinary open access
archive for the deposit and dissemination of sci-entific research documents, whether they are pub-lished or not. The documents may come from teaching and research institutions in France or abroad, or from public or private research centers.
L’archive ouverte pluridisciplinaire HAL, est destinée au dépôt et à la diffusion de documents scientifiques de niveau recherche, publiés ou non, émanant des établissements d’enseignement et de recherche français ou étrangers, des laboratoires publics ou privés.
Distributed under a Creative Commons Attribution - NonCommercial - NoDerivatives| 4.0 International License
Josselin Clo, Joëlle Ronfort, Diala Abu Awad
To cite this version:
Josselin Clo, Joëlle Ronfort, Diala Abu Awad. Hide and seek: hidden genetic variance contributing to the adaptive potential of selfing populations. 2019. �hal-02789117�
1
Hide and seek: hidden genetic variance contributing to the adaptive
1potential of selfing populations
23
4
Josselin CLO §, Joëlle RONFORT §, Diala ABU AWAD §,* 5
6
7
§ AGAP, Univ Montpellier, CIRAD, INRA, Montpellier SupAgro, 34000 Montpellier, 8
France. 9
10 11
* Technical University of Munich, 85354 Freising, Germany.
12 13 14 15 16 17 18 19 20
2
Running title: Partial self-fertilization and adaptation from standing genetic variation. 21
22
23
Keywords: self-fertilization, standing genetic variation, adaptation, cryptic genetic variation, 24
residual allogamy. 25
26
27
Corresponding author: Josselin CLO, Arthur Young street, 34000 Montpellier, 28 +33432722335, [email protected] 29 30 31 32 33 34 35 36 37 38 39
3
Abstract: Standing genetic variation is considered a major contributor to the adaptive 40
potential of species. The low heritable genetic variation observed in self-fertilising 41
populations has led to the hypothesis that species with this particular mating system would be 42
less likely to adapt. However, a non-negligible amount of cryptic genetic variation for 43
polygenic traits, accumulated through negative linkage disequilibrium, could prove to be an 44
important source of standing variation in self-fertilising species. Using a classical quantitative 45
genetics model, we demonstrate that selfing populations are better able to store cryptic genetic 46
variance than outcrossing populations, notably due to their lower recombination rate. 47
Following a shift in the environment, this hidden diversity can be partially released, 48
increasing the additive variance and adaptive potential of selfing populations. In such 49
conditions, even though the process of adaptation itself is mating system dependant, selfers 50
reach levels of fitness that are equal to or higher than outcrossing populations within a few 51
generations. Outcrossing populations respond better to selection for the new optimum, but 52
they maintain more genetic diversity resulting in a higher genetic load. In selfing populations, 53
genetic diversity is remobilised, and new close-to-optimum genotypes are generated and 54
quickly increase in frequency, leading to more homogenous populations. Our results bring 55
new insights into the role of standing genetic variation for adaptation in selfing populations. 56
57
INTRODUCTION 58
59
Natural populations harbour a significant amount of genetic variation, especially at 60
loci governing polygenic traits (Mittell et al. 2015; Wood et al. 2016; Clo et al. 2019). This 61
variation, known as standing genetic variation, has been considered to be an important 62
predictor for the adaptive potential of populations (Orr and Betancourt 2001; Hermisson and 63
4
Pennings 2005; Barrett and Schluter 2008; Pritchard et al. 2010; Glémin and Ronfort 2013; 64
Matuszewski et al. 2015). Indeed, standing variation represents an easily accessible, hence 65
non-negligible, source of genetic variation, available for adaptation to changing conditions 66
(Hermisson and Pennings 2005; Barrett and Schluter 2008). Contrary to adaptation from de 67
novo mutations, the probability to adapt from standing variation is higher simply because 68
beneficial mutations already segregating in a population are expected to be present at higher 69
frequencies (Innan and Kim 2004; Barrett and Schluter 2008). It has also been suggested that 70
populations adapting from standing genetic variation can cope with more severe and more 71
rapid environmental change, as they are able to cross larger distances in phenotype space 72
(Matuszewski et al. 2015). The amount of heritable variance is thus expected to play a key 73
role in adaptation, and any forces affecting it may greatly influence whether or not 74
populations are able to survive environmental changes. 75
An important characteristic of populations, known to greatly affect the amount of 76
genetic variance, is the mating system. From both theoretical (Charlesworth and Charlesworth 77
1995; Lande and Porcher 2015; Abu Awad and Roze 2018) and empirical works 78
(Charlesworth and Charlesworth 1995; Geber and Griffen 2003; Clo et al. 2019), it is known 79
that, compared to outcrossing populations, self-fertilization reduces, on average, the amount 80
of additive genetic variance for polygenic or quantitative traits under stabilizing selection. 81
This diminution is due to more efficient purifying selection under selfing and linkage 82
disequilibria maintained between alleles at different loci: the so-called Bulmer effect (Lande 83
and Porcher 2015; Abu Awad and Roze 2018). Because of the low genetic variance 84
maintained in self-fertilizing populations, this mating system has been qualified as an 85
evolutionary dead-end (Stebbins 1957; Takebayashi and Morrell 2001; Igic and Busch 2013). 86
However, theoretical and some empirical works are now pointing towards the existence of 87
cryptic genetic variability (see Paaby and Rockman 2014 for a review), which should, in 88
5
addition to the “visible” genetic variation, contribute to the adaptive potential of natural 89
populations. Cryptic genetic variation has been defined as a part of a population’s standing 90
genetic variation that does not affect phenotypic variation in a stable environment, but can 91
increase heritable variation in environmental conditions rarely experienced (Gibson and 92
Dworkin 2004; Paaby and Rockman 2014). In other words, it defines a source of variability 93
that is not expressed in stable conditions (due to conditional neutrality, the genetic structure of 94
the population, etc), but which can contribute to adaptation in new conditions. Such “hidden” 95
variability has been detected in both outcrossing (in sticklebacks (McGuigan et al. 2011), 96
cavefish (Rohner et al. 2013), dung flies (Berger et al. 2011), gulls (Kim et al. 2013) or 97
spadefoot toads (Ledon-Rettig et al. 2010)) and selfing species (Caenorhabditis elegans,
98
Milloz et al. 2008; Arabidopsis thaliana, Queitsch et al. 2002). Two main mechanisms could 99
explain the accumulation and the release of such variance: interactions between loci (Badano 100
and Katsanis 2002; Carter et al. 2005; Shao et al. 2008), and phenotypic plasticity (Anderson 101
et al. 2013). In this paper, we focus on interactions between loci. 102
To maintain the population as close as possible to the phenotypic optimum, stabilizing 103
selection disfavors apparent genetic and phenotypic diversity (Lande and Porcher 2015; Abu 104
Awad and Roze 2018). However, the structuration of the additive variance also strongly 105
depends on the trait mutation rate and the prevalence of pleiotropy (Lande and Porcher 2015; 106
Abu Awad and Roze 2018). When the per-trait mutation rate is weak, associations between 107
loci are negligible, but when the rate increases, the creation and maintenance of co-adapted 108
gene complexes structure the additive variance into positive within-loci components and 109
negative among-loci components, reducing the observed additive variance (Abu Awad and 110
Roze 2018). The remobilization of alleles contributing to this last component of variance 111
could boost the evolvability of populations forced to undergo directional selection after a 112
change in the phenotypic optimum (Le Rouzic and Carlborg 2008). Indeed, if associations 113
6
between loci are broken, segregating alleles could express some or all of their additive effects 114
in new-genetic backgrounds. Classical models analyzing the effect of selfing on adaptation 115
from standing genetic variation have considered a single locus (Glémin and Ronfort 2013), 116
thus neglecting interactions among loci that could result in other forms of standing genetic 117
variation. As self-fertilization reduces the effective recombination rate (Nordborg 2000), 118
allowing the maintenance of co-adapted gene complexes, the storage of hidden genetic 119
diversity should be stronger in selfing populations (as suggested in Lande and Porcher 2015; 120
Abu Awad and Roze 2018), potentially increasing their probability to adapt to an 121
environmental change beyond that expected from single-locus models. 122
In this paper, we explore this hypothesis, using a quantitative genetics framework. We 123
describe and quantify how, to what degree, and under which conditions populations 124
accumulate hidden genetic variation in this theoretical framework of polygenic traits. Though
125
these polygenic trait models are based on simple hypotheses, they have so far proven to be
126
surprisingly accurate in predicting the distribution of epistatic coefficients (Martin et al. 2007) 127
andI inferring the mean dominance coefficient of mutations (Manna et al. 2011). We show 128
that, in models allowing for hidden genetic diversity and when adaptation is only possible 129
from pre-existing standing genetic variation, selfing populations are able to perform just as 130
well as their mixed-mating and outcrossing counterparts. 131
132
MATERIAL AND METHODS 133
134
General assumptions 135
7
We consider the evolution of a quantitative trait Z in a population of size N, made of 137
diploid individuals reproducing through partial self-fertilization, with a constant selfing rate σ. 138
The phenotypic value z of an individual is determined by the additive action of L loci each 139
with an infinite possible number of alleles and is given by 140
z = g + e, (1) 141
where g is the genetic component of the individual’s phenotype, and is given by g = ∑ 𝑔𝑔𝐿𝐿𝑗𝑗 𝑗𝑗𝑀𝑀+ 142
𝑔𝑔𝑗𝑗𝑃𝑃, with gMj (respectively gPj) the additive allelic effect at locus j inherited from the maternal 143
(respectively paternal) gamete. The random environmental effect, e, is drawn from a Gaussian 144
distribution of mean 0 and variance VE, and is considered to be independent from the genetic
145
components of fitness. The trait initially undergoes stabilizing selection around an optimal 146
phenotypic value (set arbitrarily at 0). The fitness value WZ of an individual with phenotype z
147
is thus described by the Gaussian function: 148
𝑊𝑊𝑍𝑍 = 𝑒𝑒−𝑑𝑑2/2𝜔𝜔², (2)
149
where d is the distance between the individual’s phenotype z and the optimum trait value and 150
ω² is the width of the fitness function, and represents the strength of selection. 151
152
Simulation model 153
154
We implement the model described above into an individual based simulation model 155
written in C++, a modified version of the “continuum of alleles” program provided in Abu 156
Awad and Roze (2018). The simulation program is available in File S1 and online 157
(https://github.com/dialaAbAw/SelfingAdaptation). The life cycle can be summarized by five
8
successive events: (1) phenotype-dependent choice of the maternal parent (selection), (2) 159
mating-type choice (selfing versus outcrossing), (3) phenotype-dependent choice of the 160
paternal parent in the case of outcrossing, (4) production of gametes (recombination) and (5) 161
mutation. We simulate two phases. In the first one, the population evolves in a stable 162
environment (for a fixed trait optimum value Z OPT = 0) until mutation-selection-drift
163
equilibrium (M-S-D) and we explore the effect of the mating system on the genetic 164
components and structure of a quantitative trait under stabilizing selection. In the second 165
phase, we consider the rate of adaptation following a brutal shift in the optimum (Z OPT shift
166
from 0 to 2.5, the shift being of order L . a²). 167
Each generation before equilibrium, the number of new mutations per chromosome 168
per generation is sampled from a Poisson distribution with parameter U, the per-trait haploid 169
genomic mutation rate (ranging from 0.005 to 0.1, in accordance with the literature (Keightley 170
and Bataillon 2000; Shaw et al. 2002; Haag-Liautard et al. 2007)). The additive value of a 171
new mutant allele is drawn from a Normal distribution of mean 0 and variance a². We use 172
parameter set values similar to those in Bürger et al. (1989) and Ronce et al. (2009), with the 173
number of freely recombining loci under selection L = 50, a² = 0.05, VE=1, ω² = 1 (and hence
174
VS = ω² + VE is equal to 2). The mean deleterious effect of mutations 𝑠𝑠¯ (𝑠𝑠¯ = a² / 2VS, Martin
175
and Lenormand 2006) is equal to 0.0125. Although simulations were run over a large range of 176
selfing values, throughout the manuscript we show results run principally for three rates of 177
self-fertilisation, σ = 0, 0.5 and 0.95, representing outcrossing, mixed-mating and 178
predominantly selfing respectively. They are representative of the three main patterns 179
observed over the whole range (σ from 0 to 1). We also considered two population sizes N = 180
250 and 1000. 181
9 Simulation program:
183
184
At the start of a simulation, all N individuals are homozygous for allele 0 at all L loci 185
and are thus at the fitness optimum. To form the next generation, N new zygotes are produced 186
through selfing with probability σ, and through random mating with probability 1-σ. Selection 187
occurs during the sampling of parental individuals, occurring with probabilities proportional 188
to their fitness. During meiosis, the number of cross-overs is sampled from a Poisson 189
distribution with parameter R (which represents the genome map length), and the position of 190
each cross-over along the chromosome is sampled from an uniform distribution. According to 191
Haldane’s mapping function, the recombination rate between two adjacent loci is 𝑟𝑟 = 192
1
2�1 − 𝑒𝑒𝑒𝑒𝑒𝑒 � −2𝑅𝑅
𝐿𝐿−1��, with R = 50 in our simulations. Mutation occurs after recombination: the
193
number of new mutations per chromosome per generation is sampled from a Poisson 194
distribution with parameter U, the haploid genomic mutation rate (U = Lµ, with µ being the 195
per locus mutation rate). The additive value of a new mutant allele is drawn from a Normal 196
distribution of mean 0 and variance a². 197
After reaching the M-S-D equilibrium, we introduce an environmental change by 198
shifting the phenotypic optimum. The only source of genetic variability to reach the new 199
optimum is the standing variation accumulated at M-S-D equilibrium (after the shift, U is set 200
to 0). We then let the population evolve for 200 generations. 201
202
Effect of selfing on genetic variance structuration at Mutation-Selection-Drift equilibrium 203
10
Following Turelli & Barton (Turelli and Barton 1990), we decompose the genetic variance of 205
a polygenic trait using the following equation: 206 VA = 2 ∑ �𝐶𝐶𝐿𝐿𝑗𝑗 𝑗𝑗𝑗𝑗+ 𝐶𝐶𝑗𝑗,𝑗𝑗�+ 2 ∑𝐿𝐿𝑗𝑗≠𝑗𝑗�𝐶𝐶𝑗𝑗𝑗𝑗+ 𝐶𝐶𝑗𝑗,𝑗𝑗�, (3) 207 with 208 Cj j = 1 2 E[ (g M j - 𝑔𝑔¯j)² + (gPj - 𝑔𝑔¯j)²] (4) 209 and 210 Cj,j = E[ (gMj - 𝑔𝑔¯j) . (gPj - 𝑔𝑔¯j)], (5) 211
where 𝑔𝑔¯j is the mean allelic effect on the phenotype at locus j and gMj (respectively gPj) is the 212
allelic effect at locus j inherited from the maternal (respectively paternal) gamete. The sum of 213
all values of Cjj represents the variance of allelic effects (the genic variance Vgenic, the genetic
214
variance of a trait in a population harboring the same allelic frequencies as the population 215
under study, but without any genetic association between loci) and is computed from 216
simulation outputs following equation (4). The sum of all values of Cj,j represents the 217
covariance in allelic effects on the maternally and paternally inherited chromosomes at locus 218
j, and represents the fraction of the genetic variance due to excess of homozygosity (named 219
Vinbred); we compute it following equation (5). This quantity represents F.Vgenic, where F is the
220
inbreeding coefficient of the population. These first term of equation (3) (2 ∑ �𝐶𝐶𝐿𝐿𝑗𝑗 𝑗𝑗𝑗𝑗+ 𝐶𝐶𝑗𝑗,𝑗𝑗�) 221
represents the genetic variance due to within locus variation. The second term (2 ∑ �𝐶𝐶𝐿𝐿𝑗𝑗≠𝑗𝑗 𝑗𝑗𝑗𝑗+ 222
𝐶𝐶𝑗𝑗,𝑗𝑗�) represents the component of the variance due to associations between loci (noted VLD),
223
and is obtained by subtracting Vgenic and Vinbred from the total additive genetic variance. This
224
component is proportional to linkage disequilibrium (LD), and tends to be negative under 225
stabilizing selection due to associations between alleles from different loci with compensatory 226
11
effects (i.e. the allele on one locus is positive, the other negative, their effects on the 227
phenotype thus cancel out when both are present). 228
229
Analyses after the environmental change 230
231
Due to an increased probability of extinction during long periods of maladaptation, it 232
seems more relevant to focus only on the dynamics of adaptation during the first generations 233
after an environmental change. We follow the temporal dynamics of the additive variance and 234
its components, the dynamic of the mean population phenotype, and the dynamic of the mean 235
population fitness, as a function of the mating system and the mutation rate, over 20 236
generations. 237
In addition, and in order to test if remobilization of VLD plays a role in the adaptation
238
of selfing populations, we computed the slope of the trait mean dynamics just after the 239
environmental change (during the first five generations) as a function of the amount of 240
additive variance available at M-S-D equilibrium. If remobilization of VLD is involved in the
241
adaptive process of selfing populations, the initial slope, for a similar amount of additive 242
variance, should be higher in selfing populations compared to mixed mating and outcrossing 243 ones. 244 245
RESULTS
246 24712
Below we present results only for N = 250 and L = 50, as larger population sizes and 248
more loci did not qualitatively change the results. Results for N = 1000, as well as L = 500 are 249
given in the supplementary materials section (Figures S1-S6). 250
251
DECOMPOSITION OF THE GENETIC VARIANCE AT EQUILIBRIUM 252
253
As predicted, the additive genetic variance present at M-S-D equilibrium in our 254
simulations is negatively correlated with the selfing rate (figure 1A, see Abu Awad and Roze 255
2018 for the analytical model). By examining each component of the additive variance, we 256
can see that the variance due to within loci variation (Vgenic + VF) is higher in selfing
257
populations due to the higher rate of homozygosity (figure 1 B & C). These two components, 258
as well as the total additive variance, increase linearly with increasing mutation rates (figure 1 259
A, B & C). The among-loci component (VLD) is negative (figure 1D), due to the build-up of
260
linkage disequilibrium between alleles with different signs, allowing phenotypes to be close to 261
the phenotypic optimum (0). Because recombination is less effective under selfing, this 262
negative component is responsible for the smaller additive variance observed under 263
predominant selfing. It also contributes significantly to the variance observed in mixed mating 264
and outcrossing populations with moderate to high mutation rates (figure 1D). Larger 265
population sizes or more loci do not change the results for outcrossing and mixed mating 266
populations (Figures S1-S2). For selfing populations, larger population sizes and higher per 267
locus mutation rates contribute to increasing negative linkage disequilibrium (VLD) due to
268
negative linkage disequilibrium (Figure S3). 269
13 271
Figure 1. Additive genetic variance and its components as a function of the genomic mutation 272
rate and the mating system. A. Observed additive variance for the phenotypic trait. B. Genic 273
variance for the phenotypic trait (Vgenic). C. Genetic variance due to inbreeding (VF). D.
274
Genetic variance due to linkage disequilibrium (VLD). Error bars stand for 95% confidence
275
interval (n = 100). 276
277
ADAPTATION THROUGH STANDING GENETIC VARIATION: 278
279
For simplicity, we focus on four mutation rates (U = 0.005; 0.03; 0.05; 0.1), 280
representing the different patterns of genetic variance observed at M-S-D equilibrium for the 281
14
outcrossing, mixed mating and selfing populations mentioned above. We first describe the 282
dynamics observed for outcrossing populations, which will serve as a reference for 283
comparison with the dynamics of selfing populations. We generally find that the dynamics for 284
mixed mating populations are similar to those of outcrossing populations (Figure S4). 285
286
DYNAMICS OF THE ADDITIVE VARIANCE AND OF ITS COMPONENTS: 287
288
In outcrossing populations, the additive variance exhibits very tiny changes during the 289
adaptation process, so do its components (Figure 2). In all cases, the observed additive genetic 290
variance slightly increases during the first generations of adaptation (Figure 2A), then, it 291
either reaches an equilibrium (Figure 2A, U < 0.1) or slowly begins to decrease (Figure 2A, U 292
= 0.1). When VLD is small at M-S-D equilibrium (U < 0.1), the observed increase of the
293
additive variance is mainly due to an increase of the genic variance (Figure 2B), probably due 294
to successive sweeps of rare alleles during the adaptation process. In these situations, VLD
295
slightly decreases with time (Figure 2C), indicating that some associations between loci are 296
building up. When VLD is significant at M-S-D equilibrium (U = 0.1), the genic variance
297
remains constant during the first generations (Figure 2B), but VLD increases slightly (Figure
298
2C), contributing to the increase of the additive variance. The second phase during which the 299
observed additive variance decreases can be explained by the decrease of genic variance with 300
time, due to the purging of deleterious mutations (Figure 2B). 301
15
303
Figure 2. Dynamics of additive genetic variance and its components in function of the 304
haplotypic trait mutation rate, for outcrossing populations. A. Observed additive variance for 305
the phenotypic trait. B. Genic variance for the phenotypic trait (Vgenic). C. Genetic variance of
306
the phenotype due to linkage disequilibrium (VLD). Error bars stand for 95% confidence
307
interval (n=100). 308
309
Contrary to the dynamics observed in outcrossing populations, additive variance 310
substantially varies during the adaptation process in selfing populations. For small mutation 311
rates (U ≤ 0.03), the dynamics are very similar to those observed in outcrossing populations 312
(figure 3). The observed additive variance slightly increases during the first generations 313
(Figure 3A). This increase is due to a rise of the genic variance (Figure 3B), associated with a 314
16
decrease of VLD (Figure 3C), probably due to an interaction between sweeps of beneficial
315
mutations that were rare before the environmental change and the creation of new beneficial 316
associations between loci. For higher mutation rates (U ≥ 0.05), the dynamics are different. 317
The genic variance remains constant during the first generations and then decreases (figure 318
3B), whereas VLD increases faster than the decrease of Vgenic (figure 3C), explaining the
319
overall increase of additive variance. This behaviour can be explained as follows: there is a 320
complex interaction between the purging of deleterious mutations due to selfing, which tends 321
to quickly fix the best multi-locus genotypes, eroding genetic diversity and residual allogamy, 322
which allows the mobilization of a small fraction of the hidden genetic diversity. The outcome 323
of this interaction is an increase of the genetic diversity and of the populations’ adaptive 324
potential. The fact that the rate of adaptation (i.e the slope of the change in the trait values 325
during the first generations) as a function of the initial level of additive variance is higher for 326
selfing populations when VLD is large, confirms that the remobilisation of the hidden diversity
327
plays a role in the adaptation process (figure S5). 328
17 330
Figure 3. Dynamics of additive genetic variance and its components in function of the 331
haplotypic trait mutation rate, for selfing populations. A. Observed additive variance for the 332
phenotypic trait. B. Genic variance for the phenotypic trait (Vgenic). C. Genetic variance of the
333
phenotype due to linkage disequilibrium (VLD). Error bars stand for 95% confidence interval
334
(n=100). 335
336
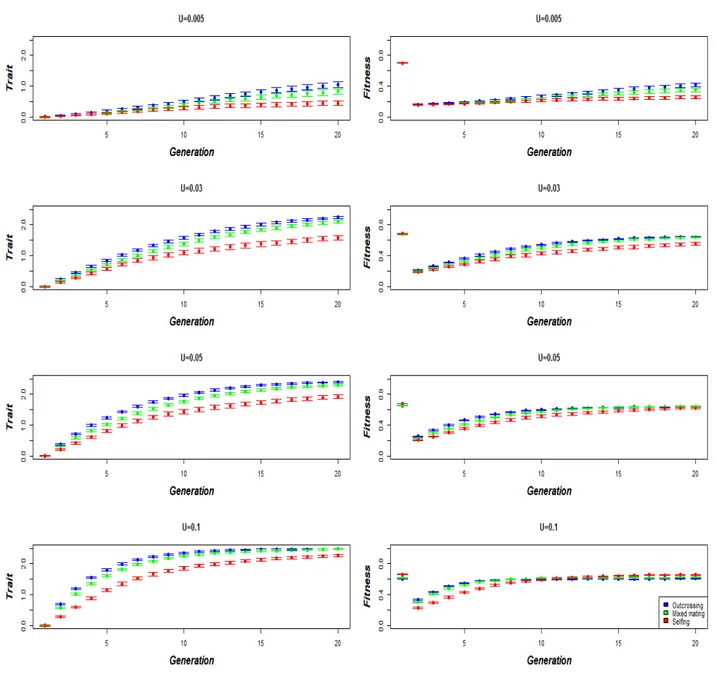
TRAIT AND FITNESS DYNAMICS DURING ADAPTATION PROCESS: 337
338
Here, we consider that there is adaptation if populations reach a similar level of fitness 339
as that observed before the environmental change. In all cases, compared to selfing 340
18
populations, outcrossing and mixed mating population respond better to selection, by being 341
closer to the new phenotypic optimum (figure 4). When the mutation rate is weak (U = 342
0.005), none of the populations are able to adapt, and thus the fitness remains low (figure 4). 343
For higher mutation rates (U > 0.005), outcrossing and mixed mating populations are always 344
close to the new optimum, and are able to return to fitness levels similar to those observed at 345
M-S-D equilibrium. Selfing populations require that the mutation rate is high enough (U ≥ 346
0.05, figure 4) in order to reach similar fitness levels as those observed in outcrossing 347
populations. Interestingly, in some cases, adaptation occurs more rapidly in selfing 348
populations, despite the higher genetic diversity of outcrossing populations. The larger the 349
population size and the higher the per-locus mutation rate, the higher the level of potentially 350
usable hidden genetic diversity, and the smaller the genomic mutation rate necessary to reach 351
similar levels of fitness in selfing populations (figures S6-S7). 352
Nevertheless, different mating systems exhibit different dynamics of adaptation. 353
Outcrossing populations adapt by reaching a new phenotypic optimum, but they also maintain 354
a high level of genetic diversity (figure 3), resulting in populations having both mal-adapted 355
and well-adapted individuals. Selfing populations are always further away from the new 356
phenotypic optimum (figure 4), but both the remobilization of the VLD, and the fast fixation of
357
the “best” phenotypes allow for the production of close-to-optimum individuals. These 358
phenotypes will then quickly increase in frequency, leading to more homogenous populations 359
than observed for an outcrossing mating system (figure 4). 360
19 362
Figure 4. Dynamics of the trait and fitness, in function of the trait haplotypic mutation rate 363
and the mating system. Error bars stand for 95% confidence interval (n=100). 364
365
DISCUSSION 366
367
In accordance with Stebbins’ definition of the dead-end hypothesis (Stebbins 1957), 368
single-locus models predict that adaptation from standing genetic variation is less likely in 369
20
selfing populations compared to outcrossing ones, notably due to the reduced genetic 370
variation resulting from purging (Glémin and Ronfort 2013). Considering a polygenic trait, 371
and associated interactions among loci, we find that this is not always the case. Indeed, we 372
find that for low mutation rates, our results support the expectations of single locus models. 373
However, for higher mutation rates, and as predicted by previous work (Abu Awad and Roze 374
2018), associations between loci are no longer negligible. In this case, stabilizing selection 375
shelters an important amount of hidden additive variance, especially in self-fertilising 376
populations. We show that some of this variance can be released during phases of directional 377
selection to new environmental conditions. Our results support that it is possible to observe 378
similar levels of adaptation in selfing and outcrossing populations, despite unconditionally 379
lower levels of observed additive variance under predominant selfing. 380
381
Hidden genetic variation, its remobilization and genotypic selection 382
383
Stabilizing selection is expected to favour the build-up and maintenance of co-adapted 384
gene complexes, and this will structure the additive variance into positive within-loci 385
components and negative among-loci components, reducing the observed additive variance 386
(Abu Awad and Roze 2018). In a changing environment, alleles involved in the negative 387
among loci component of variance may be unveiled and mobilized to respond to directional 388
selection (Le Rouzic and Carlborg 2008). Our analysis shows that such associations between 389
loci, coupled with hidden genetic variation, are more likely to emerge in selfing than in 390
outcrossing populations, because of less efficient recombination under selfing (Lande and 391
Porcher 2015; Abu Awad and Roze 2018). This prediction is in accordance with empirical 392
observations of more frequent transgressive segregation (progeny of a cross being outside the 393
21
phenotypic parental range) in inbred compared to outbred species (Rieseberg et al. 1999; 394
Johansen-Morris and Latta 2006). Our analysis also shows that the less effective 395
recombination rate associated with selfing avoids the complete release of the negative linkage 396
disequilibria and thus limits the response to selection. As a result, selection mostly operates at 397
the genotypic level while allelic selection is more prevalent in more recombining populations 398
(Neher and Shraiman 2009). Interestingly, if the rate of self-fertilization is changed during the 399
adaptation process (σ changing from 0.95 to zero after the environmental change), the 400
dynamics of the fitness remains similar (figures S8-S9). Indeed, under complete outcrossing 401
all the hidden genetic variance can be mobilized and this allows initially selfing populations 402
to reach the new phenotypic optimum but recombination also generates less adapted 403
genotypes which reduces the mean population fitness. 404
405
De novo mutations vs. standing genetic variation: rethinking adaptation in selfing 406
species? 407
408
It has been a long accepted paradigm that the advantage procured by selfing, was the 409
rapid fixation of de novo mutations more efficiently than in outcrossing populations, 410
independently of the dominance of new mutations, a process known has “Haldane sieve” 411
(Haldane 1927). Indeed, from one locus theory, adaptation through new mutations is more 412
likely in selfing species, and is more likely than adaptation from standing genetic variation 413
(Glémin and Ronfort 2013). However, recent works have suggested that the reduced effective 414
recombination rate of selfing populations adds a disadvantage even when it comes to the 415
fixation of new mutations. Unlike what is expected in outcrossing populations, the fixation of 416
beneficial mutations in selfing populations can be hindered if they appear during the selective 417
22
sweep triggered by a beneficial allele at another locus (Hartfield and Glémin 2016). This 418
observation as well as the results presented here show that predictions from the point of view 419
of polygenic models are less dichotomist: the ability of selfing populations to adapt from 420
either de novo mutations or standing variation strongly depends on the parameters considered 421
(the mutation rate in particular), with selfers being often as able to adapt as outcrossers, even 422
if the underlying mechanisms strongly differ. 423
We have only considered a simple architecture of quantitative traits in which epistatic 424
interactions emerge naturally. Epistasis, and notably its directionality, is known to play a key 425
role in adaptation (Hansen 2013). Positive epistasis, with genes that reinforce each other’s 426
effects in the direction of selection, inflate the additive variance and thus the ability of 427
populations to adapt to an environmental change (Carter et al. 2005; Monnahan and Kelly 428
2015), contrary to the non-directional epistatic scenario (Carter et al. 2005). Negative 429
epistasis, where genes tend to mute each other’s effects, reduces the additive variance of the 430
character, thus limiting adaptive potential (Carter et al. 2005). Few empirical estimations of 431
the directionality of epistasis are available in literature (Le Rouzic 2014; Monnahan and Kelly 432
2015; Oakley et al. 2015, all detecting positive epistatic interactions), despite numerous 433
methods and the diversity of data used to infer it (Le Rouzic 2014). Developing methods to 434
detect and measure the directionality of epistatic interactions in relation to the mating system 435
may bring us closer to understanding the differences in patterns of adaptation observed in 436
selfing and outcrossing populations. 437
438
New insights into the role of standing genetic variation in the adaptation dynamics of 439
selfing populations 440
23
The overwhelming success of selfing species in the domestication process and as 442
invasive species is not considered as resulting from a higher adaptive ability of selfing species 443
compared to outcrossing ones. For instance, the invasive success of selfing populations is 444
attributed to reproductive assurance, since a single individual is able to colonize a new 445
environment (Rambuda and Johnson 2004; van Kleunen et al. 2008), and to reduce gene flow 446
which are expected to limit maladapted gene exchanges between populations (Levin 2010). 447
Regarding domestication, it has been argued that selection in selfing populations is most 448
probably due to new mutations, because the standing genetic variation is lower in such 449
populations due to more efficient purging of deleterious mutations that could be involved in 450
the domestication process (Glémin and Bataillon 2009). This idea is reinforced by the fact that 451
selfing species are expected to quickly fix a rare beneficial mutation, independently from its 452
dominance level (Ross-Ibarra 2005). In their review on mating system variation in 453
domesticated plant species, Glémin and Bataillon (2009) have suggested that the high 454
frequency of self-fertilising crop species could be related to an increase in additive variance 455
during domestication; this idea has however never been tested theoretically or empirically. 456
Here we show that this increase in additive variance could indeed be an advantage when 457
selfing species are faced with new environments. However, our results hold true only if 458
bottlenecks during the domestication and invasion processes are not too strong or if mutation 459
rates are high. 460
461
CONCLUSION AND PERSPECTIVES
462463
In this work, we argue that selfing populations under stabilizing selection are able to 464
accumulate hidden genetic variation through negative linkage disequilibrium. Thanks to this 465
24
hidden variation, adaptation under high self-fertilisation rates is not always limited by the 466
expected reduction in additive genetic variance due to purging. We therefore suggest that a 467
simple estimation of additive variance of quantitative traits is not adequate when speculating 468
on the long-term adaptive capacity of a population. Complementary analyses should also be 469
carried out when quantifying the long-term evolvability of a population. Such analyses 470
include looking for transgressive segregation, or carrying out experimental evolutionary 471
experiments in which directional selection is induced. More empirical evidence is required to 472
determine how frequent is cryptic diversity in natural populations of selfing species, and 473
whether or not this property is sufficient to allow for selfing species to adapt to a changing 474
environment. 475
476
Acknowledgment: We would like to thank D. Roze for helpful discussions about the
477
analyses and interpretations of the results, and E. Noël, P. David, O. Ronce, S. Glémin and C.
478
Devaux for insightful discussions on the results. This work has been conducted with the help
479
of the data and calculation center South Green of the CIRAD- UMR AGAP. This work was
480
supported by project SEAD (ANR-13-ADAP-0011). D. Abu Awad was also funded by the
481
TUM University Foundation Fellowship.
482 483 484 Bibliography: 485 486
Abu Awad D., and D. Roze, 2018 Effects of partial selfing on the equilibrium genetic variance, 487
mutation load, and inbreeding depression under stabilizing selection. Evolution 72: 751–769. 488
25
Anderson J. T., C.-R. LEE, C. A. Rushworth, R. I. Colautti, and T. MITCHELL-OLDS, 2013 Genetic 489
trade-offs and conditional neutrality contribute to local adaptation. Mol. Ecol. 22: 699–708. 490
Badano J. L., and N. Katsanis, 2002 Human genetics and disease: Beyond Mendel: an evolving view 491
of human genetic disease transmission. Nat. Rev. Genet. 3: 779. 492
Barrett R. D., and D. Schluter, 2008 Adaptation from standing genetic variation. Trends Ecol. Evol. 493
23: 38–44. 494
Berger D., S. S. Bauerfeind, W. U. Blanckenhorn, and M. A. Schäfer, 2011 High temperatures reveal 495
cryptic genetic variation in a polymorphic female sperm storage organ. Evol. Int. J. Org. Evol. 496
65: 2830–2842. 497
Bürger R., G. P. Wagner, and F. Stettinger, 1989 HOW MUCH HERITABLE VARIATION CAN BE 498
MAINTAINED IN FINITE POPULATIONS BY MUTATION–SELECTION BALANCE? 499
Evolution 43: 1748–1766. https://doi.org/10.1111/j.1558-5646.1989.tb02624.x 500
Carter A. J., J. Hermisson, and T. F. Hansen, 2005 The role of epistatic gene interactions in the 501
response to selection and the evolution of evolvability. Theor. Popul. Biol. 68: 179–196. 502
Charlesworth D., and B. Charlesworth, 1995 Quantitative genetics in plants: the effect of the breeding 503
system on genetic variability. Evolution 49: 911–920. 504
Clo J., L. Gay, and J. Ronfort, 2019 How does selfing affect the genetic variance of quantitative traits? 505
An updated meta-analysis on empirical results in angiosperm species. Evolution. 506
Geber M. A., and L. R. Griffen, 2003 Inheritance and natural selection on functional traits. Int. J. Plant 507
Sci. 164: S21–S42. 508
Gibson G., and I. Dworkin, 2004 Uncovering cryptic genetic variation. Nat. Rev. Genet. 5: 681. 509
Glémin S., and T. Bataillon, 2009 A comparative view of the evolution of grasses under 510
domestication. New Phytol. 183: 273–290. https://doi.org/10.1111/j.1469-8137.2009.02884.x 511
26
Glémin S., and J. Ronfort, 2013 Adaptation and maladaptation in selfing and outcrossing species: new 512
mutations versus standing variation. Evol. Int. J. Org. Evol. 67: 225–240. 513
Haag-Liautard C., M. Dorris, X. Maside, S. Macaskill, D. L. Halligan, et al., 2007 Direct estimation of 514
per nucleotide and genomic deleterious mutation rates in Drosophila. Nature 445: 82. 515
Haldane J. B. S., 1927 A mathematical theory of Natural and Artificial Selection. Math. Proc. Camb. 516
Philos. Soc. 23: 607–615. https://doi.org/10.1017/S0305004100011750 517
Hansen T. F., 2013 WHY EPISTASIS IS IMPORTANT FOR SELECTION AND ADAPTATION. 518
Evolution 67: 3501–3511. https://doi.org/10.1111/evo.12214 519
Hartfield M., and S. Glémin, 2016 Limits to Adaptation in Partially Selfing Species. Genetics 203: 520
959. https://doi.org/10.1534/genetics.116.188821 521
Hermisson J., and P. S. Pennings, 2005 Soft sweeps: molecular population genetics of adaptation from 522
standing genetic variation. Genetics 169: 2335–2352. 523
Igic B., and J. W. Busch, 2013 Is self-fertilization an evolutionary dead end? New Phytol. 198: 386– 524
397. 525
Innan H., and Y. Kim, 2004 Pattern of polymorphism after strong artificial selection in a 526
domestication event. Proc. Natl. Acad. Sci. 101: 10667–10672. 527
Johansen-Morris A. D., and R. G. Latta, 2006 Fitness consequences of hybridization between ecotypes 528
of Avena barbata: hybrid breakdown, hybrid vigor, and transgressive segregation. Evolution 529
60: 1585–1595. 530
Keightley P. D., and T. M. Bataillon, 2000 Multigeneration Maximum-Likelihood Analysis Applied to 531
Mutation-Accumulation Experiments in <em>Caenorhabditis elegans</em>. Genetics 154: 532
1193. 533
27
Kim S.-Y., J. C. Noguera, A. Tato, and A. Velando, 2013 Vitamins, stress and growth: the availability 534
of antioxidants in early life influences the expression of cryptic genetic variation. J. Evol. 535
Biol. 26: 1341–1352. 536
Kleunen M. van, J. C. Manning, V. Pasqualetto, and S. D. Johnson, 2008 Phylogenetically 537
Independent Associations between Autonomous Self‐Fertilization and Plant Invasiveness. 538
Am. Nat. 171: 195–201. https://doi.org/10.1086/525057 539
Lande R., and E. Porcher, 2015 Maintenance of quantitative genetic variance under partial self-540
fertilization, with implications for evolution of selfing. Genetics 200: 891–906. 541
Le Rouzic A., and Ö. Carlborg, 2008 Evolutionary potential of hidden genetic variation. Trends Ecol. 542
Evol. 23: 33–37. 543
Le Rouzic A., 2014 Estimating directional epistasis. Front. Genet. 5: 198. 544
https://doi.org/10.3389/fgene.2014.00198 545
Ledon-Rettig C. C., D. W. Pfennig, and E. J. Crespi, 2010 Diet and hormonal manipulation reveal 546
cryptic genetic variation: implications for the evolution of novel feeding strategies. Proc. R. 547
Soc. B Biol. Sci. 277: 3569–3578. 548
Levin D. A., 2010 Environment-enhanced self-fertilization: implications for niche shifts in adjacent 549
populations. J. Ecol. 98: 1276–1283. https://doi.org/10.1111/j.1365-2745.2010.01715.x 550
Manna F., G. Martin, and T. Lenormand, 2011 Fitness Landscapes: An Alternative Theory for the 551
Dominance of Mutation. Genetics 189: 923. https://doi.org/10.1534/genetics.111.132944 552
Martin G., and T. Lenormand, 2006 A GENERAL MULTIVARIATE EXTENSION OF FISHER’S 553
GEOMETRICAL MODEL AND THE DISTRIBUTION OF MUTATION FITNESS 554
EFFECTS ACROSS SPECIES. Evolution 60: 893–907. https://doi.org/10.1111/j.0014-555
3820.2006.tb01169.x 556
28
Martin G., S. F. Elena, and T. Lenormand, 2007 Distributions of epistasis in microbes fit predictions 557
from a fitness landscape model. Nat. Genet. 39: 555–560. https://doi.org/10.1038/ng1998 558
Matuszewski S., J. Hermisson, and M. Kopp, 2015 Catch me if you can: adaptation from standing 559
genetic variation to a moving phenotypic optimum. Genetics 200: 1255–1274. 560
McGuigan K., N. Nishimura, M. Currey, D. Hurwit, and W. A. Cresko, 2011 Cryptic genetic variation 561
and body size evolution in threespine stickleback. Evol. Int. J. Org. Evol. 65: 1203–1211. 562
Milloz J., F. Duveau, I. Nuez, and M.-A. Félix, 2008 Intraspecific evolution of the intercellular 563
signaling network underlying a robust developmental system. Genes Dev. 22: 3064–3075. 564
Mittell E. A., S. Nakagawa, and J. D. Hadfield, 2015 Are molecular markers useful predictors of 565
adaptive potential? Ecol. Lett. 18: 772–778. 566
Monnahan P. J., and J. K. Kelly, 2015 Epistasis is a major determinant of the additive genetic variance 567
in Mimulus guttatus. PLoS Genet. 11: e1005201. 568
Neher R. A., and B. I. Shraiman, 2009 Competition between recombination and epistasis can cause a 569
transition from allele to genotype selection. Proc. Natl. Acad. Sci. 106: 6866. 570
https://doi.org/10.1073/pnas.0812560106 571
Nordborg M., 2000 Linkage disequilibrium, gene trees and selfing: an ancestral recombination graph 572
with partial self-fertilization. Genetics 154: 923–929. 573
Oakley C. G., J. Ågren, and D. W. Schemske, 2015 Heterosis and outbreeding depression in crosses 574
between natural populations of Arabidopsis thaliana. Heredity 115: 73. 575
Orr H. A., and A. J. Betancourt, 2001 Haldane’s sieve and adaptation from the standing genetic 576
variation. Genetics 157: 875–884. 577
Paaby A. B., and M. V. Rockman, 2014 Cryptic genetic variation: evolution’s hidden substrate. Nat. 578
Rev. Genet. 15: 247. 579
29
Pritchard J. K., J. K. Pickrell, and G. Coop, 2010 The genetics of human adaptation: hard sweeps, soft 580
sweeps, and polygenic adaptation. Curr. Biol. 20: R208–R215. 581
Queitsch C., T. A. Sangster, and S. Lindquist, 2002 Hsp90 as a capacitor of phenotypic variation. 582
Nature 417: 618. 583
Rambuda T. D., and S. D. Johnson, 2004 Breeding systems of invasive alien plants in South Africa: 584
does Baker’s rule apply? Divers. Distrib. 10: 409–416. https://doi.org/10.1111/j.1366-585
9516.2004.00100.x 586
Rieseberg L. H., M. A. Archer, and R. K. Wayne, 1999 Transgressive segregation, adaptation and 587
speciation. Heredity 83: 363–372. 588
Rohner N., D. F. Jarosz, J. E. Kowalko, M. Yoshizawa, W. R. Jeffery, et al., 2013 Cryptic variation in 589
morphological evolution: HSP90 as a capacitor for loss of eyes in cavefish. Science 342: 590
1372–1375. 591
Ronce O., F. H. Shaw, F. Rousset, and R. G. Shaw, 2009 IS INBREEDING DEPRESSION LOWER 592
IN MALADAPTED POPULATIONS? A QUANTITATIVE GENETICS MODEL. Evolution 593
63: 1807–1819. https://doi.org/10.1111/j.1558-5646.2009.00678.x 594
Ross-Ibarra J., 2005 Quantitative trait loci and the study of plant domestication, pp. 197–204 in 595
Genetics of Adaptation, edited by Mauricio R. Springer Netherlands, Dordrecht.
596
Shao H., L. C. Burrage, D. S. Sinasac, A. E. Hill, S. R. Ernest, et al., 2008 Genetic architecture of 597
complex traits: large phenotypic effects and pervasive epistasis. Proc. Natl. Acad. Sci. 105: 598
19910–19914. 599
Shaw F. H., C. J. Geyer, and R. G. Shaw, 2002 A COMPREHENSIVE MODEL OF MUTATIONS 600
AFFECTING FITNESS AND INFERENCES FOR ARABIDOPSIS THALIANA. Evolution 601
56: 453–463. https://doi.org/10.1111/j.0014-3820.2002.tb01358.x 602
30
Stebbins G. L., 1957 Self fertilization and population variability in the higher plants. Am. Nat. 91: 603
337–354. 604
Takebayashi N., and P. L. Morrell, 2001 Is self-fertilization an evolutionary dead end? Revisiting an 605
old hypothesis with genetic theories and a macroevolutionary approach. Am. J. Bot. 88: 1143– 606
1150. 607
Turelli M., and N. H. Barton, 1990 Dynamics of polygenic characters under selection. Theor. Popul. 608
Biol. 38: 1–57. https://doi.org/10.1016/0040-5809(90)90002-D 609
Waddington C. H., 1953 Genetic assimilation of an acquired character. Evolution 7: 118–126. 610
Wood J. L., M. C. Yates, and D. J. Fraser, 2016 Are heritability and selection related to population 611
size in nature? Meta-analysis and conservation implications. Evol. Appl. 9: 640–657. 612