HAL Id: hal-01032110
https://hal.archives-ouvertes.fr/hal-01032110
Submitted on 31 May 2020
HAL is a multi-disciplinary open access
archive for the deposit and dissemination of
sci-entific research documents, whether they are
pub-lished or not. The documents may come from
teaching and research institutions in France or
abroad, or from public or private research centers.
L’archive ouverte pluridisciplinaire HAL, est
destinée au dépôt et à la diffusion de documents
scientifiques de niveau recherche, publiés ou non,
émanant des établissements d’enseignement et de
recherche français ou étrangers, des laboratoires
publics ou privés.
Copyright
Comparison of physical and mechanical properties of
tension and opposite wood from ten tropical rainforest
trees from different species
Julien Ruelle, Jacques Beauchene, Anne Thibaut, Bernard Thibaut
To cite this version:
Julien Ruelle, Jacques Beauchene, Anne Thibaut, Bernard Thibaut. Comparison of physical and
mechanical properties of tension and opposite wood from ten tropical rainforest trees from different
species. Annals of Forest Science, Springer Nature (since 2011)/EDP Science (until 2010), 2007, 64
(5), pp.503-510. �10.1051/forest:2007027�. �hal-01032110�
DOI: 10.1051/forest:2007027
Original article
Comparison of physical and mechanical properties of tension
and opposite wood from ten tropical rainforest trees
from di
fferent species
Julien R
a,b*, Jacques B
a, Anne T
a, Bernard T
aaUMR EcoFoG, Campus agronomique – BP 709, 97387 Kourou Cedex, Guyane Française bPresent adress: School of Bioagricultural Sciences, Nagoya University Chikusa, Nagoya 464-8601, Japan
(Received 15 August 2006; accepted 27 February 2007)
Abstract – On 10 trees from 10 species of French Guyana tropical rainforest in a clear active process of restoring verticality growth strains were
measured in situ in order to determine the occurrence of tension wood within samples. Wood specimens were cut in the vicinity of the growth strains measurements in order to measure some mechanical and physical properties. As suspected, tensile growth strains was very much higher in tension wood zone, because longitudinal modulus of elasticity was slightly higher. Longitudinal shrinkage was also much higher in tension wood than in opposite wood.
tension wood/ opposite wood / tropical rainforest / physical and mechanical properties
Résumé – Comparaison du bois de tension et du bois opposé de dix arbres provenant d’espèces différentes de forêt tropicale humide. Des
mesures de contraintes de croissance ont été réalisées sur 10 arbres en cours de redressement actif appartenant à 10 espèces de la forêt tropicale humide de Guyane Française afin de s’assurer de la présence de bois de tension. Des échantillons de bois, prélevés au voisinage des mesures de contraintes de croissance, ont permis de mesurer un certains nombres de propriétés physiques et mécaniques. Comme présumé les contraintes de croissance sont beaucoup plus élevées au niveau du secteur de bois de tension, car le module d’élasticité est légèrement plus élevé. Le retrait longitudinal est aussi plus élevé dans le bois de tension que dans le bois opposé.
bois de tension/ bois opposé / forêt tropicale humide / propriétés physiques et mécaniques
1. INTRODUCTION
When trees have to restore their verticality after some acci-dental leaning (or partial uprooting), they will produce a rather wide sector of reaction wood on the lower side of the stem for gymnosperms (compression wood), on the upper side for an-giosperms (tension wood) [2,3,19,25]. Due to the usual higher growth rate in the reaction wood sector, the total volume of re-action wood in a log can be significant [16, 33].
The role of reaction wood is to produce, through the mech-anism of growth strains, a reacting force on the upper or lower side of the stem very different than the force on the other side: a compressive force for the lower side of gymnosperms, a very high tensile force for the upper side of angiosperms, while there is a normal tensile force in the other cases. The value of this force is the product of four components:
(1) the area of the reacting sector, linked to the growth ring thickness,
(2) the specific gravity of the reaction wood linked to the pro-portion of fibres and the thickness of their cell walls, * Corresponding author: ruelle@nuagr1.agr.nagoya-u.ac.jp
(3) the specific modulus of elasticity of reaction wood (ratio between longitudinal Young’s modulus and specific grav-ity) mostly linked to microfibril angle (MFA) in the S2
layer of fibres,
(4) the maturation strain appearing in the last phase of di ffer-entiation (lignification) mostly linked both to MFA and the chemistry of cell wall maturation [1, 37, 38].
The occurrence of reaction wood can be assessed on the stand-ing tree by various methods based on the local release of growth strains at stem periphery. The strain (or displacement) resulting from this release is very different between the upper and the lower sector of the stem for trees restoring their verti-cality [2, 4, 13, 20, 25, 40].
Due to all these differences in wood genesis, the physical and mechanical properties of reaction wood can be very di ffer-ent from that of the wood on the opposite side (called opposite wood), thus leading to serious difficulties and drawbacks in the processing (sawing and drying) and use of lumber coming from these trees.
Things are quite clear in the case of compression wood [21, 33]: wider ring width, higher specific gravity, lower specific modulus of elasticity, higher longitudinal shrink-age, and lower transverse (radial and tangential) shrinkshrink-age, Article published by EDP Sciences and available at http://www.afs-journal.org or http://dx.doi.org/10.1051/forest:2007027
504 J. Ruelle et al.
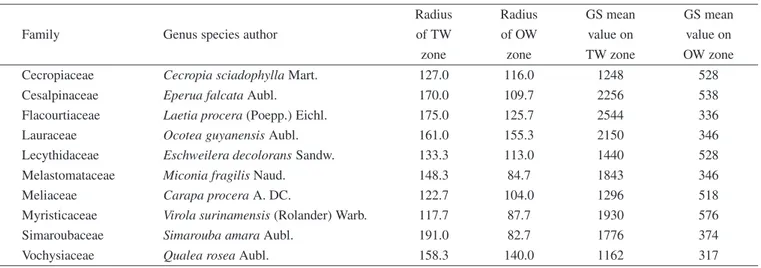
Table I. Radius and Growth Strains (×10−6) mean value of tension wood and opposite wood zone from the ten studied trees.
Radius Radius GS mean GS mean
Family Genus species author of TW of OW value on value on
zone zone TW zone OW zone
Cecropiaceae Cecropia sciadophylla Mart. 127.0 116.0 1248 528
Cesalpinaceae Eperua falcata Aubl. 170.0 109.7 2256 538
Flacourtiaceae Laetia procera (Poepp.) Eichl. 175.0 125.7 2544 336
Lauraceae Ocotea guyanensis Aubl. 161.0 155.3 2150 346
Lecythidaceae Eschweilera decolorans Sandw. 133.3 113.0 1440 528
Melastomataceae Miconia fragilis Naud. 148.3 84.7 1843 346
Meliaceae Carapa procera A. DC. 122.7 104.0 1296 518
Myristicaceae Virola surinamensis (Rolander) Warb. 117.7 87.7 1930 576
Simaroubaceae Simarouba amara Aubl. 191.0 82.7 1776 374
Vochysiaceae Qualea rosea Aubl. 158.3 140.0 1162 317
higher compressive strength. For tension wood, things are less known, and seem more diverse, like the anatomical character-istics (fibre with classical G-layer or not [15, 19, 30, 42]) There are few results in the literature about the properties of tension wood, most of the work are dedicated to anatomy and growth strains. Poplar [11, 17], Beech [11, 41], Eucalyptus [5, 34, 35] and Chestnut [13] were mainly studied. In all cases when this property was looked at, longitudinal shrinkage was found higher (around 1% instead of 0.2%) for tension wood. Ring width is often higher [25]. For specific gravity and Young’s modulus there seem to be a trend to higher values for tension wood [4, 13, 17]. For transverse shrinkage some authors have found higher values for tension wood [12].
Tropical species offers a very wide variety of angiosperms and many of them do not exhibit clear classical gelatinous layer in the tension wood fibre [15, 19, 30]. In order to have some insight in the diversity of situations among angiosperms trees, it was decided to select 10 trees presenting clear sec-tors of reaction wood, with the widest possible diversity and to measure the physical and mechanical properties in the ten-sion wood sector as compared to the opposite wood sector, on specimen corresponding to the standard methods.
2. MATERIAL AND METHODS 2.1. Selection of trees
All the trees were selected along the St Elie trail in the rainforest of French Guiana (Tab. I). The criteria for selection were: (i) medium sized trees (diameter at breast height around 30 cm) clearly in a phase of restoring verticality, (ii) trees from 10 different families so the 10 trees should present a wide range of diversity.
2.2. Growth strains estimation
The fact that trees were clearly in a phase of restoring verticality was verified in situ by mechanical measurements of growth strains
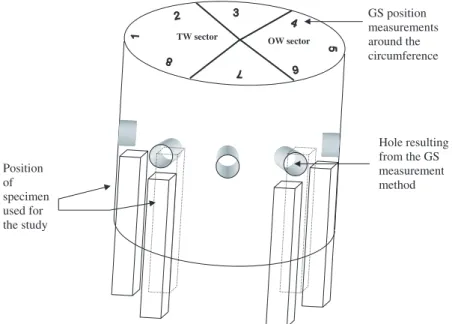
(GS) by the “single hole” method [1,20]. This method gives the value of the displacement between two pins hammered onto the trunk (after local debarking) at a 45 mm distance from each other. A hole (20 mm depth and 20 mm diameter) is drilled at the mid-point between the two pins. A displacement is measured (inµm) and converted into a strain using a calibration factor (9.6×10⁻⁴) corresponding to a calibra-tion made on Eperua Falcata Aubl [20]. Eight measures (every 45◦) were realized at breast height on each tree, position 1 corresponding to the upper side of the leaning trunk. After logging and cross cut-ting, radiuses from pith to tension side and opposite side were both measured. Only one tree, Ocotea guyanensis Aubl., did not present a clear eccentricity.
2.3. Sampling of the tested specimens
The part of the stem just below the eight measurement points was taken to the laboratory for mechanical testing. A green rod (dimen-sions: 500 mm in the longitudinal direction of wood fibres, 25 mm in the radial and tangential directions) was sawn below each GS measurement point, in the sapwood, as close as possible to the bark (Fig. 1). Dimensions of samples for each measurement are shown in Figure 2.
2.4. Radial growth rate
On all the trees (except one), we tried to estimate the differences in radial growth between tension and opposite zone in the last pe-riod of growth when tension wood was produced. From finely sanded discs we focused on a macroscopic indicator of growth rate (ring) clearly observable on the whole disc. According to species this in-dicator can be related to anatomical features, fibres or parenchyma bands densification, or simply to a density variation highlighted by sanding process. This pseudo ring width cannot be related to duration of growth. It was only used to compare the growth rate between the two sides in the period of active tension wood formation.
For each disc, near the GS measurement points, cambial distance to the located ring was measured perpendicularly to the cambium, so that we obtained eight local growth rates.
Figure 1. Localization of specimen (disk and rods) used for the experiments.
2.5. Air dry longitudinal modulus of elasticity
The longitudinal modulus of elasticity (MOE) of dry wood (spec-imen conditioned in a regulated chamber at 20◦C and 65% relative humidity) was measured using a vibration test [9, 10]. A prismatic beam of wood is lying on elastic supports and is hit with a hammer, while resulting acoustic vibrations are recorded with a microphone. The modes of natural vibration are related with elastic properties, green density and geometry of the beam. The longitudinal MOE can be deduced using a formula that takes the effect of shear into ac-count [7]. Dimensions of specimen are 20×20×380 mm3(RTL). With
this method used in routine by CIRAD, it was proved that the value of MOE obtained was not significantly different from the standard 4 points bending method used in the same lab. [9]. Other authors [22] have also proved that MOE measurement using eigen frequencies are very closely related to standard 4 points bending method.
The specific dry longitudinal MOE, that is equal to the dry longi-tudinal MOE divided by the dry specific gravity, was also calculated. This property is given in m2.s−2.
2.6. Standard air dry specific gravity
The air dry specific gravity was calculated on the rod (380× 20 × 20 mm3) used for MOE measurement by dividing the mass by the
volume in air-dry state at equilibrium in a regulated chamber with standard conditions (20◦C, 65% relative humidity). Weight was de-termined with scales (Denver Instrument TR-64, linearity:± 0.2 mg) and dimensions of the specimen used for the estimation of the speci-men volume, were measured with a caliper. It should be note that the equilibrium moisture content of the tropical woods used in this ex-periment was not always 12% due to the extractive content, although no specimen came from distinct heartwood (Eperua falcata Aubl. for example has a rather high resin content in all parts of the trunk).
Figure 2. Size of samples used for mechanical and physical proper-ties. CSCP: Crushing strength in compression parallel to the grain. CSSB: Crushing strength in static bending.
2.7. Crushing strength in compression parallel to the grain (ISO standard 3132:1975)
Before testing, all specimens were conditioned in a regulated chamber (20 ◦C, 65% relative humidity). Tests were performed on 20× 20 × 60 mm (RTL) specimens between two parallels steel plates on a MTS 20/M universal testing machine equipped with a 10 kN load cell. The load was applied parallel to the grain at a rate of 0.6 mm.min−1. Crushing strengthσ is determined as:
σ = Pmax
S0
(1)
Where Pmax is the maximum load in kN and S0 is the initial cross
506 J. Ruelle et al.
2.8. Crushing strength in static bending (ISO standard 3349:1975)
Before testing all specimens were conditioned in a regulated chamber (20◦C, 65% relative humidity). Dimensions of specimen are 20× 20 × 380 in mm (RTL). Four-points bending tests were per-formed and the crushing strength (also called Modulus of Rupture) is obtained as follow:
σ =3P(l2bh− a)2 (2)
Where P is the maximum load, l is the distance between the two bearing points, a the distance between the two loading points, b is the width and h the height of the specimen.
2.9. R, T, L Shrinkage
Longitudinal, radial and tangential shrinkage were calculated as the ratio of the dimensional variation in each direction between sat-urated and anhydrous states on the dimension in the satsat-urated state. Initial dimensions of the specimens are 20× 20 × 50 mm3(RTL) for
longitudinal shrinkage and 20× 20 × 10 mm3 (RTL) for radial and
tangential directions.
Dimensions were measured with a displacement transducer (Hei-denhain, instrumental error 1µm). Using a mark on the specimen for the positioning of the transducer it was possible with care, to have a precision on the successive measurements at different moisture con-tent better than 10µm so the variations in dimension have a precision better than 20µm which means 1/1000 for R and T directions and 4/10000 for L direction.
2.10. Statistical analysis
Results from laboratory measurements within and between indi-viduals were compared to highlight significant differences between tension and opposite wood samples. We used the Mann-Whitney U test to account for the significance of these results.
3. RESULTS
To simplify the interpretation in the rest of the discussion, we refer hereafter to each tree sampled by its species name. We note, however, that the points discussed are attributed to the in-dividual tree studied rather than to the species, as intraspecific variability for these properties remains to be studied.
3.1. Growth strains
For all the trees, except Qualea rosea Aubl., positions 8, 1, and 2 had a high tensile strain value (Fig. 3), thus corre-sponding to a usual sector of tension wood whose angular ex-pansion is usually slightly greater than 100◦ [25–27]. In the case of Qualea rosea Aubl., the angular expansion of the reac-tion wood sector was lower than 90˚ so, only posireac-tions 8 and 1 were tension wood. Mean values for tension wood proper-ties were obtained from specimen corresponding to these 8, 1, 2 positions (8, 1 for Qualea rosea Aubl.). Positions 3 and
7 often called lateral wood, were sometimes in the transition between tension and opposite wood, so there were no calcula-tion of mean values for lateral wood. In posicalcula-tions 4, 5 and 6 there was never high level of growth strains, as it is usual for opposite wood. Specimens from these 3 positions were used for calculation of mean values of opposite wood properties.
3.2. Radial growth rate
We were unable to measure this property on Carapa
pro-cera A. DC.
Radial growth rate was much higher (between 1.5 to 4 times higher) in 8 of the trees. But one of them, Ocotea guyanensis has no eccentricity and no difference in growth rate (Fig. 4 and Tab. II). These results confirm that hardwood trees also often use an eccentric growth with a higher new material ring width on one side [18] to promote efficient restoration of verticality. However there is some exception at tree level, thus this does not prove that the genus Ocotea guyanensis is not able to use growth eccentricity if needed.
3.3. Mechanical and physical properties
Results from the various measurements are presented in Ta-ble II.
Longitudinal MOE as well as specific MOE were higher in tension wood of 8 trees (between 16 to 54% higher, as spe-cific MOE), except in Cecropia sciadophylla Mart. and
Vi-rola surinamensis (Rolander) Warb. However these two trees
have a very high specific MOE both in tension and in op-posite wood. This difference is statistically significant for 7 trees. This increase in MOE was also observed in some tem-perate species [13, 17]. We can conclude that in this work specific MOE in always higher than 22.106m2.s−2in tension
wood. However we cannot conclude that MOE is higher in ten-sion wood because of our sampling consisting in one tree per species.
Among the 5 trees that show a significant difference for spe-cific gravity 2 have a lower spespe-cific gravity in tension wood. However the differences are rather low except for Virola
suri-namensis (Rolander) Warb (lower in tension wood), Qualea rosea and Ocotea guyanensis (higher in tension wood). In
pre-vious publications density was found higher in tension wood for poplar [17, 28].
Only one significant difference was found between ten-sion and opposite wood for flexure and compressive strength, for two different trees. There is no predominant tendency; sometimes tension wood is more resistant, sometimes oppo-site wood is more resistant.
Longitudinal shrinkage was often the most significantly dif-ferent property between tension and opposite wood, 4 to 7 times higher in tension wood for 7 species, but only less than 2 times higher for Simarouba amara Aubl., Eschweilera
deco-lorens Sandw. and Qualea rosea. This increase of L shrinkage
in tension wood was observed for a lot of species as chest-nut, poplar or eucalyptus [8, 13, 28]. This can cause serious
Figure 3. Circumferential variations in growth strain (GS) for some representative trees.
508 J. Ruel le et al .
Table II. Main characteristics means of the measured trees: Growth rate (mm), dry density (kg.m−3), modulus of elasticity of dry wood (MOE, MPa), specific modulus of elasticity of dry wood (MOE/density, m2.s−2), Crushing strength in bending and in compression (MPa), Tangential, radial and longitudinal shrinkage (%), tangential/radial shrinkage ratio (TS/RS)
and transversal+ radial shrinkage for opposite wood (OW) and tension wood (TW). Significant differences between opposite and reaction wood are indicated by * (P < 0.05). Tree Growth rate Dry longitudinal MOE Dry specific longitudinal MOE Air dry specific gravity Crushing strength Crushing strength in
(mm) (MPa) ×106m2.s−2 (kg.m−3) in flexion compression
(MPa) (MPa) T O T/O T O T/O T O T/O T O T/O T O T/O T O T/O Cecropia sciadophylla 34.7 22.0 1.58 13577 15169 0.90 * 30408 32671 0.93 * 0.45 0.46 0.96 61 76 0.80 53 40 1.31 Eperua falcata 29.3 12.7 2.3 * 20974 14588 1.44 * 25206 17561 1.44 * 0.83 0.83 1.00 128 117 1.10 61 42 1.43 Laetia procera 68.3 23.7 2.9 * 18242 14041 1.30 * 21958 17286 1.27 0.83 0.81 1.02 90 91 0.99 59 53 1.12 Ocotea guyanensis 33.7 29.7 1.1 17702 11465 1.54 * 28409 22267 1.28 * 0.62 0.51 1.21 * 102 93 1.09 56 57 0.97 Eschweilera decolorens 78.0 40.7 1.92 * 24441 19890 1.23 * 25589 21149 1.21 * 0.96 0.94 1.02 166 159 1.04 67 76 0.88 * Miconia fragilis 59.0 23.3 2.5 * 23073 19930 1.16 * 26039 21830 1.19 * 0.89 0.91 0.97 * 126 117 1.08 71 79 0.90 Carapa procera 19305 14927 1.29 25152 20421 1.23 0.77 0.73 1.05 * 103 111 0.93 56 50 1.11 Virola surinamensis 33.0 19.3 1.71 * 11152 13186 0.85 * 31378 33467 0.94 * 0.36 0.39 0.90 * 41 60 0.69 * 48 42 1.14 Simarouba amara 94.3 21.3 4.4 * 9508 8176 1.16 26904 23276 1.16 0.35 0.35 1.00 48 50 0.96 35 41 0.87 Qualea rosea 42.3 35.7 1.19 16398 11649 1.41 22005 18005 1.22 0.74 0.65 1.15 * 97 74 1.31 55 61 0.90
Longitudinal Shrinkage (LS) Tangential Shrinkage (TS) Radial Shrinkage (RS)
(%) (%) (%) TS/RS T O T/O T O T/O T O T/O T O T/O 0.39 0.11 3.57 * 10.39 10.08 1.03 3.59 3.57 1.01 2.89 2.83 1.02 1.05 0.24 4.34 * 5.46 7.35 0.74 * 1.55 2.43 0.64 * 3.53 3.02 1.17 1.22 0.18 6.93 * 13.61 9.23 1.47 4.60 4.84 0.95 2.96 1.91 1.55 0.75 0.16 4.78 * 8.29 6.39 1.30 * 2.53 2.75 0.92 3.27 2.32 1.41 * 0.15 0.11 1.42 7.88 7.71 1.02 3.14 3.14 1.00 2.51 2.46 1.02 1.04 0.19 5.38 * 12.38 9.61 1.29 * 4.49 5.36 0.84 2.76 1.79 1.54 * 0.33 0.00 * 7.50 7.15 1.05 4.63 5.02 0.92 1.62 1.42 1.14 0.06 0.01 10.44 13.79 9.09 1.52 * 5.26 3.57 1.47 * 2.62 2.55 1.03 0.42 0.23 1.81 * 7.42 5.55 1.34 1.99 1.99 1.00 3.73 2.79 1.34 * 0.34 0.30 1.16 8.71 7.12 1.22 3.74 3.08 1.21 * 2.33 2.32 1.01
problems in wood transformation (drying process) and for fur-ther uses (hygroscopic dimensional stability). Although these values, around 1%, are much lower than what is commonly observed on compression wood (up to 4 to 5%). But contrary to compression wood specific MOE of tension wood is always high.
Tangential shrinkage is always higher for tension wood, ex-cept for Eperua falcata, which has a very low tangential and radial shrinkage for a high density wood. The difference is sig-nificant only for 4 trees including Eperua. Radial shrinkage can be higher or lower in tension wood, with only 3 signifi-cant differences (one lower and two higher for tension wood). Shrinkage anisotropy (tangential shrinkage/ radial shrinkage) is always higher in tension wood, but in a significant way only for 3 trees. This can be another factor leading to lumber distor-tions during drying process for trees with a pronounced sector of tension wood.
4. DISCUSSION
Usually it is said that tension wood has a very low MFA, but there are few published results [2, 6, 14, 23, 36, 39] on MFA for angiosperms. Classical methods using pit apertures or io-dine crystals[6,24,32] were not successful in our case. Based on another sampling for Eperua falcata, Laetia procera Eichl. and Simarouba amara, a specific analysis of MFA was done by X-ray diffraction after a calibration using field-emission scan-ning electron microscopy images of fibre cell wall after delig-nification [31]. For the three species, tension wood had always very low MFA (below 10◦) while normal and opposite wood usually exhibit MFA between 15◦and 30◦.
Many authors also proved that chemical composition of ten-sion wood is different: lower lignin content, different ratio of lignin monomers [5, 29, 39, 42]. Moreover a species like
Epe-rua falcata has a rather high value of extractive content in the
sapwood that seems to be linked to the low value of tangential and radial shrinkage for this high specific gravity species.
From the results on gymnosperms and physical-mechanical models of wood behaviour, a low value for MFA should re-sult in (i) a high value of specific modulus of elasticity, (ii) a higher value of tangential and radial shrinkage, (iii) a low value of longitudinal shrinkage, (iv) a higher value in tensile growth strains. Apart from item (iv), this is not at all a general case in tension wood, the reverse is even true for longitudi-nal shrinkage. For this peculiar property, where the value is so high for tension wood as compared to usual values for normal wood and values for opposite wood, there can be some expla-nation in the model proposed by Yamamoto et al. [38] which exhibits a small growth of longitudinal shrinkage for very low MFA. But it cannot explain values as high as more than 1% found for Eperua falcata, Laetia procera and Miconia fragilis Naud. Same results were found for beech or poplar [11, 13], which can be related to the very peculiar behaviour of the G layer itself [11] maybe due to its chemical organization (crys-talline and amorphous zone of cellulose, differences in hemi-celluloses and lignin matrix). A higher tangential and radial
shrinkage for tension wood is surely also linked to this peculiar behaviour of G layer, or differences in chemical composition.
Most of the species studied has a higher value of specific MOE for tension wood. Again models and results for gym-nosperms suggest that for low MFA values, specific MOE should be rather high (around 30× 106m2.s−2), which is not
the case here for the trees from Eperua falcata and Laetia
pro-cera, species with G layer patterns. In the case of Virola and Cecropia trees the specific MOE is very high in the opposite
wood and a little lower but still very high in the tension wood. This should mean that MFA is very low all around the stem and that maturation strain is not strictly linked to MFA, but as much (or even more) to the chemical process of maturation.
Anyway, contrary to compression wood in softwoods, ten-sion wood in hardwoods seems to be much more diverse in its technological properties. This point reflects more diverse strategies in fibre differentiation. This means also that tension wood is not always or at least not as much a problem for wood processing and use than compression wood, depending on the tree or maybe the species. However there is a need for more investigations in this subject, for tropical species.
REFERENCES
[1] Almeras T., Thibaut A., Gril J., Effect of circumferential hetero-geneity of wood maturation strain, modulus of elasticity and ra-dial growth on the regulation of stem orientation in trees, Trees 19 (2005) 457–467.
[2] Archer R.R., Growth stresses and strains in trees, Springer-Verlag, Berlin Heidelberg New-York, 1986.
[3] Badia M.A., Constant T., Mothe F., Nepveu G., Tension wood oc-currence in three cultivars of Populus× euramericana. Part I: Inter-clonal and intra-tree variability of tension wood, Ann. For. Sci. 63 (2006) 23–30.
[4] Baillères H., Précontraintes de croissance et propriétés mécano-physiques de clones d’Eucalyptus (Pointe-Noire – Congo: hétérogénéités, corrélations et interprétations histologiques, Thèse en Sciences du Bois, Université de Bordeaux I, 1994.
[5] Baillères H., Chanson B., Fournier M., Tollier M.T., Monties B., Structure, composition chimique et retraits de maturation du bois chez les clones d’eucalyptus, Ann. Sci. For. 52 (1995) 157-172. [6] Barnett J.R., Cellulose microfibril angle in the cell wall of wood
fibres, Biol. Rev. 79 (2004) 461–472.
[7] Bordonné P.A., Module dynamique et frottement intérieur dans le bois mesurés sur poutres flottantes en vibrations naturelles, Wood Science thesis, Institut National Polytechnique de Lorraine, 1989. [8] Boyd J.D., Relationship between fibre morphology and shrinkage
of wood, Wood Sci. Technol. 11 (1977) 3–22.
[9] Brancheriau L., Bailleres H., Natural vibration analysis of clear wooden beams: a theoretical review, Wood Sci. Technol. 36 (2002) 345–365.
[10] Brancheriau L., Baillères H., Détienne P., Kronland R., Metzger B., Classifying xylophone bar materials by perceptual, signal process-ing and wood anatomy analysis, Ann. For. Sci. 63 (2006) 73–81. [11] Clair B., Thibaut B., Shrinkage of the gelatinous layer of poplar and
beech tension wood, IAWA J. 22 (2001) 121–131.
[12] Clair B., Jaouen G., Beauchêne J., Fournier M., Mapping radial, tan-gential and longitudinal shrinkages and its relation to tension wood
510 J. Ruelle et al.
in discs of the tropical tree Symphonia globulifera, Holzforschung 57 (2003) 665–671.
[13] Clair B., Ruelle J., Thibaut B., Relationship between growth stresses, mechano-physical properties and proportion of fibre with gelatinous layer in chestnut (Castanea Sativa Mill.), Holzforschung 57 (2003) 189–195.
[14] Clair B., Almeras T., Sugiyama J., Compression stress in opposite wood of angiosperms: observations in chestnut, mani and poplar, Ann. For. Sci. 63 (2006) 507–510.
[15] Clair B., Ruelle J., Beauchêne J., Prevost M.F., Fournier M., Tension wood and opposite wood in 21 tropical rainforest species. 1. About the presence of G layer, IAWA J. 27 (2006) 329–338. [16] Constant T., Mothe F., Badia M.A., Saint-André L., How to relate
the standing tree shape to internal wood characteristics: Proposal of an experimental method applied to poplar trees, Ann. For. Sci. 60 (2003) 371–378.
[17] Coutand C., Jeronimidis G., Chanson B., Loup C., Comparison of mechanical properties of tension and opposite wood in Populus, Wood Sci. Technol. 38 (2004) 11–24.
[18] Dadswell H.E., Wardrop A.B., What is reaction wood? Australian Forestry 13 (1949) 22–33.
[19] Fisher J.B., Stevenson J.W., Occurrence of reaction wood in branches of Dicotyledons and its role in tree architecture, Bot. Gaz. 142 (1981) 82-95.
[20] Fournier M., Chanson B., Thibaut B., Guitard D., Mesure des défor-mations résiduelles de croissance à la surface des arbres, en relation avec leur morphologie. Observation sur différentes espèces, Ann. Sci. For. 51 (1994) 249–266.
[21] Gindl W., Comparing Mechanical properties of normal and com-pression wood in Norway spruce: the role of lignin in comcom-pression parallel to the grain, Holzforschung 56 (2002) 395–401.
[22] Haines D.W., Leban J.M., Herbe C., Determination of Young’s modulus for spruce, fir and isotropic materials by the resonance flexure method with comparisons to static flexure and other dy-namic methods, Wood Sci. Technol. 30 (1996) 253–263.
[23] Hori R., Suzuki H., Kamiyama T., Sugiyama J., Variation of mi-crofibril angles and chemical composition: Implication for func-tional properties, J. Mater. Sci. lett. 22 (2003) 963–966.
[24] Huang C.L., Kutscha N.P., Leaf G.J., Megraw R.A., Comparison of microfibril angle measurement techniques, in: Proceedings of the IAWA/IUFRO international workshop on the Significance of Microfibril Angle to Wood quality, 1998, pp. 177–205.
[25] Jourez B., Le bois de tension 1. Définition et distribution dans l’arbre, Biotechnol. Agron. Soc. Environ. 1 (1997) 100–112. [26] Jourez B., Le bois de tension 2. Évaluation quantitative,
forma-tion et rôle dans l’arbre, Biotechnol. Agron. Soc. Environ. 1 (1997) 167–177.
[27] Jourez B., Riboux A., Leclercq A., Anatomical characteristics of tension wood and opposite wood in young inclined stems of poplar (Populus euramericana cv “Ghoy”), IAWA J. 22 (2001) 133–157. [28] Jourez B., Riboux A., Leclercq A., Comparison of basic density
and longitudinal shrinkage in tension wood and opposite wood in young stems of Populus euramericana cv. “Ghoy” when subjected to a gravitational stimulus, Can. J. For. Res. 31 (2001) 1676–1683. [29] Okuyama T., Takeda H., Yamamoto H., Yoshida M., Relation
be-tween growth stress and lignin concentration in the cell wall: Ultraviolet microscopic spectral analysis, J. Wood Sci. 44 (1998). [30] Onaka F., Studies on compression and tension wood, Wood
re-search, Bull. Wood Res. Inst., Kyoto Univ., Japan, 24 (1949) 1–88. [31] Ruelle J., Yamamoto H., Thibaut B., Growth stresses and cellulose structural parameters in tension and normal wood from three tropi-cal rainforest angiosperms species, Bioresource (2007) 235–251. [32] Senft J.F., Bendtsen B.A., Measuring microfibrillar angles using
light microscopy, Wood Fiber Sci. 17 (1985) 564–567.
[33] Timell T.E., Compression wood in gymnosperms, Springer-Verlag, Berlin Heidelberg, 1986.
[34] Washusen R., Ades P., Evans R., Ilic J., Vinden P., Relationships be-tween density, shrinkage, extractives content and microfibril angle in tension wood from three provenances of 10-year-old Eucalyptus
globulus Labill. Holzforschung 55 (2001) 176–182.
[35] Washusen R., Ilic J., Waugh G., The relationship between longi-tudinal growth strain and the occurrence of gelatinous fibers in 10 and 11-year-old Eucalyptus globulus Labill., Holz Roh- Werkst. 61 (2003) 299–303.
[36] Yamamoto H., Okuyama T., Yoshida M., Method of determining the mean microfibril angle of wood over a wide range by the improved Cave’s method, Mokuzai Gakkaishi 39 (1993) 118–125.
[37] Yamamoto H., Generation mechanism of growth stresses in wood cell walls: roles of lignin deposition and cellulose microfibril during cell wall maturation, Wood Sci. Technol. 22 (1998).
[38] Yamamoto H., Kojima Y., Okuyama T., Abasolo W.P., Gril J., Origin of the Biomechanical properties of wood related to the fine structure of the multi-layered cell wall, J. Biomech. Eng. 124 (2002) 432–440.
[39] Yoshida M., Ohta H., Yamamoto H., Okuyama T., Tensile growth stress and lignin distribution in the cell walls of yellow poplar,
Liriodendron tulipifera L., Trees 16 (2002) 457–464.
[40] Yoshida M., Okuyama T., Techniques for measuring growth stress on the xylem surface using strain and dial gauges, Holzforschung 56 (2002) 461–467.
[41] Yoshida M., Ikawa M., Kaneda K., Okuyama T., Stem tangential strain on the tension wood side of Fagus crenata saplings, J. Wood Sci. 49 (2003) 475–478.
[42] Yoshizawa N., Inami A., Miyake S., Ishiguri F., Yokota S., Anatomy and lignin distribution of reaction wood in two Magnolia species, Wood Sci. Technol. 34 (2000) 183–196.