HAL Id: hal-01520692
https://hal.archives-ouvertes.fr/hal-01520692
Submitted on 10 May 2017
HAL is a multi-disciplinary open access archive for the deposit and dissemination of sci-entific research documents, whether they are pub-lished or not. The documents may come from teaching and research institutions in France or abroad, or from public or private research centers.
L’archive ouverte pluridisciplinaire HAL, est destinée au dépôt et à la diffusion de documents scientifiques de niveau recherche, publiés ou non, émanant des établissements d’enseignement et de recherche français ou étrangers, des laboratoires publics ou privés.
High-Energy Resolution Fluorescence Detected X-Ray
Absorption Spectroscopy: A Powerful New Structural
Tool in Environmental Biogeochemistry Sciences
Olivier Proux, Eric Lahera, William Net, Isabelle Kieffer, Mauro Rovezzi,
Denis Testemale, Mohammed Irar, Sara Thomas, Antonio Aguilar-Tapia,
Elena Bazarkina, et al.
To cite this version:
Olivier Proux, Eric Lahera, William Net, Isabelle Kieffer, Mauro Rovezzi, et al.. High-Energy Res-olution Fluorescence Detected X-Ray Absorption Spectroscopy: A Powerful New Structural Tool in Environmental Biogeochemistry Sciences. Journal of Environmental Quality, Crop Science Society of America, 2017, Synchrotron radiation-based methods for environmental biogeochemistry, 46 (6), pp.1146-1157. �10.2134/jeq2017.01.0023�. �hal-01520692�
Synchrotron Radiation-Based Methods for Environmental Biogeochemistry
High-Energy Resolution Fluorescence Detected X-Ray Absorption
Spectroscopy: A Powerful New Structural Tool in Environmental
Biogeochemistry Sciences
Olivier Proux, Eric Lahera, William Del Net, Isabelle Kieffer, Mauro Rovezzi, Denis Testemale, Mohammed Irar, Sara Thomas, Antonio Aguilar-Tapia, Elena F. Bazarkina, Alain
Prat, Marie Tella, Mélanie Auffan, Jérôme Rose, and Jean-Louis Hazemann*
Supplemental material is available online for this article. O. Proux, E. Lahera, W. Del Net, I. Kieffer, and M. Rovezzi, Observatoire des Sciences de l’Univers de Grenoble (OSUG), UMS 832 CNRS, Univ. Grenoble Alpes, F-38041 Grenoble, France; D. Testemale, M. Irar, S. Thomas, A. Aguilar-Tapia, E.F. Bazarkina, A. Prat, and J.-L. Hazemann, Inst. Néel, UPR 2940 CNRS, Univ. Grenoble Alpes, F-38000 Grenoble, France; S. Thomas, Dep. of Civil and Environmental Engineering, Northwestern Univ., Evanston, IL 60208; S. Thomas, Laboratoire de Chimie et Biologie des Métaux (LCBM) UMR 5249 CNRS, CEA, Univ. Grenoble Alpes, F-38054 Grenoble, France; E.F. Bazarkina, Institute of Geology of Ore Deposits, Mineralogy, Petrography and Geochemistry, Russian Academy of Sciences, IGEM RAS, 119017 Moscow, Russia; M. Tella, Centre de Coopération Internationale en Recherche Agronomique pour le Développement (CIRAD), US 49 Analyze, TA B-49/01, F-34398 Montpellier Cedex 5, France; M. Auffan and J. Rose, Centre de Recherche et d’Enseignement de Géosciences de l’Environnement (CEREGE) UM34, UMR 7330, CNRS, Aix-Marseille Univ., IRD, Collège de France F-13545 Aix en Provence, France. Received 13 Jan. 2017. Accepted 3 Apr. 2017. *Corresponding authors ([email protected]). Assigned to Associate Editor Peter Kopittke.
Abbreviations: CAS, crystal analyzer spectrometer; ESRF, European Synchrotron Radiation Facility; EXAFS, extended X-ray absorption fine structure; HERFD, high-energy resolution fluorescence detected; LCF, linear combination fitting; PCA, principal component analysis; SDD, silicon-drift detector; SSD, solid-state detector; XANES, X-ray absorption near-edge structure; XAS, X-ray absorption spectroscopy; XES, X-ray emission spectroscopy.
Core Ideas
Study shows high-resolution spectroscopic data for an improved speciation determination. Speciation of trace elements down and below the µg.g-1 level is shown.
Measurements are made in vivo or at natural concentration.
ABSTRACT
The study of the speciation of highly diluted elements by X-ray absorption spectroscopy (XAS) is extremely challenging, especially in environmental biogeochemistry sciences. Here we present an innovative synchrotron spectroscopy technique: high-energy resolution fluorescence detected XAS (HERFD-XAS). With this approach, measurement of the XAS signal in fluorescence mode using a crystal analyzer spectrometer with a ~1-eV energy resolution helps to overcome restrictions on sample concentrations that can be typically measured with a solid-state detector. We briefly describe the method, from both an instrumental and spectroscopic point of view, and emphasize the effects of energy resolution on the XAS measurements. We then illustrate the positive impact of this technique in terms of detection limit with two examples dealing with Ce in ecologically relevant organisms and with Hg species in natural environments. The sharp and well-marked features of the HERFD–X-ray absorption near-edge structure spectra obtained enable us to determine unambiguously and with greater precision the speciation of the probed elements. This is a major technological advance, with strong benefits for the study of highly diluted elements using XAS. It also opens new possibilities to explore the speciation of a target chemical element at natural concentration levels, which is critical in the fields of environmental and biogeochemistry sciences.
Environmental biogeochemistry is a very large and diverse area of research that includes the works of biologists, toxicologists, geochemists, chemists, physicists, and others who aim to understand the interaction between a pollutant and a biotope. Such studies can be performed at different scales, from the macroscopic, microscopic, or nanoscopic (imaging techniques applied to the whole organism, organ, plant, etc.) levels to the atomic level. In this context,
synchrotron radiation techniques are very powerful, particularly to study the distribution (micro X-ray fluorescence imaging) and the chemical speciation (X-ray absorption spectroscopy, XAS) of trace metals or metalloids (Sarret et al., 2013; Kopittke et al., 2017). X-ray absorption spectroscopy probes the speciation of a target chemical element (i.e., its valence, composition, and structure of the coordination shells) and is widely used for this aim (Lombi et al., 2011).
One characteristic of XAS measurements in the field of environmental and biogeochemical sciences is that the probed element (e.g., pollutant or metal of the metalloprotein) is often diluted in the medium, even in synthetic samples, to be representative of realistic concentrations. In studies of nanoparticles, XAS signals contain both bulk and surface contributions, the latter being much smaller than the former, even for very small particles. Due to the fact that interactions between the nano‐object and its environment occur mainly at its surface, the surface signal is usually the most meaningful (e.g., for toxicology studies). Thus, XAS spectra should be of very good quality from both a statistical and spectroscopic point of view to detect weak surface changes coming from a small fraction of the sample.
The acquisition of high quality XAS spectra requires an optimized and stabilized photon flux on the sample combined with an efficient and highly sensitive detection system. Such detection has been performed in fluorescence mode for ~40 yr (Jaklevic et al., 1977). Fluorescence detection needs to be performed using an energy-resolved detector to minimize the contribution of the undesired photons, mainly elastic and inelastic scattering photons and photons produced by fluorescence of other chemical elements. On most of XAS beamlines, such detection is performed using a solid-state detector (SSD) or silicon-drift detector (SDD), with a typical energy resolution ~150 to 300 eV. Such detectors are very useful and efficient for three main reasons. First, the energy of the fluorescence photons of interest can be changed quickly and easily. Second, the energy resolution is often low enough to sort the different types of photons cited above. Third, the counting rate can be extended to ~106 counts s−1, with the appropriate electronic and synchrotron photon bunch frequency. However, with such detectors, the intrinsic detection limit comes mainly from the overlap of elastic and inelastic scattering events with the measured signal (Hazemann et al., 2009; Heald, 2015). The state-of-the-art detection limit with an SSD is ~10 to 100 µg.g-1 in weight or <1 mmol L−1. As an illustration, a compilation of concentration limits for XAS measurements in bioenvironmental science fields, as reported in the literature and performed on the BM30b beamline at the European Synchrotron Radiation Facility (ESRF, Grenoble, France), is indicated in Supplemental Fig. S1.
One way to overcome these limitations is to use a detection system with a better energy resolution, such as a crystal analyzer spectrometer (CAS). We will detail in this paper why and how XAS studies of diluted elements or nanoparticles can be particularly improved using such an efficient detector.
MATERIALS AND METHODS
Solid-State Detector vs. Crystal Analyzer Spectrometer
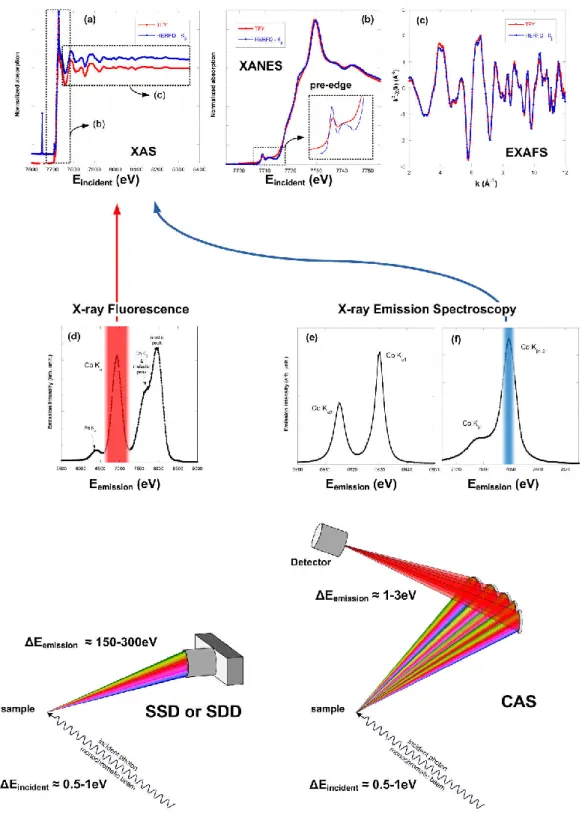
The schematic process of the fluorescence measurements by both systems is described in
Fig. 1. With SSD (or SDD) technology, the photons are collected and later electronically separated by energy (e.g., Fig. 1d). Technically, the energy resolution is limited by (i) the Fano factor (the energy loss by the photons to create an electron-hole pair is not purely statistical), (ii) the incomplete collection of the charge produced in the depletion zone, and (iii) electronic considerations such as the parasitic noise and capacitance at the input of the charge-sensitive preamplifier, and the speed of the processing electronics (e.g., the shaping time).
The typical energy bandwidth thus ranges between E = 120 and 300 eV, depending on detector quality and shaping time (the faster the time, the higher the counting rate but the lower the resolution). The fluorescence photons of interest (highlighted in red in Fig. 1d) on the x-ray fluorescence spectrum are then integrated within an energy region of interest. The variation of this integrated intensity with the incident energy gives rise to the total fluorescence yield XAS spectrum (red curve in Fig. 1a).
With a CAS, the photons are first optically selected in energy (Bragg scattering) and later collected by a detector that does not necessarily need to be energy resolved. Compare with SSD, the optical adjustment of CAS is generally more time consuming, and the measurements of XAS spectra takes more time. The energy resolution of a Johann’s type CAS (Supplemental Fig. S2) is limited by (Collart et al., 2005; Hazemann et al., 2009):
1. The Johann’s geometry aberration. Indeed, only the center of the crystal is on the Rowland’s circle, leading to an angular dispersion in the vertical plane and, consequently, an energy dispersion (Supplemental Fig. S3). This aberration is all the more limited when the Bragg angle is close to 90 and/or the radius of curvature is large. In most cases, this is the true limiting factor for the total energy resolution.
Consequently, the choice of crystals used for the analysis of a given fluorescence peak must take into account this characteristic (optimized choice of crystal analyzers corresponding to a large number of elements and their associated emission line are given on Supplemental Tables S2 and S3). The emission energy range that can be covered by one crystal is consequently rather limited;
2. The intrinsic properties of the crystal reflection, the so-called Darwin width (G. W. Brindley,1933); 3. The imperfections of the bent crystal due to the bending process (Rovezzi et al., 2017).
Thus, for a CAS equipped with spherically bent crystal analyzers with a radius of curvature of 1-m range, the energy bandwidth typically ranges from 0.2 to 2 eV. This value is then smaller than the core-hole lifetime of the measured fluorescence line (Supplemental Tables S2 and S3): X-ray emission spectroscopy (XES) measurements can be achieved. Moreover, by integrating only a narrow region of the fluorescence line of interest (as shown in Fig. 1f for a fraction of the K1,3 line), the high-energy resolution fluorescence detected XAS (HERFD-XAS) can be
measured (blue curve in Fig. 1a).
The main advantages of measuring fluorescence-XAS with CAS instead of SSD (or SDD) are:
1. XAS (including extended x-ray absorption fine structure [EXAFS] and X-ray absorption near edge structure [XANES]) measurements can be achieved on complex and/or diluted systems where the detection limit is determined by the fluorescence of the main constituents of the matrix and/or the scattering signals; 2. Energy resolution of HERFD XANES spectra can be sharper than what could be achieved conventionally (Hämäläinen et al., 1991; de Groot et al., 2002; Bauer, 2014), which improves the accuracy of XANES quantitative analyses;
3. Energy position of the fluorescence lines (and especially the K ones for the K-edges) is sensitive to the spin state (K1,3) and to the ligands (K2,5 and its satellite lines) of the probed element. The XAS spectra
obtained by measuring these lines are then spin or ligand sensitive (Bergmann et al., 1999; Rovezzi and Glatzel, 2014),
4. Other spectroscopic techniques such as XES can be performed. For example, valence-to-core XES allows discrimination between the different ligands in the first coordination sphere of the probed element (Safonov et al., 2006; Bauer, 2014; Gallo and Glatzel, 2014).
Fig. 1. Principle of X-ray absorption spectroscopy (XAS)-fluorescence measurement using solid-state detector (SSD) and crystal analyzer spectrometer (CAS). Spectra correspond to the analysis of a Co3O4 sample
with a 30-element Ge SSD (total fluorescence yield, red spectra) and a CAS using five Ge(444) crystals optimized around the Co K1,3 fluorescence line (high-energy resolution fluorescence detected [HERFD], blue spectra;
Bordage et al., 2015). (a) XAS spectra. (b) X-ray absorption near-edge structure (XANES) spectra; insert corresponds to a zoom on the pre-edge region. (c) extended X-ray absorption fine structure (EXAFS) spectra
k2(k). (d) Fluorescence spectra measured with the SSD and CAS. (e) K
1 and K2 X-ray emission spectroscopy
(XES) spectra measured with the CAS using five Si(440) crystals. (f) K1,3 fluorescence line and its K satellite
X-ray Spectroscopic Techniques
Detailed explanations of the XAS and XES theories fall outside the scope of this paper and can be found in numerous recent reviews, on core-level spectroscopy generality (de Groot and Kotani, 2008), XANES (Henderson et al., 2014; Joly and Grenier, 2016), EXAFS (Newville, 2014), XAS (Rehr and Albers, 2000; Ortega et al., 2012; Milne et al., 2014), XES (DeBeer and Bergmann, 2016), and HERFD (Bauer, 2014; Kowalska et al., 2016) applied to bioionorganic chemistry, and applications in environmental sciences (Gräfe et al., 2014). We will briefly recall the main principles of the core-level spectroscopy techniques with special attention to effects that can be better analyzed with CAS.
An X-ray interacts with the core electrons of atoms and, depending on its energy, can be absorbed by them through the photo-electric effect. The electrons can be excited to an upper empty electronic level or, if the X-ray energy is higher than the binding energy of the considered electron, to a free state as a photo-electron. The direct consequence of this excitation process is the creation of a core hole on the electron’s initial level and a jump of the X-ray absorption when increasing the incident X-ray energy around the binding energy of an electron, the so-called absorption edge.
The probability of this event is the absorption cross-section, which depends on the energy of the incident X-ray photon, the considered element, and the electronic level: element, edge (E).
The subsequent relaxation process gives rise to the emission of either fluorescence photons or Auger electrons. When the probed element is diluted in its matrix, the total fluorescence yield is considered to be proportional to element, edge (E) (Jaklevic et al., 1977).
The absorption cross-section presents a jump around the binding energy (Fig. 1a). The energy position of this absorption edge is characteristic of a given element and the considered electronic level. The probed element can then be precisely targeted. The absorption cross-section evolution versus energy can be divided in two areas. The XANES area is defined around the edge (Fig. 1b); the EXAFS area is defined beyond the edge (Fig. 1c).
The photo-electron emitted by the absorbing atom can be scattered by the electronic potentials of the neighboring atoms. The interference between the incident wave (linked to the outgoing photo-electron) and the scattered one induces modulations and oscillations of the absorption cross-section. The EXAFS signal is the oscillating part of the absorption signal above the edge, dominated by the single scattering events. It gives information on the local atomic order around the probed absorbing element (number, distance, and nature of the neighbors). The mean free path of the photo-electron being limited to few Å (roughly up to 10 Å in the considered energy area), the EXAFS information will be limited to the local order around the central atom.
In the XANES energy range, when the incident photon energy is slightly higher than the binding energy of the core level, modulation of the absorption cross-section will occur, as in the EXAFS region, but the multiple scattering events will contribute strongly to the spectrum. X-ray absorption near-edge structure can then provide information on the site geometry of the probed element. In addition, the spectrum can present well-marked peaks characteristic of electronic transitions from the core hole excited state to empty states. X-ray absorption near-edge structure can then also provide information on the electronic structure of the probed element. The intrinsic spectroscopic limitation of this technique comes from the core hole, which can have a large lifetime and can thus induce a broadening of the peak. A way to overcome this broadening is to perform the XANES measurement in the fluorescence mode and to measure the fluorescence line intensity with an energy resolution below the core-hole
lifetime broadening of the absorption edge. This is typically the case when using a CAS, and the measurement is then called HERFD XANES (Hämäläinen et al., 1991).
Another interesting energy region is the lower side of the XANES, the so-called pre-edge region (inset of Fig. 1c). Resonant structures (pre-edge peaks) may appear in this region, which are strongly sensitive to the electronic structure of the absorbing site. The analysis of such features permits the extraction of information on the spin or oxidation state, geometry, and type of ligand. The pre-edge features for K-edge XANES of 3d transition metals have been studied in detail (Westre et al., 1997; Yamamoto, 2008; de Groot et al., 2009; Cabaret et al., 2010).
In addition to HERFD-XAS, the use of a CAS permits performing XES measurements. Non resonant XES consists of scanning the emitted fluorescence with a CAS at a fixed incoming X-ray energy, above an absorption edge. X-ray emission spectroscopy also permits probing the local electronic structure of the absorbing element and has been used extensively (Bergmann and Glatzel, 2009; Glatzel and Juhin, 2013). With respect to XANES, XES probes occupied valence electrons (directly or indirectly) and are more sensitive to the local charge density. Depending on the selected transitions, XES is divided into two main regions: core-to-core (e.g., K1,2 or K1,3) and valence-to-core (e.g., K2,5). In the example of K emission lines
of 3d transition metals, core-to-core XES permits the evolution of the local spin or oxidation state to be followed and may be used in turn to collect oxidation state-selective EXAFS (Glatzel et al., 2002) or XANES (Bordage et al., 2015). In addition, valence-to-core XES is more sensitive to metal-ligand mixed valence states and has been employed in chemistry to distinguish between ligands of light elements (Eeckhout et al., 2009). Such sensitivity permits in turn to collect valence-selective XAS (Hall et al., 2014).
High-Energy Resolution Fluorescence Detected XAS
We previously mentioned that measuring the fluorescence line intensity with an energy resolution around the core-hole linewidths, that is 1 to 5 eV, allows HERFD-XANES to be obtained (i.e., spectra showing sharper features than conventional ones; Hämäläinen et al., 1991).
This sharpening effect has been demonstrated by de Groot et al. (2002) by analyzing the resonant X-ray emission spectrum of Pt-L1 (2p3/2–3d5/2) and applied (e.g., by Swarbrick et al.,
2009, for analysis at the Pb LIII–edge). Below are individual comparisons of the different
widths of the energy levels involved in the absorption process, detailed here for the LIII–edge
(with the L1 emission line).
In conventional XAS, for a LIII absorption edge, the final state has a 2p3/2 core hole with a
conv core-hole lifetime.
In HERFD-XAS, the L1 fluorescence line corresponds to 3d (the final state) to 2p3/2
transition (the intermediate state). The apparent core-hole lifetime broadening of the HERFD measurement, app, is then given by:
Γ . = 1 1 Γ .+
1 Γ .
where int and fin are the intermediate (2p3/2 for L1) and final state (3d for L1) core-hole
S3) for several elements at their K-edge (resp. LIII). The improvement of the HERFD-XANES
spectral resolution compared with conventional spectra is a direct consequence of the difference between these final-state widths. The two examples presented below will deal with Ce and Hg LIII–edge analysis. app are calculated to 0.72 and 2.28 eV, respectively, with
core-hole lifetime sof the probed level 2p3/2 equal to 3.19 and 5.71 eV. All the features
characteristics of electronic transitions (pre-edge, edge, or after-edge peaks) measured in the XANES are directly affected by the core-hole lifetime broadening. In HERFD-XANES, such features are then detected with a better energy resolution: a two- to fourfold improvement can be reached experimentally.
In the EXAFS region, the core-hole lifetime broadening also affects the amplitude of the oscillations through the mean free path (or lifetime) of the photo-electron, which includes both inelastic scattering of this electron and the lifetime of the core hole (Rehr and Albers, 2000). This effect is especially important for high Z elements studied at their K-edge and can be corrected using spectral deconvolution (Fister et al., 2007). For the elements that can be probed with a CAS, the effects is very limited, even indistinguishable (Fig. 1c). A comparison of XAS measurements on Cu and Pd foils performed with monochromators with different energy resolution showed that the EXAFS amplitudes, as described by the amplitude reduction factor
2 0
S
, are comparable (Kelly et al., 2009). In a first approximation, the EXAFS measurements with CAS do not significantly change the signal compared with the conventional measurement.
Instrumentation
Among the different possible geometries, the most frequently encountered on synchrotron beamlines are the Johann (1931), Johansson (1933), and von Hámos (1932). The technical requirements to perform a high-energy resolution fluorescence measurement are the
following: (i) at least one crystal analyzer in Bragg condition with respect to the energy of the photons of interest and (ii) a detector that collects the diffracted photons. Both geometries are in reflection mode (Bragg type; i.e., suitable for low-energy X-ray studies).
In the first case, the sample, the crystal, and the detector are positioned on a circle (the Rowland circle). The crystal is spherically bent, with its radius of curvature equal to the diameter of the Rowland circle. When the crystal is close to backscattering, the geometric errors are very small; the whole crystal surface meets Bragg diffraction conditions for a given energy and the diffracted photons are focused on the detector. The crystal can be considered as a monochromator. During an XES spectrum acquisition, the crystal and the detector need to be moved simultaneously, accordingly to the Rowland circle conditions.
In the second case, the shape of the crystal is no longer spherical but flat, and the Bragg angle changes depending on the position of the considered X-ray on the crystal surface. The crystal can be considered then as a polychromator. The diffracted photons are no longer focused on a single point but dispersed on a surface. The use of a two-dimensional detector enables the whole energy spectrum of the emitted photons to be obtained (i.e., a XES spectrum in “one shot”).
The HERFD measurements can also be achieved using transmission-type (Laue-type) curved crystal spectrometers linked to a large-area detector. This geometry is suitable for high-energy photons, above ~20 keV. Recently, using a Laue-type DuMond spectrometer (Szlachetko et al., 2013), energy resolutions of 2.8 eV for the Mo K1 X-ray line (17.479 keV) and 17.1 eV for the Gd K1 X-ray line (42.996 keV) have been obtained. These values are smaller than the core-hole lifetime of the corresponding measured absorption edge (4.52 eV for Mo, 22.3 eV for Gd).
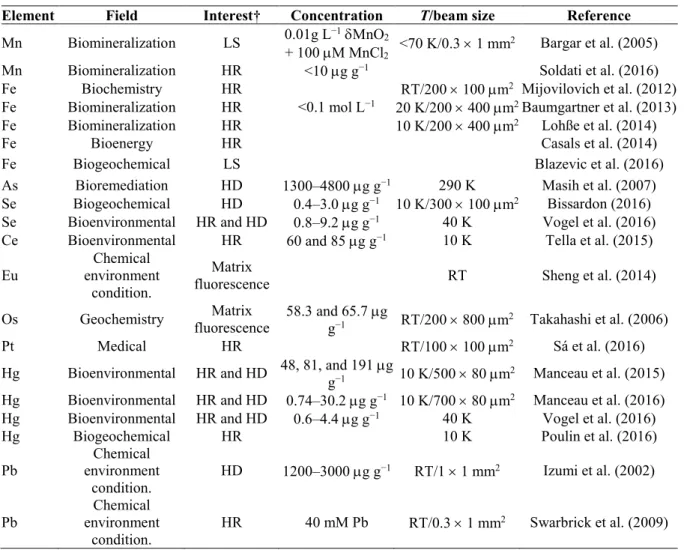
On the BM30b beamline (ESRF), we developed a CAS in the Johann geometry (Hazemann et al., 2009; Llorens et al., 2012), this geometry being more adapted to an XAS beamline than the von Hámos one (technical details on this CAS can be found in the Supplemental Material). Such a geometry is now often used on several synchrotron beamlines (Supplemental Table S1) from the pioneering spectrometers developed 20 yr ago (Stojanoff et al., 1992; Bergmann and Cramer, 1998). The growing number of papers in bioenvironmental and geochemistry sciences containing HERFD-XAS results follows this rise. A nonexhaustive review of references in bioenvironment and geochemistry sciences using XAS-CAS clearly exhibits a significant increase (Table 1): only five publications were found between 2002 and 2009, but the number rose to 13 between 2012 and 2016, illustrating the interest in the method and its performance.
Sample Preparation and Environment for Bioenvironment Studies using CAS
X-ray absorption spectroscopy (conventional or HERFD) and XES techniques are sensitive to element speciation. Two obvious points need then to be addressed when preparing these kinds of measurements.
First, the samples must be prepared without modifying the speciation of the target element. One of the most efficient ways to achieve this is to analyze the sample in its hydrated state. This preserves the chemical speciation of the probed element by keeping the water molecules inside the studied structure. Great care must be taken between the sampling and the analysis. The sample can then be kept in a hydrated frozen state (Sarret et al., 2013). To prevent damaging the sample (especially for biological components), the cooling process can be done using isopentane cooled down by liquid nitrogen (Luster and Finlay, 2006). Furthermore, the homogeneity of the sample, with respect to beam size, is key to good-quality measurement, whatever the XAS acquisition mode. Nonhomogeneous samples will give noisier spectra than homogeneous ones.
Second, the sample has to be preserved as much as possible from radiation damage during measurements. The effects of radiation damages of samples is the same for any XANES measurement mode (conventional or HERFD), but as the characteristic features of the XANES can be more marked in the HERFD mode, the consequences of radiation damages on the XANES shape may appear enhanced. As an example, we present on Supplemental Fig. S5 HERFD and conventional XANES spectra acquired simultaneously on the same sample position, a Pt/Al2O3 catalyst powder (Gorczyca et al., 2014). The increase of the intense peak
after the edge (the so-called white line) seems characteristic of the oxidation of the Pt with the beam. The relative evolution of the white-line height is more marked for HERFD XANES than for the conventional XANES.
Acquiring the data at low temperature strongly reduces the spurious effects induced by the X-ray beam. Furthermore, reducing the thermal motion improves the EXAFS data quality. A way to fulfill these conditions is to perform the acquisition on frozen samples placed in an appropriate cryostat (liquid nitrogen or, even better, liquid helium temperature). Another way to avoid radiation damage is to quantify the time necessary to observe a difference between spectra by doing short-time spectra centered on the edge-energy area (Sarret et al., 2013). This time is then the time limit before observing the effects of radiation damage. It is a function of the temperature, the photons’ brightness on the sample, and the nature of the sample. The spectrum’s duration should then be shorter than the time limit. If several acquisitions are necessary (e.g., to improve the data quality), the position of the beam on the sample will be moved between each scan to probe an untouched area of the sample.
RESULTS
HERFD and Bioenvironment: A Tool to Study Diluted Elements
The main parameter that limits the ability to perform XAS experiments on diluted elements in optimal conditions may arise from the matrix or the bearing phase. When the probed element is diluted in a soil (which can contain clays, silicates, and iron or manganese oxides), fluorescence signals delivered by the main constituents of this matrix can saturate a SSD, even with the use of appropriate filters. Moreover, in some cases, the fluorescence peaks of some matrix constituents can be too close in energy to the fluorescence peak of the targeted element to be discriminated by the SSD. When the probed element is diluted in a liquid, a plant, or more generally light matter, the limitation comes from the scattered beams. Llorens et al. (2012) studied bromide aqueous solutions at different concentrations to have an idea of the intrinsic XAS concentration limit of the SSD. Here, the limitation is given by a partial overlap of the measured signal (Br K fluorescence) with the low-energy tail of scattered beams (elastic or
inelastic scattering). Using the rule that the signal of interest should be three times the unwanted signal, an intrinsic limit of XAS measurement using SSD can been estimated to 23 µg.g-1 for Br in solution.
With the emergence of CAS on XAS beamlines, a set of recent publications demonstrates the advantages of this new technique. The corresponding concentrations of the elements investigated are given in Table 1. In the field of biogeochemistry, Bissardon (2016) studied the contribution of selenium in cartilage at in vivo concentrations, which are below µg.g-1 or even a few hundreds of ng.g-1. Similarly, Manceau et al. (2016) analyzed the chemical form of Hg in human hair down to 0.5 µg.g-1, and Vogel et al. (2016) explored the chemical form of both
Se and Hg in sewage sludge down to 0.6 and 0.8 µg.g-1, respectively. These studies would not have been possible with a conventional XAS measurement.
HERFD and EXAFS Analysis
In most cases (and in all literature found on the subject in bioenvironmental studies), the interest of CAS is focused on XANES studies and not on EXAFS. However, EXAFS analysis can also benefit from high-energy resolution fluorescence measurement.
When the characteristic emission line of the probed element is very close to those of other elements located in the sample, it is difficult to perform EXAFS analysis with good measurement statistics using a SSD. In this case, the background of the EXAFS spectrum (due to the other elements) is very high compared with the edge jump, especially when the element of interest is diluted. Using a CAS, the different emission lines can be precisely separated, and the EXAFS measurement is possible with a background close to 0. This method was used by Sheng et al. (2014) to define the Eu interaction with -MnO2.
The problem is similar when the element of interest is diluted in a light matrix (water, biological matrix, etc.). The background signal when measuring the spectrum by an SSD is not dominated by any fluorescence but by the low-energy tail of the Compton peak (Llorens et al., 2012). Like the previous point, the use of a CAS provides a very low background for the EXAFS measurement on diluted or ultra-diluted elements.
Energy position of emission lines can change for a given element, depending on its valence state. Measurement with EXAFS (as well as XANES) can exploit this change to obtain valence-sensitive spectra, which is useful in the case of mixed-valence compounds. Grush et al. (1995) demonstrated the interest of this selectivity for EXAFS measurements on Mn compounds (mixed Mn2+ and Mn3+ compounds). Fe2+ and Fe3+ species were probed in Prussian Blue
(Glatzel et al., 2002). Lambertz et al. (2014) probed the two Fe sites in an Fe-rich hydrogenase enzyme. Kühn et al. (2014) studied Co nanoparticles where the Co0 core is protected by a Co-based shell.
Table 1. Example of high-energy resolution fluorescence detected (HERFD)-X-ray absorption spectroscopy (XAS) publications in the field of environmental biogeochemistry sciences. The elemental concentrations are given in g g−1 or mol; both the temperature (T) and beam size on the sample are indicated as well.
Element Field Interest† Concentration T/beam size Reference
Mn Biomineralization LS 0.01g L
−1 MnO 2
+ 100 M MnCl2 <70 K/0.3 1 mm
2 Bargar et al. (2005)
Mn Biomineralization HR <10 g g−1 Soldati et al. (2016)
Fe Biochemistry HR RT/200 100 m2 Mijovilovich et al. (2012)
Fe Biomineralization HR <0.1 mol L−1 20 K/200 400 m2Baumgartner et al. (2013)
Fe Biomineralization HR 10 K/200 400 m2 Lohße et al. (2014)
Fe Bioenergy HR Casals et al. (2014)
Fe Biogeochemical LS Blazevic et al. (2016)
As Bioremediation HD 1300–4800 g g−1 290 K Masih et al. (2007)
Se Biogeochemical HD 0.4–3.0 g g−1 10 K/300 100 m2 Bissardon (2016)
Se Bioenvironmental HR and HD 0.8–9.2 g g−1 40 K Vogel et al. (2016)
Ce Bioenvironmental HR 60 and 85 g g−1 10 K Tella et al. (2015)
Eu
Chemical environment
condition.
Matrix
fluorescence RT Sheng et al. (2014)
Os Geochemistry Matrix
fluorescence
58.3 and 65.7 g
g−1 RT/200 800 m2 Takahashi et al. (2006)
Pt Medical HR RT/100 100 m2 Sá et al. (2016)
Hg Bioenvironmental HR and HD 48, 81, and 191 g
g−1 10 K/500 80 m2 Manceau et al. (2015)
Hg Bioenvironmental HR and HD 0.74–30.2 g g−1 10 K/700 80 m2 Manceau et al. (2016)
Hg Bioenvironmental HR and HD 0.6–4.4 g g−1 40 K Vogel et al. (2016)
Hg Biogeochemical HR 10 K Poulin et al. (2016)
Pb Chemical environment condition. HD 1200–3000 g g−1 RT/1 1 mm2 Izumi et al. (2002) Pb Chemical environment condition. HR 40 mM Pb RT/0.3 1 mm2 Swarbrick et al. (2009)
† LS, ligands sensitivity; HD, high dilution; HR, high resolution (HERFD).
HERFD and Bioenvironment: High-Resolution XANES Studies
The use of CAS enables the obtainment of a HERFD-XANES signal with a spectral resolution much sharper than what could be conventionally achieved. This possibility is of great interest in environmental biogeochemistry because (i) the differences between spectra are often subtle and (ii) the improved resolution gives a more precise discrimination of the local structure around the absorbing atom. This possibility was, for example, fully exploited at the Fe K-edge probing the Fe K1,3 fluorescence line to study biomineralization processes
(Baumgartner et al., 2013), to study magnetite nanoparticle evolution during conversion of biomass (Casals et al., 2014), at the Ce LIII edge to characterize the behavior of cerium oxide
nanoparticles in aquatic mesocosms (see below; Tella et al., 2015), or at the Hg LIII edge to
determine which chemical forms of Hg are present in human hair (Manceau et al., 2016). To highlight in more detail this real step forward, XANES measurements in conventional methods
(transmission or total fluorescence yield measurement) and in HERFD are presented below to ascertain the valence state of Ce, in the case of biotransformation of CeO2 nanoparticles, and
the speciation of Hg bound to sulfur. The consequence of this improved energy resolution are also of great importance when the experimental spectra are compared with calculated ones (Swarbrick et al., 2009; Mijovilovich et al., 2012). We will quantify here the improvement in the speciation determination when analyzing the XANES spectra by principal component analysis (PCA) and linear combination fitting (LCF), as used, for example, to study Fe biomineralization (Baumgartner et al., 2013) or Hg speciation in sewage sludge (Vogel et al., 2016).
Cerium Valence Determination
In many studies, the determination of oxidation state between CeIV/CeIII or the ratio is of crucial importance in particular for its bioavailability and its toxicity. Indeed CeO2 is a strong
oxidant due to a high CeIV to CeIII redox potential. Such high oxidation power directly or
indirectly can create oxidative stress for living organisms and cells. Cerium oxide nanoparticles’ interactions with organisms and biological media have been particularly investigated, such as with human cells (Auffan et al., 2009), biomolecules (Rollin-Genetet et al., 2015), microorganisms (Zeyons et al., 2009; Ma et al., 2013; Collin et al., 2014), plants (López-Moreno et al., 2010; Zhang et al., 2012; Hong et al., 2014), mollusks (Tella et al., 2014), and mussels (Garaud et al., 2016). In these studies, the reduction of Ce4+ to Ce3+ in CeO2
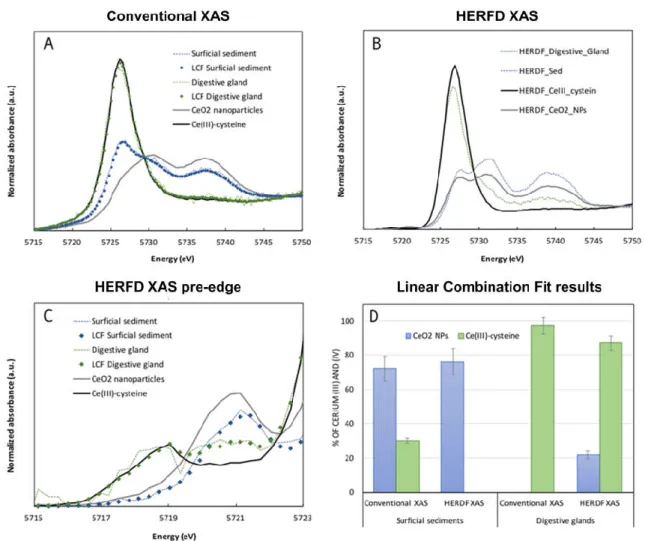
nanoparticles was probed by conventional XANES spectroscopy. Speciation quantification was in most cases based on linear combination of CeO2 and Ce3+ reference spectra (Fig. 2a).
For example, for the study of CeO2 nanoparticles interacting with human dermal fibroblasts
(Auffan et al., 2009), the shoulder which appears on the XANES spectra at 5724 eV, was attributed to Ce3+, and the quantification led to a Ce3+ contribution of 8 2%. However, with
conventional XANES, the shoulder at 5724 eV can be attributed either to Ce3+ single absorption jump, corresponding to the 2p3/2 (4f1) 5d electronic transition, or crystal field splitting into
eg and t2g for Ce4+O2 particles.
High-energy resolution fluorescence detected XANES was used in a recent study (Tella et al., 2015) addressing the environmental impact, (bio)distribution, and (bio)transformation of nano-CeO2 in realistic exposure conditions. This required the development of an adapted
experimental strategy based on indoor aquatic mesocosms that virtually mimic aquatic ecosystems (Auffan et al., 2014; Tella et al., 2014). Over 4 wk, the transfer, redox transformation, and impacts of 1-mg L−1 CeO2 nanoparticles were determined respecting an
ecologically relevant mollusc (Planorbarius corneus) living in a pond environment. Over time, CeO2 nanoparticles tend to homo- and heteroaggregate and to accumulate on surficial
sediments, where they are available to interact with benthic grazers as P. corneus. A transitory oxidative stress was observed in P. corneus after 2 wk of exposure (lipid peroxidation and increase in the antioxidant defense capacity). By combining X-ray tomography and laser ablation inductively coupled plasma mass spectrometry (ICP-MS), Ce was localized in the digestive gland of benthic organisms, where a strong biotransformation of the CeO2
nanoparticles occurred. Using LCF of the pre-edge area of the HERFD-XANES spectra, the authors quantified that 81 8% of CeIV was reduced into CeIII in the digestive gland (and 22 2% remained CeIV). However, in the surficial sediment, no contribution of CeIII improved the
LCF residue. This led to the conclusion that the changes in the HERDF spectra observed were not associated with the reduction of CeIV but with changes in the crystallite size of CeO2. These
samples were also analyzed by conventional XAS. Linear combination fitting analysis of the surficial sediments and the digestive gland was found to overestimate by 20 to 30% the reduction into CeIII. Consequently, without HERFD-XAS, it would have been impossible to
unambiguously attribute the CeIII reduction to the digestive activity of the molluscs, and not to an interaction with the biofilm present on the surficial sediments.
Fig. 2. (A) Conventional X-ray absorption spectroscopy (XAS) and (B) high-energy resolution fluorescence detected (HERFD) XAS analysis of the surficial sediments and the digestive gland of P. corneus exposed for 4 wk to CeO2 nanoparticles in aquatic mesocosms mimicking a pond ecosystem. (C) Zoom in on the pre-edge area of the HERFD XAS spectra. (D) Results of the linear combination fits performed on the conventional XAS (range −20 to 30 eV) and HERFD XAS (range −8 to −1 eV) spectra using two reference compounds, the initial CeO2
nanoparticles and the CeIII–cysteine.
Mercury Speciation
Anaerobic microorganisms are responsible for producing the neurotoxin methylmercury (MeHg) in the environment, requiring inorganic HgII as a substrate (Parks et al., 2013). Many studies have employed XAS to study HgII speciation in environmental and biological samples
to better understand which HgII species are bioavailable for MeHg production (Andrews, 2006; Skyllberg et al., 2006; Nagy et al., 2011; Dunham-Cheatham et al., 2014, 2015; Thomas et al., 2014; Manceau et al., 2015). In the anoxic environments where MeHg is produced, HgII is
primarily bound to thiol functional groups in organic matter or sulfide due to its high affinity for reduced sulfur. Additionally, environmental HgII concentrations are intrinsically low (<1 µg.g-1). Analyses of diluted samples benefit from solely scanning the XANES region to avoid
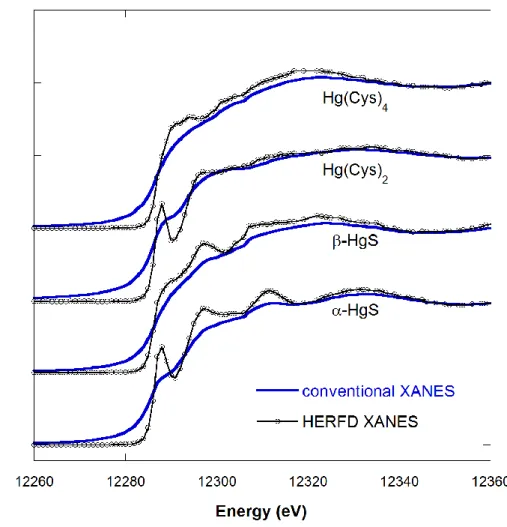
Hg coordinated to sulfur atoms contain few distinguishing features (Fig. 3), making it difficult to correctly identify relevant HgII species in natural environments. In contrast, the increased spectral resolution of Hg LIII edge HERFD-XANES provides distinct spectral signatures for
different forms of HgII bound to reduced sulfur. Both the conventional and HERFD-XANES spectra of -HgS and -HgS were measured at room temperature (Fig. 3); thus, the observed increase in resolution is not a temperature effect. High-energy resolution fluorescence detected XANES will be an asset to future studies of HgII speciation, lowering the detection limit for
HgII in natural samples.
Fig. 3. Mercury LIII edge conventional and high-resolution X-ray absorption near-edge structure (XANES)
of species of HgII with reduced sulfur coordination. The HgII in -HgS (cinnabar) and Hg(Cysteine)
2 is linearly
coordinated to two sulfur atoms, whereas the HgII in -HgS (metacinnabar) and Hg(Cysteine)
4 is tetrahedrally
coordinated to four sulfur atoms. Preparation and X-ray absorption spectroscopy (XAS) measurement details are given in the Supplemental Material and described more extensively in Thomas & Gaillard (2017). The Hg LIII–
edge high-resolution XANES spectra were measured on BM30B and BM16, and the conventional XANES spectra were measured on the DuPont–Northwestern–Dow Collaborative Access Team (DND-CAT) beamline at the Advanced Photon Source.
Consequence on Principal Component Analysis and Linear Combination Fitting
Speciation determination of metals (or metalloids, halogens, etc.) in environmental and biogeochemical samples can be challenging when the probed element is present in several forms. An often-used way to overcome this complexity is to reconstruct the spectrum obtained for the sample with a LCF of model compound spectra (Gräfe et al., 2014). The accuracy of
this reconstruction depends on several parameters, among them (i) the quality of the spectra (both of the samples and the model compounds), (ii) the relevance of the model compound spectral database (Are all the possible configurations present? Is the local order of the probed element in a well-crystallized phase comparable with the one in an ill-ordered identical phase encountered in the sample? How many independent pure model compounds spectra are needed?), and (iii) the spectral differences between the model compounds spectra.
The number of pure model compounds needed to reconstruct a dataset of spectra can be determined using a PCA statistical approach (Manceau et al., 2014). The number of eigenvalues needed to reconstruct the entire dataset is the most common indicator used to determine this number, although the results can be ambiguous and overestimation may bring better results (Manceau et al., 2014).
Fig. 4. Principal component analysis of a synthetic multicomponent set of 50 X-ray absorption near-edge structure (XANES) spectra obtained in conventional and high-energy resolution fluorescence detected (HERFD) mode of detection. Target transformations of the -HgS reference spectra used to calculate the multicomponent spectra, in (a) conventional mode or (b) HERFD. Results of the least square fitting analysis of the Hg(Cys)4 ratio
in the random synthetic multicomponent set of XANES, obtained in (c) conventional and (d) HERFD mode: comparison between the ratio obtained from the adjustment and from the spectrum calculation.
High-energy resolution fluorescence detected XANES has a better spectral resolution than conventional XANES. This improvement can be useful for PCA and LCF approaches. We chose to illustrate this quantitatively. We created two datasets of 50 artificial Hg multicomponent spectra based on random linear combinations of the conventional or HERFD spectra of the four Hg model compounds described above. For each dataset, noise was added to each linear combination spectra, corresponding to 0.25% of the edge step. Details of the analysis are given in the Supplemental Material. Different steps of the PCA analysis are shown (Supplemental Fig. S6), as well as spectra used for the analysis (example of multicomponent
spectrum, Supplemental Fig. S6a), the scree plot (number of eigenvalues, Supplemental Fig. S6b), and the target transformation of each set for conventional mode (Fig. 4a) or HERFD (Fig. 4b).
The main observation given by the scree plot (Supplemental Fig. S6b) is that the number of components needed to perform the LCF analysis is quite difficult to estimate for the conventional spectra (three or four are possible candidates), whereas the correct number of four components is more easily deduced for the HERFD spectra. This might come from the fact that the shape of the pure component spectra is quite similar in conventional measurements. This is corroborated by the target transformation performed for each set of spectra. In conventional mode (Fig. 4a), only three components seem to be necessary to reproduce the -HgS spectrum; a fourth component does not improve the residual of the target transformation. In HERFD mode (Fig. 4b), the -HgS spectrum needs four components to be reproduced satisfactorily. The well-marked features obtained in HERFD mode, very different in shape and position from one reference spectrum to the other, allow clear differentiation of the components.
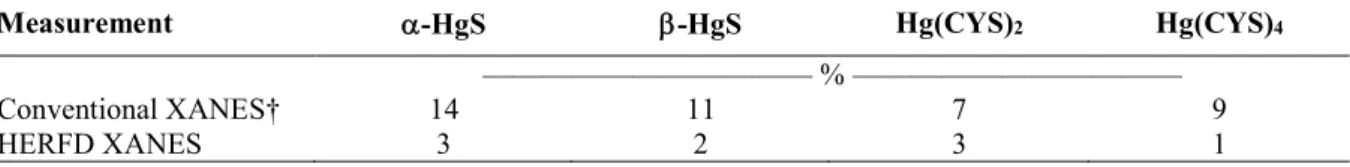
We performed a LCF analysis of both set of spectra using the four components, determined a ratio of each component, and compared the “LCF ratio” to the “real ratio.” The results are given in Fig. 4c and 4d for the Hg(Cys)4 ratio (and in Supplemental Fig. S7 for the other
compounds), and the standard deviations between the “LCF ratio” and “real ratio” for each compounds measured with both modes of detection are presented in Table 2. It is no surprise to see that the determined ratio is more precise with the HERFD XANES than with the conventional ones. The precision in the determined ratio is around 10% for the conventional mode and around 2% for HERFD. These results are only given as an illustration of the improvement brought by the HERFD measurements, in this particular case, and the absolute values of determined ratio cannot be directly used for all absorption edges, all elements, and all compounds. Nevertheless, the improvement is clear.
Table 2. Determination of the ratio of Hg components in synthetic mixtures from conventional and high-energy resolution fluorescence detected (HERFD) measurements: standard deviation between the linear combination fitting result and the initial ratio for the four compounds used for the study.
Measurement -HgS -HgS Hg(CYS)2 Hg(CYS)4
——————————— % ———————————
Conventional XANES† 14 11 7 9
HERFD XANES 3 2 3 1
† XANES, X-ray absorption near-edge structure.
Conclusions
With the development of CAS on XAS beamlines worldwide, HERFD-XAS is becoming one of the most suitable techniques for speciation analysis of metals and metalloids in environmental biogeochemistry. The new opportunities brought by this high-resolution spectroscopy are (i) the possibility to study ultra-diluted elements by filtering with great efficiency the background photons and (ii) to improve the sensitivity of the measurement with the acquisition of better-resolved XANES spectra. It is now possible to probe elements such as Se at natural levels and pollutants such as Hg or Ce at realistic concentrations (µg.g-1 or below). These measurements are already possible. In the near future, with the development or upgrade of the synchrotron sources, as well as the development of the crystal analyzer spectrometers (improved geometry, more crystals, better bent crystals, etc.), one can reasonably think of reducing the detection limits even more.
ACKNOWLEDGMENTS
Construction of the spectrometer prototype on BM30B/FAME beamline at the ESRF, actually used on BM16/FAME-UHD, was financially supported by the French National Institute for Earth Science and Astronomy of the CNRS (INSU CNRS), ANR NANOSURF (coordinator: C. Chaneac, LCMCP), ANR MESONNET (coordinator: J.Y. Bottero, CEREGE), CEREGE laboratory (Aix en Provence, France), and Labex OSUG@2020 (ANR-10-LABX-0056). The FAME-UHD project is financially supported by the French “invest for the future” EquipEx (EcoX, ANR-10-EQPX-27-01), the CEA-CNRS CRG consortium, and the French National Institute for Earth Science and Astronomy of the CNRS (INSU CNRS). We thank A. Gorczyca and V. Moizan for their help during the work on the Pt/Al2O3 sample and its synthesis and preparation for the experiment, as well as IFP
Énergies nouvelles (IFPEN) for the funding of the used Ge(110) crystals. A portion of this work (S.Thomas’s work on Hg) is supported by the Chateaubriand Fellowship of the Office for Science & Technology of the Embassy of France in the United States. M. Irar’s Ph.D. fellowship is supported by CAMPUS FRANCE.
REFERENCES
Andrews, J.C. 2006. Mercury speciation in the environment using X-ray absorption spectroscopy. Struct. Bonding 120:1–35. doi:10.1007/430_011
Auffan, M., J. Rose, T. Orsiere, M. De Meo, A. Thill, O. Zeyons et al. 2009. CeO2 nanoparticles induce DNA
damage towards human dermal fibroblasts in vitro. Nanotoxicology 3:161–171. doi:10.1080/17435390902788086
Auffan, M., M. Tella, C. Santaella, L. Brousset, C. Paillès, M. Barakat et al. 2014. An adaptable mesocosm platform for performing integrated assessments of nanomaterial risk in complex environmental systems. Sci. Rep. 3:5608.
Bargar, J.R., B.M. Tebo, U. Bergmann, S.M. Webb, P. Glatzel, V.Q. Chiu, and M. Villalobos. 2005. Biotic and abiotic products of Mn(II) oxidation by spores of the marine Bacillus sp. strain SG-1. Am. Mineral. 90:143– 154. doi:10.2138/am.2005.1557
Bauer, M. 2014. HERFD-XAS and valence-to-core-XES: New tools to push the limits in research with hard X-rays? Phys. Chem. Chem. Phys. 16:13827–13837. doi:10.1039/C4CP00904E
Baumgartner, J., G. Morin, N. Menguy, T. Perez Gonzalez, M. Widdrat, J. Cosmidis, and D. Faivre. 2013. Magnetotactic bacteria form magnetite from a phosphate-rich ferric hydroxide via nanometric ferric (oxyhydr)oxide intermediates. Proc. Natl. Acad. Sci. USA 110:14883–14888.
doi:10.1073/pnas.1307119110
Bergmann, U., and S.P. Cramer. 1998. A high-resolution large-acceptance analyzer for X-ray fluorescence and Raman spectroscopy. Proc. SPIE 3448:198–209. doi:10.1117/12.332507
Bergmann, U., and P. Glatzel. 2009. X-ray emission spectroscopy. Photosynth. Res. 102:255–266. doi:10.1007/s11120-009-9483-6
Bergmann, U., P. Glatzel, F. deGroot, and S.P. Cramer. 1999. High resolution K capture X-ray fluorescence spectroscopy: A new tool for chemical characterization. J. Am. Chem. Soc. 121:4926–4927.
doi:10.1021/ja984454w
Bissardon, C. 2016. Le rôle du sélénium dans le métabolisme, la croissance et la maturation du cartilage articulaire. Ph.D. diss., Grenoble-Alpes Univ., Grenoble, France.
Blazevic, A., E. Orlowska, W. Kandioller, F. Jirsa, B.K. Keppler, M. Tafili-Kryeziu et al. 2016. Photoreduction of terrigenous Fe-humic substances leads to bioavailable iron in oceans. Angew. Chem. Int. Ed. 55:6417– 6422. doi:10.1002/anie.201600852
Bordage, A., V. Trannoy, O. Proux, H. Vitoux, R. Moulin, and A. Bleuzen. 2015. In situ site-selective K-edge XAS: A powerful probe of the transformation of mixed-valence compounds. Phys. Chem. Chem. Phys. 17:17260–17265. doi:10.1039/C5CP02591E
Brindley, G.W. 1933. On the reflection and refraction of X-rays by perfect crystals. Proc. R. Soc. Lond., A Contain. Pap. Math. Phys. Character 140:301–313. doi:10.1098/rspa.1933.0070
Cabaret, D., A. Bordage, A. Juhin, M. Arfaoui, and E. Gaudry. 2010. First-principles calculations of X-ray absorption spectra at the K-edge of 3d transition metals: An electronic structure analysis of the pre-edge. Phys. Chem. Chem. Phys. 12:5619–5633. doi:10.1039/b926499j
Casals, E., R. Barrena, A. García, E. González, L. Delgado, M. Busquets-Fité et al. 2014. Programmed iron oxide nanoparticles disintegration in anaerobic digesters boosts biogas production. Small 10:2801–2808. doi:10.1002/smll.201303703
Collart, E., A. Shukla, F. Gélébart, M. Morand, C. Malgrange, N. Bardou et al. 2005. Spherically bent analyzers for resonant inelastic X-ray scattering with intrinsic resolution below 200 meV. J. Synchrotron Radiat. 12:473–478. doi:10.1107/S090904950501472X
Collin, B., E. Oostveen, O.V. Tsyusko, and J.M. Unrine. 2014. Influence of natural organic matter and surface charge on the toxicity and bioaccumulation of functionalized ceria nanoparticles in Caenorhabditis elegans. Environ. Sci. Technol. 48:1280–1289. doi:10.1021/es404503c
DeBeer, S., and U. Bergmann. 2016. X-ray emission spectroscopy techniques in bioinorganic applications. Encycl. Inorg. Bioinorg. Chem. doi:10.1002/9781119951438.eibc2158
de Groot, F., and A. Kotani. 2008. Core level spectroscopy of solids. Advances in condensed matter science. Vol. 6. CRC Press, Boca Raton, FL. doi:10.1201/9781420008425
de Groot, F., M.H. Krisch, and J. Vogel. 2002. Spectral sharpening of the Pt L edges by high-resolution x-ray emission. Phys. Rev. B 66:195112. doi:10.1103/PhysRevB.66.195112
de Groot, F., G. Vankó, and P. Glatzel. 2009. The 1s x-ray absorption pre-edge structures in transition metal oxides. J. Phys. Condens. Matter 21:104207. doi:10.1088/0953-8984/21/10/104207
Dunham-Cheatham, S., B. Farrell, B. Mishra, S. Myneni, and J.B. Fein. 2014. The effect of chloride on the adsorption of Hg onto three bacterial species. Chem. Geol. 373:106–114.
doi:10.1016/j.chemgeo.2014.02.030
Dunham-Cheatham, S., B. Mishra, S. Myneni, and J.B. Fein. 2015. The effect of natural organic matter on the adsorption of mercury to bacterial cells. Geochim. Cosmochim. Acta 150:1–10.
doi:10.1016/j.gca.2014.11.018
Eeckhout, S.G., O.V. Safonova, G. Smolentsev, M. Biasioli, V.A. Safonov, L.N. Vykhodtseva et al. 2009. Cr local environment by valence-to-core X-ray emission spectroscopy. J. Anal. At. Spectrom. 24:215–223. doi:10.1039/B808345M
Fister, T.T., G.T. Seidler, J.J. Rehr, J.J. Kas, W.T. Elam, J.O. Cross, and K.P. Nagle. 2007. Deconvolving instrumental and intrinsic broadening in core-shell x-ray spectroscopies. Phys. Rev. B 75:174106. doi:10.1103/PhysRevB.75.174106
Gallo, E., and P. Glatzel. 2014. Valence to core X-ray emission spectroscopy. Adv. Mater. 26:7730–7746. doi:10.1002/adma.201304994
Garaud, M., M. Auffan, S. Devin, V. Felten, C. Pagnout, S. Pain-Devin et al. 2016. Integrated assessment of ceria nanoparticle impacts on the freshwater bivalve Dreissena polymorpha. Nanotoxicology 10:935–944. doi:10.3109/17435390.2016.1146363
Glatzel, P., L. Jacquamet, U. Bergmann, F.M.F. de Groot, and S.P. Cramer. 2002. Site-selective EXAFS in mixed-valence compounds using high-resolution fluorescence detection: A study of iron in Prussian Blue. Inorg. Chem. 41:3121–3127. doi:10.1021/ic010709m
Glatzel, P., and A. Juhin. 2013. X-ray absorption and emission spectroscopy. In: D.W. Bruce, D. O’Hare, and R.I. Walton, editors, Local structural characterisation. John Wiley & Sons, Chichester, UK. p. 89–171. doi:10.1002/9781118681909.ch2
Gorczyca, A., V. Moizan, C. Chizallet, O. Proux, W. Delnet, E. Lahera et al. 2014. Monitoring morphology and hydrogen coverage of subnanometric Pt/-Al2O3 particles by in situ HERFD-XANES and quantum
simulations. Angew. Chem. Int. Ed. 53:12426–12429.
Gräfe, M., E. Donner, R.N. Collins, and E. Lombi. 2014. Speciation of metal(loid)s in environmental samples by X-ray absorption spectroscopy: A critical review. Anal. Chim. Acta 822:1–22.
Grush, M.M., G. Christou, K. Hamalainen, and S.P. Cramer. 1995. Site-selective XANES and EXAFS: A demonstration with manganese mixtures and mixed-valence complexes. J. Am. Chem. Soc. 117:5895– 5896. doi:10.1021/ja00126a047
Hall, E.R., C.J. Pollock, J. Bendix, T.J. Collins, P. Glatzel, and S. Debeer. 2014. Valence-to-core-detected X-ray absorption spectroscopy: Targeting ligand selectivity. J. Am. Chem. Soc. 136:10076–10084.
doi:10.1021/ja504206y
Hämäläinen, K., D.P. Siddons, J.B. Hastings, and L.E. Berman. 1991. Elimination of the inner-shell lifetime broadening in X-ray absorption spectroscopy. Phys. Rev. Lett. 67:2850–2853.
doi:10.1103/PhysRevLett.67.2850
Hazemann, J.-L., O. Proux, V. Nassif, H. Palancher, E. Lahera, C. Da Silva et al. 2009. High resolution spectroscopy on an X-ray absorption beamline. J. Synchrotron Radiat. 16:283–292.
doi:10.1107/S0909049508043768
Heald, S.P. 2015. Strategies and limitations for fluorescence detection of XAFS at high flux beamlines. J. Synchrotron Radiat. 22:436–445. doi:10.1107/S1600577515001320
Henderson, G.S., F.M.F. de Groot, and B.J.A. Moulton. 2014. X-ray absorption near-edge structure (XANES) spectroscopy. Rev. Mineral. Geochem. 78:75–138. doi:10.2138/rmg.2014.78.3
Hong, J., J.R. Peralta-Videa, C. Rico, S. Sahi, M.N. Viveros, J. Bartonjo et al. 2014. Evidence of translocation and physiological impacts of foliar applied CeO2 nanoparticles on cucumber (Cucumis sativus) plants.
Environ. Sci. Technol. 48:4376–4385. doi:10.1021/es404931g
Izumi, Y., F. Kiyotaki, T. Minato, and Y. Seida. 2002. X-ray absorption fine structure combined with
fluorescence spectrometry for monitoring trace amounts of lead adsorption in the environmental conditions. Anal. Chem. 74:3819–3823. doi:10.1021/ac025550p
Jaklevic, J., J.A. Kirby, M.P. Klein, A.S. Robertson, G.S. Brown, and P. Eisenberger. 1977. Fluorescence detection of exafs: Sensitivity enhancement for dilute species and thin films. Solid State Commun. 23:679– 682. doi:10.1016/0038-1098(77)90548-8
Johann, H.H. 1931. Die erzeugung lichtstarker röntgenspektren mit hilfe von konkavkristallen. Z. Phys. 69:185– 206. doi:10.1007/BF01798121
Johansson, T. 1933. Über ein neuartiges, genau fokussierendes röntgenspektrometer. Z. Phys. 82:507–528. doi:10.1007/BF01342254
Joly, Y., and S. Grenier. 2016. Theory of X-ray absorption near edge structure. In: J.A. Van Bokhoven and C. Lamberti, editors, X-ray absorption and X-ray emission spectroscopy: Theory and applications. Wiley & Sons, Hoboken, NJ. p. 73–97. doi:10.1002/9781118844243.ch4
Kelly, S.D., S.R. Bare, N. Greenlay, G. Azevedo, M. Balasubramanian, D. Barton et al. 2009. Comparison of EXAFS foil spectra from around the world. J. Phys. Conf. Ser. 190:012032.
doi:10.1088/1742-6596/190/1/012032
Kopittke, P.M., P. Wang, E. Lombi, and E. Donner. 2017. Synchrotron-based X-ray approaches for examining toxic trace metal(loid)s in soil–plant systems. J. Environ. Qual. doi:10.2134/jeq2016.09.0361
Kowalska, J.K., F.A. Lima, C.J. Pollock, J.A. Rees, and S. DeBeer. 2016. A practical guide to high-resolution X-ray spectroscopic measurements and their applications in bioinorganic chemistry. Isr. J. Chem. 56:803– 815. doi:10.1002/ijch.201600037
Kühn, T.-J., J. Hormes, N. Matoussevitch, H. Bönnemann, and P. Glatzel. 2014. Site-selective high-resolution X-ray absorption spectroscopy and high-resolution X-ray emission spectroscopy of cobalt nanoparticles. Inorg. Chem. 53:8367–8375. doi:10.1021/ic5000183
Lambertz, C., P. Chernev, K. Klingan, N. Leidel, K.G.V. Sigfridsson, T. Happe, and M. Haumann. 2014. Electronic and molecular structures of the active-site H-cluster in [FeFe]-hydrogenase determined by site-selective X-ray spectroscopy and quantum chemical calculations. Chem. Sci. (Camb.) 5:1187–1203. doi:10.1039/c3sc52703d
Llorens, I., E. Lahera, W. Delnet, O. Proux, A. Braillard, J.-L. Hazemann et al. 2012. High energy resolution five-crystal spectrometer for high quality fluorescence and absorption measurements on an X-ray absorption spectroscopy beamline. Rev. Sci. Instrum. 83:063104. doi:10.1063/1.4728414
Lohße, A., S. Borg, O. Raschdorf, I. Kolinko, E. Tompa, M. Pósfai et al. 2014. Genetic dissection of the
mamAB and mms6 operons reveals a gene set essential for magnetosome biogenesis in magnetospirillum gryphiswaldense. J. Bacteriol. 196:2658–2669. doi:10.1128/JB.01716-14
Lombi, E., G.M. Hettiarachchi, and K.G. Scheckel. 2011. Advanced in situ spectroscopic techniques and their applications in environmental biogeochemistry: Introduction to the special section. J. Environ. Qual. 40:659–666. doi:10.2134/jeq2010.0542
López-Moreno, M.L., G. de la Rosa, J.A. Hernández-Viezcas, J.R. Peralta-Videa, and J.L. Gardea-Torresdey. 2010. XAS corroboration of the uptake and storage of CeO2 nanoparticles and assessment of their
differential toxicity in four edible plant species. J. Agric. Food Chem. 58:3689–3693. doi:10.1021/jf904472e
Luster, J., and R. Finlay. 2006. Handbook of methods used in rhizosphere research. Swiss Federal Research Institute WSL, Birmensdorf, Switzerland.
Ma, C., S. Chhikara, B. Xing, C. Musante, J.C. White, and O. Parkash Dhankher. 2013. Physiological and molecular response of Arabidopsis thaliana (L.) to nanoparticle cerium and indium oxide exposure. ACS Sustain. Chem.& Eng. 1:768–778. doi:10.1021/sc400098h
Manceau, A., M. Enescu, A. Simionovici, M. Lanson, M. Gonzalez-Rey, M. Rovezzi et al. 2016. Chemical forms of mercury in human hair reveal sources of exposure. Environ. Sci. Technol. 50:10721–10729. doi:10.1021/acs.est.6b03468
Manceau, A., C. Lemouchi, M. Enescu, A.-M. Gaillot, M. Lanson, V. Magnin et al. 2015. Formation of mercury sulfide from Hg(II)thiolate complexes in natural organic matter. Environ. Sci. Technol. 49:9787–9796. doi:10.1021/acs.est.5b02522
Manceau, A., M. Marcus, and T. Lenoir. 2014. Estimating the number of pure chemical components in a mixture by X-ray absorption spectroscopy. J. Synchrotron Radiat. 21:1140–1147.
doi:10.1107/S1600577514013526
Masih, D., Y. Izumi, K. Aika, and Y. Seida. 2007. Optimization of an iron intercalated montmorillonite preparation for the removal of arsenic at low concentrations. Eng. Life Sci. 7:52–60.
doi:10.1002/elsc.200620171
Mijovilovich, A., Hayashi, H., Kawamura, N., Osawa, H., Bruijnincx, P. C. A., Klein Gebbink et al. 2012. K
detected high-resolution XANES of FeII and FeIII models of the 2-His-1-carboxylate motif: Analysis of the
carboxylate binding mode. Eur. J. Inorg. Chem. 10:1589–1597. doi:10.1002/ejic.201101075
Milne, C.J., T.J. Penfold, and M. Chergui. 2014. Recent experimental and theoretical developments in time-resolved X-ray spectroscopies. Coord. Chem. Rev. 277–278:44–68. doi:10.1016/j.ccr.2014.02.013 Nagy, K.L., A. Manceau, J.D. Gasper, J.N. Ryan, and G.R. Aiken. 2011. Metallothionein-like multinuclear
clusters of mercury(II) and sulfur in peat. Environ. Sci. Technol. 45:7298–7306. doi:10.1021/es201025v Newville, M. 2014. Fundamentals of XAFS. Rev. Mineral. Geochem. 78:33–74. doi:10.2138/rmg.2014.78.2 Ortega, R., A. Carmona, I. Szlachetko, and P.L. Solari. 2012. X-ray absorption spectroscopy of biological
samples: A tutorial. J. Anal. At. Spectrom. 27:2054–2065. doi:10.1039/c2ja30224a
Parks, J.M., A. Johs, M. Podar, R. Bridou, R.A. Hurt, S.D. Smith et al. 2013. The genetic basis for bacterial mercury methylation. Science 339:1332–1335. doi:10.1126/science.1230667
Poulin, B.A., G.R. Aiken, K.L. Nagy, A. Manceau, D.P. Krabbenhoft, and J.N. Ryan. 2016. Mercury transformation and release differs with depth and time in a contaminated riparian soil during simulated flooding. Geochim. Cosmochim. Acta 176:118–138. doi:10.1016/j.gca.2015.12.024
Rehr, J.J., and R.C. Albers. 2000. Theoretical approaches to X-ray absorption fine structure. Rev. Mod. Phys. 72:621–654. doi:10.1103/RevModPhys.72.621
Rollin-Genetet, F., C. Seidel, E. Artells, M. Auffan, A. Thieìry, and C. Vidaud. 2015. Redox reactivity of cerium oxide nanoparticles induces the formation of disulfide bridges in thiol-containing biomolecules. Chem. Res. Toxicol. 28:2304–2312. doi:10.1021/acs.chemrestox.5b00319
Rovezzi, M., and P. Glatzel. 2014. Hard X-ray emission spectroscopy: A powerful tool for the characterization of magnetic semiconductors. Semicond. Sci. Technol. 29:023002. doi:10.1088/0268-1242/29/2/023002
Rovezzi, M., Lapras, C., Manceau, A., Glatzel, P., and R. Verbeni. 2017. High energy-resolution x-ray spectroscopy at ultra-high dilution with spherically bent crystal analyzers of 0.5 m radius. Rev. Sci. Instrum. 88:013108. doi:10.1063/1.4974100
Sá, J., J. Czapla-Masztafiak, E. Lipiec, Y. Kayser, D.L.A. Fernandes, J. Szlachetko et al. 2016. Resonant X-ray emission spectroscopy of platinum(II) anticancer complexes. Analyst 141:1226–1232.
doi:10.1039/C5AN02490K
Safonov, V.A., L.N. Vykhodtseva, Y.M. Polukarov, O.V. Safonova, G. Smolentsev, M. Sikora et al. 2006. Valence-to-core X-ray emission spectroscopy identification of carbide compounds in nanocrystalline Cr coatings deposited from Cr(III) electrolytes containing organic substances. J. Phys. Chem. B 110:23192– 23196. doi:10.1021/jp064569j
Sarret, G., E. Pilon Smits, H. Castillo-Michel, M.P. Isaure, F.J. Zhao, and R. Tappero. 2013. Use of
synchrotron-based techniques to elucidate metal uptake and metabolism in plants. Adv. Agron. 119:1–82. doi:10.1016/B978-0-12-407247-3.00001-9
Sheng, G., Q. Yang, F. Peng, H. Li, X. Gao, and Y. Huang. 2014. Determination of colloidal pyrolusite, Eu(III) and humic substance interaction: A combined batch and EXAFS approach. Chem. Eng. J. 245:10–16. doi:10.1016/j.cej.2014.02.021
Skyllberg, U., P.R. Bloom, J. Qian, C.M. Lin, and W.F. Bleam. 2006. Complexation of mercury(II) in soil organic matter: EXAFS evidence for linear two-coordination with reduced sulfur groups. Environ. Sci. Technol. 40:4174–4180. doi:10.1021/es0600577
Soldati, A.L., D.E. Jacob, P. Glatzel, J.C. Swarbrick, and J. Geck. 2016. Element substitution by living organisms: The case of manganese in mollusc shell aragonite. Sci. Rep. 6:22514. doi:10.1038/srep22514 Stojanoff, V., K. Hämäläinen, D.P. Siddons, J.B. Hastings, L.E. Berman, S. Cramer, and G. Smith. 1992. A
high‐resolution X‐ray fluorescence spectrometer for near‐edge absorption studies. Rev. Sci. Instrum. 63:1125–1127. doi:10.1063/1.1143112
Swarbrick, J.C., U. Skyllberg, T. Karlsson, and P. Glatzel. 2009. High energy resolution X-ray absorption spectroscopy of environmentally relevant lead(II) compounds. Inorg. Chem. 48:10748–10756. doi:10.1021/ic9015299
Szlachetko, M., M. Berset, J.-C. Dousse, J. Hoszowska, and J. Szlachetko. 2013. High-resolution Laue-type DuMond curved crystal spectrometer. Rev. Sci. Instrum. 84:093104. doi:10.1063/1.4821621
Takahashi, Y., T. Uruga, H. Tanida, Y. Terada, S. Nakai, and H. Shimizu. 2006. Application of X-ray absorption near-edge structure (XANES) using bent crystal analyzer to speciation of trace Os in iron meteorites. Anal. Chim. Acta 558:332–336. doi:10.1016/j.aca.2005.11.043
Tella, M., M. Auffan, L. Brousset, J. Issartel, I. Kieffer, C. Pailles et al. 2014. Transfer, transformation, and impacts of ceria nanomaterials in aquatic mesocosms simulating a pond ecosystem. Environ. Sci. Technol. 48:9004–9013. doi:10.1021/es501641b
Tella, M., M. Auffan, L. Brousset, E. Morel, O. Proux, C. Chanéac et al. 2015. Chronic dosing of a simulated pond ecosystem in indoor aquatic mesocosms: Fate and Transport of CeO2 nanoparticles. Environ. Sci.
Nano 2:653–663. doi:10.1039/C5EN00092K
Thomas, S.A., and J.F. Gaillard. 2017. Exogenous cysteine promotes sulfide production and four-fold Hg(II)-S coordination in actively metabolizing Escherichia coli. Environ. Sci. Technol. doi:10.1021/acs.est.6b06400 Thomas, S.A., T.Z. Tong, and J.F. Gaillard. 2014. Hg(II) bacterial biouptake: The role of anthropogenic and
biogenic ligands present in solution and spectroscopic evidence of ligand exchange reactions at the cell surface. Metallomics 6:2213–2222. doi:10.1039/C4MT00172A
Vogel, C., O. Krüger, H. Herzel, L. Amidani, and C. Adam. 2016. Chemical state of mercury and selenium in sewage sludge ash based P-fertilizers. J. Hazard. Mater. 313:179–184. doi:10.1016/j.jhazmat.2016.03.079 von Hámos, L. 1932. Röntgenspektroskopie und Abbildung mittels gekrümmter Kristallreflektoren.
Naturwissenschaften 20:705–706. doi:10.1007/BF01494468
Westre, T.E., P. Kennepohl, J.G. DeWitt, B. Hedman, K.O. Hodgson, and E.I. Solomon. 1997. A multiplet analysis of Fe K-edge 1s 3d pre-edge features of iron complexes. J. Am. Chem. Soc. 119:6297–6314. doi:10.1021/ja964352a
Yamamoto, T. 2008. Assignment of pre-edge peaks in K-edge X-ray absorption spectra of 3d transition metal compounds: Electric dipole or quadrupole? XRay Spectrom. 37:572–584. doi:10.1002/xrs.1103
Zeyons, O., A. Thill, F. Chauvat, N. Menguy, C. Cassier-Chauvat, C. Oréar et al. 2009. Direct and indirect CeO2
nanoparticles toxicity for Escherichia coli and Synechocystis. Nanotoxicology 3:284–295. doi:10.3109/17435390903305260
Zhang, P., Y. Ma, Z. Zhang, X. He, J. Zhang, Z. Guo et al. 2012. Biotransformation of ceria nanoparticles in cucumber plants. ACS Nano 6:9943–9950. doi:10.1021/nn303543n