HAL Id: tel-00574614
https://tel.archives-ouvertes.fr/tel-00574614
Submitted on 8 Mar 2011HAL is a multi-disciplinary open access archive for the deposit and dissemination of sci-entific research documents, whether they are pub-lished or not. The documents may come from teaching and research institutions in France or abroad, or from public or private research centers.
L’archive ouverte pluridisciplinaire HAL, est destinée au dépôt et à la diffusion de documents scientifiques de niveau recherche, publiés ou non, émanant des établissements d’enseignement et de recherche français ou étrangers, des laboratoires publics ou privés.
Le piedmont nord du Tian Shan : cas d’école d’un front
de chaîne immature
Ke Chen
To cite this version:
Ke Chen. Le piedmont nord du Tian Shan : cas d’école d’un front de chaîne immature. Tectonique. Université d’Orléans, 2010. Français. �tel-00574614�
ÉCOLE DOCTORALE SCIENCES ET TECHNOLOGIES
Institut des Sciences de la Terre d’Orléans
Institute of Geology and Geophysics, Chinese Academy of Sciences
THÈSE EN COTUTELLE INTERNATIONALE
présentée par :Ke CHEN
Soutenue le 1er décembre 2010
Pour obtenir le grade de : Docteur de l’Université d’Orléans et de l’Institute of Geology and Geophysics
Discipline : Sciences de la Terre et de l’Atmosphère
THÈSE dirigée par :
M. Yan CHEN Professeur, ISTO, Université d’Orléans-CNRS, France M. Qingchen WANG Professeur, IGG, CAS, Chine
RAPPORTEURS :
M. Marc JOLIVET CR, CNRS, Géosciences Rennes, France M. Bihong FU Professeur, KLEDI, CAS, Chine
JURY :
M. Rixiang ZHU Professeur, IGG, CAS, Chine, Président de Jury M. Romain AUGIER MCF, ISTO, Université d’Orléans-CNRS, France M. Bihong FU Professeur, KLEDI, CAS, Chine
M. Charles GUMIAUX MCF, ISTO, Université d’Orléans-CNRS, France M. Marc JOLIVET CR, CNRS, Géosciences Rennes, France M. Wei LIN Professeur, IGG, CAS, Chine
M. Guillaume MARTELET Ingénieur, BRGM, Orléans, France M. Qingchen WANG Professeur, IGG, CAS, Chine
INVITÉS :
M. Yan CHEN Professeur, ISTO, Université d’Orléans-CNRS,France M. Julien CHARREAU MCF, INPL, CRPG, France
Le piedmont nord du Tian Shan :
cas d'école d'un front de chaîne immature
3
Table of contents
AcknowledgementChapter 1. Intracontinental orogens ...5
1.1 Basic concepts of intracontinental orogen ...7
1.2 Some examples of intracontinental orogens...9
1.3 Deformation in fold-and-thrust belts...13
Chapter 2. Geological setting and history of Tian Shan...23
2.1 Cenozoic tectonics in Asia ...25
2.1.1 The collision of the India-Asia...26
2.1.2 The deformation by the India-Asia collision...27
2.2 Geological setting and history of Tian Shan ...29
2.2.1 The origin of basement and Paleozoic assembly of Tian Shan ...30
2.2.2 Mesozoic activity and inactivity ...37
2.2.3 The current Tian Shan ...40
2.3 Problems and methodology...43
Chapter 3. The Mesozoic paleo-relief of the northern Tian Shan - submitted manuscript ...47
3.1 Abstract ...49
3.2 Introduction...49
3.3 Stratigraphy of Mesozoic sediments within the study area ...52
3.4 Structural analysis of the Mesozoic basal contact...55
3.5 Discussion and conclusions ...60
Chapter 4. Structural pattern along the northern piedmont of Tian Shan ...66
4.1 Thrust contact...71 4.1.1 Taxi He ...71 4.1.2 Toutun He West ...75 4.1.3 Toutun He...78 4.1.4 Jingou He ...81 4.1.5 Anjihai He ...84 4.1.6 Kuitun He...87 4.2 Unconformity contact ...89 4.2.1 Houxia east...90 4.2.2 Changji He ...90 4.2.3 Hutubi He...92 4.2.4 Tugulu He...93 4.2.5 Dabaiyanggou ...94 4.2.6 Wusu ...95 4.3 Fold contact...97 4.3.1 Manasi He ...98 4.3.2 Qingshui He ...100 4.4 Backthrust contact...101 4.4.1 Houxia West ...102 4.4.2 Hutubi He South...103
4
4.5 Discussion ...104
4.5.1 Backthrust in the northern piedmont of Tian Shan...104
4.5.2 The effect of Mesozoic paleo-relief on the Cenozoic deformation ...106
4.2.3 Mechanism of the deformation along the northern Tian Shan ...107
Chapter 5. Regional geological sections along the north piedmont of Tian Shan and quantification of the Cenozoic deformation ... 113
5.1 Approach of the construction of regional geological sections ... 115
5.2 Geological sections ... 118 5.1.1 Jingou He Section ... 118 5.2.2 Qingshui He section ...124 5.2.3 Hutubi He section...127 5.2.4 Wusu section ...131 5.3 Discussion ...134
5.3.1 Mechanism of deformation in the northern piedmont of Tiansahn ...134
5.3.2 The shortening in the foreland thrust-and-fold belt...138
Chapter 6. General discussion, conclusions and perspectives ...141
6.1 Persistence and contribution of a Mesozoic paleo-relief...143
6.2 The immature fold-and-thrust belt of the northern front of Tian Shan...146
6.2.1 Analysis of the range-basin contacts ...146
6.2.2 Deformation pattern within the fold-and-thrust belt ...150
6.2.3 Which tectonic model could apply for Cenozoic north Tian Shan deformation?...153
6.2.3 Structural characteristics of an immature fold-and-thrust belt ...161
6.3 Deformation timing and shortening rate in the northern piedmont of Tian Shan...163
6.3.1 Onset timing of Cenozoic foreland deformation...164
6.3.2 Qualitative shortening rates...167
6.4 Influences of inherited structures and paleo-relief on the development of Cenozoic Tian Shan...170
6.4.1 Influence of the Mesozoic paleo-relief...170
6.4.2 Influence of the Paleozoic structure ...172
6.5 Conclusions...177
6.6 Perspectives...180
References ...183
Appendixes...203
Appendix 1. Interpretation of seismic data ...205
Appendix 2. Methodology of gravity data ...208
Chapter 1. Intracontinental orogens
Chapter 1
7
1.1 Basic concepts of intracontinental orogen
The term “orogeny” appeared in the middle of the 19th century. It refers to forces and events leading to build mountains on continents. Its meaning and content have been developed with the whole geosciences, and constantly formed new hotspots and new arguments. During 1857-1960s, most geologists took the orogenesis as the results of the closure of geosynclines (Schuchert. 1925). After that, in early 1960s, it was considered as the results of subduction and collision at the margin of plates, associated with the development of the “Plate tectonics” (Dewey and Bird, 1970; Sengör,1991). The orogenesis is often related to the subduction and collision of plates in the marginal area to form the intercontinental orogeny. However, the rigid plate characteristic was challenged by extensive deformation in plates interior (Molnar, 1988). Simply stated, interaction at plate boundaries could produce deformation, magmatic activity, and metamorphism for a considerable distance from those boundaries (Molnar, 1975; Tapponnier, 1979). For example, the Atlas in Morocco, northern Africa, the Pyrenees between France and Spain, in southwest of Europe, Canadian Rocky mountain, located in the America.
A wide variety of tectonic models have been suggested to explain the intracontinental orogeny. These models assume that much of the contemporary tectonic activity is controlled by pre-existing geological features. The crustal homogeneities serve to localize in a passive manner the deformation resulting from stresses generated by a variety of tectonic forces. These forces may be and probably are completely alien to those initially responsible for the features, and, therefore, these models are grouped under the general term “resurgent tectonics” (Hinze et al., 1990; Figure 1-1).
(1) Crustal Rifting. Rifting of the continental crust and its commonly associated igneous events are a major source of large-scale crustal disturbance and are therefore particularly susceptible to resurgent tectonics. It has become increasingly clear that rifting of the crust has played a major role in the geological history of central North
8 America and the Pyrenees.
Figure 1-1. Some possible mechanical models for the intraplate orogen (Hinze et al.,
1990).
(2) Zones of weakness and crustal boundaries. Old zones of weakness are widespread in many plates, such as crustal thickness variation, ancient fault zone or lithologic boundary. They may have significant influences on subsequent structural development.
(3) Local basement heterogeneities. Mafic or ultramafic intrusive bodies which are probable sources of major gravity and magnetic anomalies have been suggested to
9 be some influence of the intraplate orogeny.
(4) Thermal expansion and contraction. Thermally induced forces are generally recognized as an origin of stress within the earth. A major method of translating thermal energy into stress is by thermal expansion and contraction. Thus, it is to be expected that this mechanism could be used to explain the geodynamics of plate interiors. It could be the results of igneous intrusions or the mantle penetrative convection.
(5) Isostatic warping. Regional variations in loading or unloading of the crust cause isostatic deviations, leading to crustal warping and the possibility of relatd crustal rupture and earthquake activity.
1.2 Some examples of intracontinental orogens
An early hypothesis of plate tectonics was that plates moved as rigid pieces of lithosphere and that the relative motion between plates was taken up at narrow zones along their boundaries. However, intraplate deformation is universal in the world. For example, the Atlas in Morocco, northern Africa; the Pyrenees between France and Spain, in southwest of Europe; Canadian Rocky mountain, located in the America.
(a) Atlas
The High Atlas and part of the Middle Atlas correspond to an intracontinental mountainous system that developed on a former set of WSW–ENE and NE–SW striking Mesozoic grabens.
These grabens were approximately initiated contemporaneously with the Trias to Lias rifting (Laville et al., 2004) that led to the opening of the Atlantic and Tethys Oceans. This graben-related thinned crust appears then to have behaved as a weakened lithosphere that has subsequently localized the compressional deformations during the Cenozoic inversion resulting from the Africa–Eurasia convergence. The major High Atlas inversion occurred during Neogene and Quaternary and developed a
10
bi-vergent mountain chain (Jacobshagen et al., 1988; Gomez et al., 2000; Teixell et al, 2003; Sébrier et al., 2004).
Figure 1-2. (a) Location sketch map of the Atlas Mountains in the North African
foreland. (b) Geological map of the central High Atlas. (c) Geological cross sections through the High Atlas of Morocco (location in Figure b) (Modified after Teixell et al., 2003; Missenard 2006).
In the core of the chain, the basement uplift is triggered by a fan of steep reverse faults, most of which are inherited from Triassic-Liassic rifting. Deformation propagated to the proximal basins by four different décollement levels (Missenard et al., 2007). The Shortening in the High Atlas, which is mainly localized on its southern and northern border faults, is overall small and ranges between 10 and 25% (Figure 1-2) (Teixell et al., 2003; Missenard 2006). The deformation style varies laterally along the two northern and southern fronts, which caused by the competition of
11
different rocks, the thickness of Mes-Cenozoic sediments and the inherited structures (Missenard et al., 2007). However, section restoration indicates that shortening decreases along strike from east to west in the High Atlas (Fig 1-1a), while topographic elevation generally increases. This inverse correlation suggests that crustal thickening does not fully explain the observed topography and suggests a mantle contribution to uplift (Teixell et al., 2003).
(b) Pyrenees
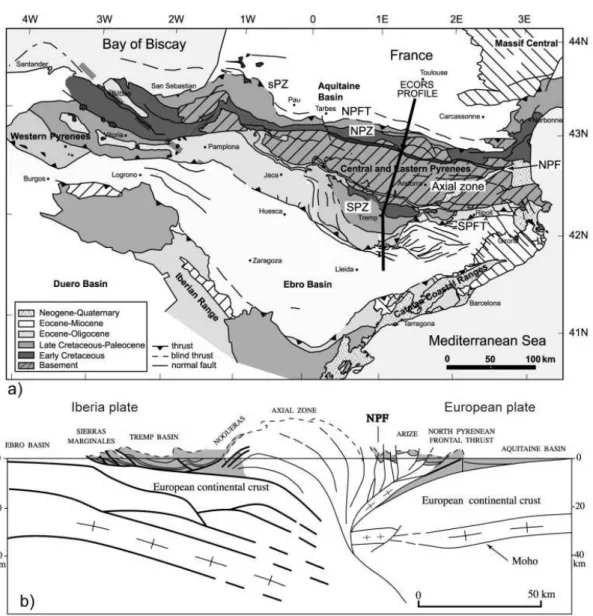
Figure 1-3. (a) Structural map of the Pyrenees and its main tectonic units (Sibuet et
al., 2004). Also shown are the locations of the ECORS (Choukroune and ECORS Team, 1989) deep seismic reflection profiles. NPF, north Pyrenean fault; NPFT, north
12
Pyrenean frontal thrust; NPZ, north Pyrenean zone; SPFT, south Pyrenean frontal thrust; SPZ, south Pyrenean units; sPZ, sub-Pyrenean zone. (b) Interpretation (on depth section) without vertical exaggeration based on the ECORS profile (Roure et al., 1989; Sibuet et al., 2004).
The Pyrenees is a 400-km-long but relatively narrow (~150 km) trending fold belt located between France (part of European plate) in the north and Spain (part of Iberia plate) in the south (Figure 1-3). It formed in Late Cretaceous–Eocene times in response to the collision between the European plate and the Iberian-Sardinian-Corsican block (Arthaud and Séguret, 1981; Choukroune et al., 1989). The deep seismic ECORS (Etude Continentale et Océanique par Réflexion et réfraction Sismique) profile suggests that Iberia plate subducted beneath the Europeen plate (Roure et al., 1989). Above, the chain interior is composed by an antiform of Variscan basement and the thrust propagate to the foreland basins, Aquitaine basin to the north and Ebro basin to the south. The amount of shortening cross the total Pyrenees is considered in the order of 100 to 150 km (Déramond et al., 1985; Roure et al., 1989; Specht, 1989; Muñoz, 1992).
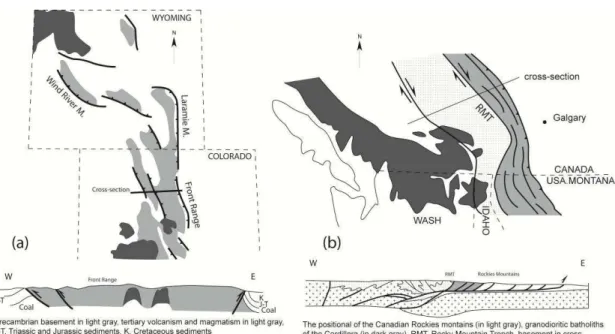
(c) Rocky Mountain
The Rocky Mountains stretch more than 4800 km from the northernmost part of British Columbia, in western Canada, to New Mexico, in the southwestern United States. They were formed in the late Cretaceous, by the Laramide orogeny (English et al., 2004). The structural styles are very diverse along the front of the Rcoky Mountains (Erslev et al., 2004). In the southern part, located in USA, the high-angle dipping basin-bounding faults separate the core basement and adjacent basins (Figure 1-4a). The basement-cored uplift by these reverses faults, caused by intraplate compression. In contrast, the Canadian Rocky Mountains display asymmetry structures, with much uplifted Paleozoic basement in the western and less uplifted with cretaceous sedimentary in the east. The crust-scale thrusts propagate up to upper
13
crust by a ramp, forming a décollement in the base of sediments (Figure 1-4b). Delaminations with up-concave thrusts were indicated by seismic profiles and drilled wells (Debelmas et al., 2008).
Figure 1-4. (a) Simplified geological map of the rocky mountain in USA and the
geological cross-section traverse the mountain. (b) Canadian Rocky Mountains with cross-section (After Debelmas et al., 2008).
There are some characteristics of the chains intracontinental as presented above. First, they reactive in the weak place of lithosphere, where may be the ancient suture or rifts. For example, the Pyrenees and the Atlas were built by the inverted structural in the ancient rifts. Second, the driving force probably is the far-effect of the plate margin, e.g. subduction and collision. The objective of above brief introductions is to compare attributes of different kinds of intraplate mountains with the Tian Shan Mountain, which will be described in the following (Discussion see chapter 6).
1.3 Deformation in fold-and-thrust belts
As discussed above, Fold-and-thrust belt is one of the characteristic in the fronts of almost of the compressional orogens, also in these intracontinental orogens. They are commonly strongly deformed and the key to understand the characteristics and evolutions of the intracontinental orogens. Here, the discussion of crustal deformation
14
was limited to the surface scale (~15 km in depth) deformation in the fold-and-thrust belts. Therefore, the mainly deformation types in this area are of faults and folds. Many studies in thrust belts have shown that most folds are ultimately generated by fault movement at depth (Rich, 1943; Dahlstrom, 1969; Fail, 1973; Dahlstrom, 1990). Thus, we can use the geometry of an exposed fold to infer the position and geometry of a fault at depth. The kink-like character of folds in thrust belts can be generalized in cross-section construction by used of the “kink-fold” method developed in the early 1980s by Suppe (1983). This method assumes that the folds are produced by a flexure-slip mechanism so that bed thickness does not change, and the footwall remains undeformed during the formation of folds in the hanging wall. There are several kinds of structures as described below.
(a) Fault-bend folds
Fault-bend folds occur where a thrust fault steps up from a structurally lower flat to a higher flat. Two kink bands form in the hanging wall, one above the base of the ramp, and the other above the top of the ramp (Figure 1-5a). With continued slip on the fault, these two kink bands grow in width (Figure 1-5b). As the truncated hanging wall moves up the ramp, and the two kink bands widen, an anticline forms at the top of the ramp. This anticline terminates downward into the upper flat (Figure 1-5b and c).
Figure 1-5. Progressive development of
a fault-bend fold as the thrust sheet moves over a ramp in a decollement (after Suppe, 1983). Letters A, A’, B, and B’ denote the axial traces.
15
(b) Fault-propagation folds
Fault-propagation folding occurs when a propagating thrust fault loses slip and terminates upsection by transferring its shortening to a fold developing at its tip (Mitra, 1990; Figure 1-6). This model is developed by Suppe and Medwedeff (1990), keeping the constant thickness and fixed axis fault propagation folding. However, several other modes are built: trishear folding (Erslev, 1991; Hardy and Ford, 1997; Allmendinger, 1998); and basement-involved (triple junction) folding (Narr and Suppe, 1994).
Figure 1-7. (a) The geometry of trishearing (after Shaw et al., 2003). The dark area
(a-b-c) indicates trishear zone. (b) Influence of propagation/ slip ratio on fold configuration (after Shaw et al., 2003; Allmendinger, 2004).
Figure 1-6. Progressive development of a
fault-propagation fold at the tip of a thrust, as the thrust sheet moves over a ramp in a decollement (after Supper, 1983). Letters A, A’, B and B’ denote the axial surfaces. Note that the fault tip coincides with the hinge of an asymmetric syncline.
16
Trishear folds form by distributed shear within a triangular (trishear) zone that expands outward from a fault tip (Erslev, 1991; Figure 1-7 a). Folds develop in the trishear zone, the bed thickness or lengths are not preserved during deformation. The geometry of the structure is a function of the apical angle, the fault dip, and the fault propagation to slip (P/S) ration (Figure 1-7 b).
Narr and Suppe (1994) proposed another kinematic theory: fault-fault-fold triple junction, in which fold growth is governed by the migration of fault-fold triple junction (Figure 1-8). The main monocline in the stratified cover forms as a drape fold over a triple junction in the basement. The development stages are composed by: i) layer-parallel shortening in the early time and ii) extension in the cover sequence later.
Figure 1-8. The evolution stages of basement-involved model (after Shaw et al.,
2003).
Forced-folding has also been proposed as the mechanism for some of these structures (Johnson and Johnson, 2002). Forced folding defined by Stearns (1978) as ‘folding in which the final overall shape and trend of the fold are dominated by the shape of some forcing member below’. This is different from the normal buckle folds by layer-parallel compression. The essential features of the mechanism are a sedimentary cover deformed more or less passively and the rigid basement blocks that are displaced along planar or listic faults. The main deformation mechanism is ‘bending’, defined as the flexuring of a layer or surface by a compression at a high angle to the layering. However, many folds in nature will compose components of compression both parallel to (viz. bulking) and normal to the layering (viz. bending)
17
(c) Detachment folds
Detachment folds form when a thrust fault contines to displace above a bedding-parallel detachment and transferred into folding of the hanging wall layers. They are different from fault-bend and fault-propagation folds, because they are not directly related to thrust ramps but rather to distributed deformation above detachments. In the core of fold, an incompetent and ductile basal unit is thickened. Growth units, if present, will thin onto the fold crest and exhibit a fanning of limb dips (Shaw et al., 2003). They generally occur above a good detachment such as the gyps or coal. Poblet et al., (1997) proposed three kinematic models to account for the geometry and kinematics of detachment folds involving a homogeneous competent layer detached over a ductile unite: 1) variable limb dip-constant limb length, 2) constant limb dip-variable limb length, and 3) variable limb dip- variable limb length (Figure 1-9).
Figure 1-9. Three different models for asymmetric kink detachment folds. A
homogeneous competent layer has preserved the length and the ductile unite shorted in the core of the anticline (after Shaw et al., 2003).
18
(d) Shear fault-bend folds
Shear fault-bend folds are similar with the normal fault-bend folding, but it is distinguished by a long back-limb that dips less than the fault ramp (Figure 1-10). It was developed by Suppe et al., (2004), reflecting the significant non-flexural slip component to the deformation. This structure is also characteristic by a significant stratigraphic section covered the back limb during fold growth, moreover the front limbs are quite narrow relative to their long back limbs.
Figure 1-10. The models of shear fault-bend folds, two end-member of simple-shear
and pure-shear, mixed model of the two end-member above, the classic normal fault-bend fold (after supper et al., 2004).
Two end-member theories are used to explain the structure, simple-shear and pure-shear (Figure 1-10). In the simple-shear member, the décollement layer undergoes bedding-parallel simple shear with no actual basal fault, just a distributed zone of shear. In the contrast of the pure-shear member, the décollement layer slides above a basal fault and shortens and thickens in a triangular area above the ramp. The mixtures between these are possible as well, shown in Figure 1-10. The model becomes to classic fault-bend fold when the ductile unite (gray light) is competent with thickness preserved.
19
(e) Imbricate structures
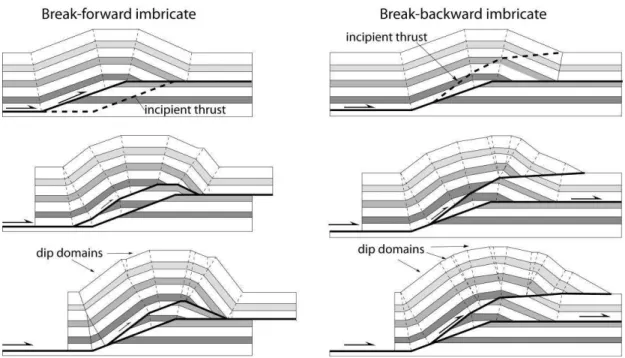
When thrust structure is characterized by the stacking of two or more thrust sheets, they are referred as the imbricate fault-bend folds. Two types of this structure are proposed, the break-forward propagation and break-backward thrusting, or with coeval motion on both deep and shallow faults (Shaw et al., 1999; Figure 1-11).
Figure 1-11. The evolution models of break-forward imbricate and break-backward
imbricate fault-bend folds (after Shaw et al., 2003).
(f) Structural wedges
Structural wedges could occur at a variety of scales. It is often associated with mountain fronts in large scale or decameter fault and fold belt in small scale. Here, we limited the structural in the hectometer geological sections. Structural wedges composed by two connected fault segments that bound a triangular fault block. Folding developed in the wedge zone pin to the wedge tip (shaw et al., 2003; Figure 1-12).
20
Figure 1-12. The structural wedges contain two faults, forethrust and back thrust.
(g) interference structures
Interference structures have been studied since several decades (e.g. Dewey, 1965; Paterson and Weiss, 1966; Stewart and Alvarez, 1991) and they are considered as the origin of structure in seismic profiles interpretations (e.g. Novoa et al., 1998; Shaw et al., 2003).
Interference structure refers a typical geometry when two or more monoclinal kink bands intersect and yied distinctive paterns in cross section with anticlines perched above synclines (Shaw et al., 2003). Interference structure can induce complex structures, which sometimes are difficult to explain. Here we present a simple example, interfering developed above two bends in the same fault (Figure 1-13).
In a summary, these structures could help us to understand the geometry in depth and the deformation processes. However, it is worthy to notice that these models are based on two basic assumptions. First, folds are produced by a flexure-slip mechanism so that bed thickness is constant. Second, the footwall remains undeformed during the formation of folds in the hanging wall. Moreover, the deformation in fold-and-thrust belts is always complex and affected by variety kinds of factors. It forces us to analysis local structure with considering every local
Figure 1-13. Interference structures
by two bends above a bended fault (Shaw et al. 2003).
21
characteristic and obtain as much as data in depth, such as seismic profiles and drilled wells.
Chapter 2. Geological setting and history of
Tian Shan
Chapter 2
Geological setting and history of Tian
Shan
25
2.1 Cenozoic tectonics in Asia
Asia constitutes two broad Cenozoic deformation zones: the India-Asia collision zone in the east and the Arabia-Asia collision zone in the west (Yin et al., 2010).
Figure 2-1. Cenozoic structures and distribution of volcanic rocks (Yin et al., 2010).
The India-Asia collision zone consists of the following major tectonic domains: 1) the Himalayan orogen, 2) the Tibetan Plateau, 3) the southeast Asia extrusion system, 4) the Central Asia deformation domain stretching from the Tian Shan in the south to the Baikal rift zone in the North, 5) the North China deformation domain, and 6) the eastern Asia margin deformation domain extending from the eastern continental margin of Asia to the western Pacific trench system in the E-W direction and from the Sea of Okhotsk in the north to South China Sea in the south in the N-S direction (Yin et al., 2010; Figure 2-1). The Arabia-Asia collision zone will not be discussed here in
26 details.
2.1.1 The collision of the India-Asia
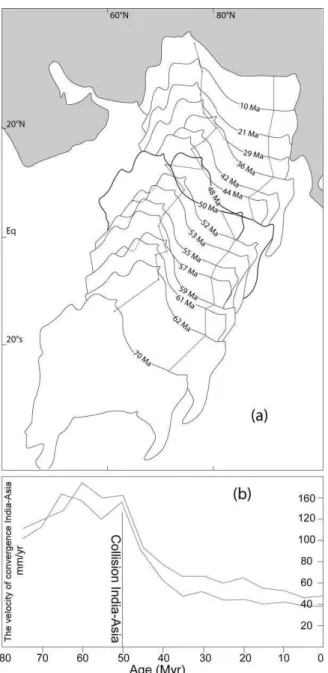
Figure 2-2. (a) Cenozoic northward drift of India, relative motion of India with
respect to Eurasia, kept arbitrarily fixed in its present position. The two traces indicate two points located on the Indian continent near the northern margin. Black-bold outlines indicate the initiation of India-Asia collision. (b) The velocity of the two points above move toward the Asia plate. India-Asia collision time was suggested by the sudden decrease (~ 50 Ma) (Patriat and Achache, 1984; Avouac and DeWver, 2002).
27
The most recent dramatic structure in the earth is the development of the Tibetan plateau resulting from the India-Asia collision, which is firstly documented by paleomagnetic study of Patriat and Achache. (1984; Figure 2-2). The Himalya belt isolates the Indian subcontinent from the rest of Eurasia, with the world’s highest mountain Mount Everest (8844.43 meter in altitude). It is among the youngest mountains of the world, and it is still undergoing structural changes and growing (Sorkhabi, 2003).
However, the onset age of collision India-Asia is still in debates. Stratigraphic research suggested that the western part of Himalayan region the collision age is well constrained as starting in the Late Ypresian (~ <52 Ma). However, the most eastern sections are younger than Lutetian (< 48 Ma) (Rowley, 1996).
Yet, Beck et al. (1995) report that accretionary-prism and trench strata were first thrust onto the northwest Indian passive margin after 66 Myr but before 55.5 Myr, and suggest that suturing was complete by 49 Myr. Yin and Harrison. (2000) reviewed the stratigraphic, paleontologic evidences and age of the Gangdest batholiths, suggesting that the initial collision between India and Asia could have stated as early as the latest Cretaceous time (~ 70 Ma). However, Aitchison et al., (2007) recently suggested by stratigraphic study that the India-Asia collision did not start until about 35 Ma, which is not consistent with most of the geologic observations (Garzanti, 2007).
Though, the exact onset age of the collision remains debated and as it is out of scope of this study, most acceptable range from 65 Ma to ~ 50 Ma (e.g., Rowley, 1996, 1998; Najman et al., 2001; Zhu et al., 2005; Yin, 2010) is referred in this dissertation. Regardless of this uncertainty, the deformation review on the Cenozoic will discussed below.
2.1.2 The deformation by the India-Asia collision
The India-Eurasia collision caused a high stress to be transmitted over a broad area (Molnar et al., 1973). Two end member models of how the high elevations in Tibet formed are (i) continuous thickening and widespread viscous flow of the crust
28
and the mantle of the entire plateau and (ii) time-dependent, localized shear between coherent lithospheric blocks (Tapponnier et al., 1982).
The crustal shortening amount due to the India-Asia collision is mainly controlled by the paleomagnetic studies. Besse et al. (1984) reported that order of 550 km and 400 km convergence amounts were found in suture and intracontinental thrusting respectively between the major Himalayan thrusts and the india-Tibet suture zone. Chen et al. (1993) estimated ~ 2700 km of crustal shortening between India and Siberia and documented that the Tibetan plateau has probably experienced the internal deformation of different scales from 1 to 1000 km. Pozzi and Feinberg. (1991) proposed that the post-collision continental shortening of the north of the Tajik basin did not exceed a few hundred kilometers and was probably between 100 and 300 km. This displacement amounts were absorbed not only by intracontinental thrusting and internal deformation but also by subduction of continental crust and lateral extrusion (Patriat and Achache, 1984). Reconstruction of the initial geometry of the Indian crust shows that at least 670 km of shortening have been accommodated at the scale of the Himalayan belt (e.g., DeCelles et al., 2002).
The crustal shortening due to the India-Asia collision are essentially absorbed by reactivation of the ancient suture zones, such as Kunlun, and Tian Shan ranges (Chen et al., 1993). Quaternary faulting and seismicity show that most of the active deformation of Central Asia is partitioned between thrusting in mountain belts and sliding along great strike-slip faults (Tapponnier and Molnar, 1977; 1979). Avouac and Tapponnier (1993) modeled the velocity field of present-day deformation in Central Asia by four rotating blocks: Siberia, Tarim, Tibet and India on a spherical earth. It implies that nearly all the present convergence between India and Asia can be accounted for by slip-partitioning on these four zones, with as much as 50% absorbed by northeastwards extrusion of Tibet. The resulting deformation of Asia apparently occurred in several discrete phase. Harrison et al. (1992) suggest that rapid uplift and unroofing of southern Tibet began about 20 million years ago and that the present elevation of much of the Tibetan plateau was attained by about 8 million years ago.
29
Zhong and Ding (1996) proposed four stages of uplift from the onset of the collision: 45-38 Ma; 25-17 Ma; 13-8 Ma and 3 Ma-today. A fundamental switch in the latest Oligocene-early Miocene in the tectonic style of the collisional system is suggested by multidisciplinary studies from the collision zone (Hendrix et al., 1994). Numereous studies of the Himalyaya and Tibet suggest a major shift from extrusion-dominated to crustal thickening-dominated tectonics occurred in that time, which is approximaltely coincident with the start of unroofing in the Tian Shan. For example, major left-lateral movement on the Red River fault system of Southeast Asia ceased at ~23 Ma (Tapponnier et al., 1990). Exhumation rates within the Trans-Himalayan batholiths (Copeland et al., 1987; Richter et al., 1991) and parts of the western Himalaya (Zeitler, 1985) increased in that time.
2.2 Geological setting and history of Tian Shan
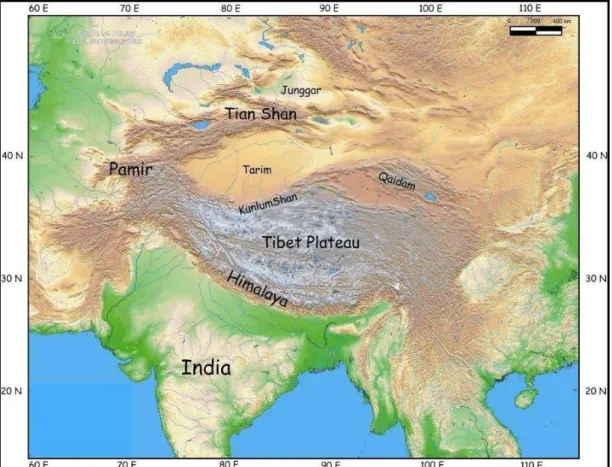
Figure 2-3. The topography of the central and southern Asia. MNT (NASA).
30
Central Asia, over 2500 kilometers in length, with peaks in excess of 7000 meters in elevation. The range locates in the border region of Kazakhstan, Kyrgyzstan and the Xinjiang Uyghur Autonomous Region of western China (Figure 2-3).The highest peak in Tian Shan is the Victory Peak up to 7,439 meters, on the Kyrgyzstan-China border. The eastern part of Tian Shan is bounded by the Junggar basin to the north and Tarim basin to the south.
2.2.1 The origin of basement and Paleozoic assembly of
Tian Shan
The Paleozoic Tian Shan is a major orogenic domain within the Central Asian Orogenic Belt (CAOB) (e.g. Jahn et al., 2000; 2004a; 2004b; Xiao et al., 2004; Kröner et al., 2007; Windley et al., 2007) or Altaid orogenic collage (Sengör et al., 1993; Sengör and Natal’in 1996). It is bounded by the Kazakhstan microcontinent to the northwest, the Junggar basin to the northeast, and the Tarim basin to the south (Coleman 1989; Xiao et al., 1992; Konopelko et al., 2007; Kröner et al., 2008Erreur !
Source du renvoi introuvable.). It extends east-west for over 2500 km and exhibits
the highest relief in Central Asia. The present topography is due to the Tertiary Asia-India collision (Tapponnier et al., 1986; Nelson et al., 1987; Avouac et al., 1993; Sobel and Dumitru 1997). In addition, the Cenozoic tectonism is responsible for the recent northward underthrusting of Tarim below South Chinese Tian Shan, and for the southward underthrusting of Junggar below North Tian Shan (Windley et al., 1990; Avouac et al., 1993; Hendrix et al., 1994; Burchfiel et al., 1999; Allen et al., 1999; Li et al., 2009). From the Neoproterozoic to Paleozoic, accretion of several continental blocks, island arcs and accretionary complexes to the southern margin of Eurasia formed the CAOB, within which the Tian Shan Belt resulted from amalgamation of the Tarim, Junggar and Kazakhstan-Yili blocks and intervening microcontinents (Wang et al., 1994; Gao et al., 1998; Chen et al., 1999; Charvet et al., 2007; Wang et al., 2007; Windley et al., 2007).
31
Figure 2-4. Geological map of the Chinese western Tian Shan belt (after Wang et al., 2008). Numbers in circle refer to the main faults: 1, North
Tian Shan fault (NTF); 2, Main Tian Shan shear zone (MTSZ); 3, Qingbulak-Nalati fault (QNF); 4, Sangshuyuanzi fault; 5, Jinghe fault. Inset shows location of the Tian Shan Belt in Central Asia (modified from Jahn, 2004). Abbreviations: CAOB, Central Asian Orogenic Belt; EEC, Eastern European Craton; KZN, Kazakhstan; QQ, Qaidam-Qinling.
32
According to previous works (e.g. Windley et al., 1990; Allen et al., 1993; Gao et al., 1998; Chen et al., 1999), several ophiolitic belts have been used to define an Early Paleozoic South Tian Shan Suture (STSS, corresponding to faults 3 and 4 in Erreur !
Source du renvoi introuvable.) and a Late Paleozoic North Tian Shan suture (NTSS,
corresponding to faults 1 and 2 in Erreur ! Source du renvoi introuvable.), dividing the Chinese Tian Shan belt into North Tian Shan, Central Tian Shan and South Tian Shan zones. In the literature, there is often a confusion on the suture zone that represents an initial plate boundary and also the strike-slip fault resulted from a reworking of the plate boundaries during Permian, i.e. after accretion and collision.
In addition, the tectonic evolution of this complex orogen remains controversial, and numerous geodynamic models have been proposed since the last two decades. According to Coleman (1989), the Tian Shan resulted from the closure of an oceanic basin during the early Paleozoic. Ma et al. (1993) suggested that the southern Tian Shan evolved from a back-arc basin that formed by southward subduction of the Paleo-Junggar Oceanic lithosphere, whereas Cao et al. (1992) considered that the southern Tian Shan represents oceanic crust thrust to the south upon the Tarim Block during the late Paleozoic. According to Windley et al. (1990) and Allen et al. (1993), in the eastern Chinese Tian Shan, the north-directed subduction occurred during the late Devonian-early Carboniferous along the STSS and the south-directed subduction occurred in late Carboniferous-early Permian time along the NTSS. In western Tian Shan, Gao et al. (1995, 1998) proposed a north-directed subduction along the southern Tian Shan suture zone. According to Chen et al. (1999), the southern Tian Shan was originated from the closure of an early Paleozoic ocean located between Tarim and the Central Tian Shan and subsequent late Paleozoic oblique collision. More recently, Charvet et al. (2007), Wang et al. (2008) argued that the Paleozoic Chinese Tian Shan is a polyorogenic belt formed by the closure of three oceanic basins that separated four continental blocks, namely from north to south, Junggar, Yili-North Tian Shan, Central Tian Shan, and Tarim. The three subduction systems were not coeval, but all directed to the south. However, these models are often controversies, many of them
33 are still in debates.
(a) The Altaid tectonic collage
Sengor (1993) suggested that all the independent orogens within the Altaid edifice, including Tian Shan, have evolved dominantly along a single subduction zone that developed during the Cambrian along the eastern margin of a unified Baltico-Siberian continent. Most units are bounded by large strike-slip faults. Passive consolidation of the southern margin of Paleo-Asia is marked by accretion and subduction of the Paleo-Tethys oceanic basins and by development of volcanic arcs. It highlighted the function of strike-slips and the continental growth in the evolution processes, which is different from Alps and in the Himalaya belts (Sengor and Natal’in, 1996; Figure 2-5).
Figure 2-5. Simplified and generalized tectonic map of the Altaids and related
surrounding units. Numbers refer to different geological units (see reference Sengor and Natal’in, 1996).
34
(b) Multi-subduction and collision
An alternative model of with the Altaid model concerns multi-subduction and collision ones are proposed by different authors based on different evidences (Windley et la., 1990; Allen et al., 1993; Gao et al., 1998; Laurent-Charvet, 2001; Xiao et al., 2004; Wang et al., 2008). The all highlight the function of multi-subductions, arcs and collisions in the evolution of the Paleozoic Tian Shan. However, several important issues are still under debate, such as the suture locations, the age of (U) HP metamorphism and the polarity of subduction and so on. A recent geodynamic model seems to be commonly recognized during the international field excursion and workshop in Urumqi, China on the Paleozoic Tian Shan evolution (September 9-18, 2009, Wang et al., 2010Erreur ! Source du renvoi introuvable.). It may be briefly described as follows.
(1) Early Paleozoic closure of the Central Tian Shan Ocean.
The oceanic basin separating the Tarim and Kazakh-Yili-North Tian Shan block began to close in the Ordovician. The closure was due to a south-directed subduction below the Tarim block. Later, the northern margin of the Tarim block suffered extensional tectonism that resulted in the formation of the South Tian Shan back-arc basin during Late Silurian-Middle Devonian (Figure 2-6 (1)).
(2) Devonian-Early Carboniferous collision between the Kazakh-Yili-North Tian Shan and Central Tian Shan blocks.
This early collision in the evolution of the Tian Shan orogen was responsible for the development of the high to ultra-high pressure metamorphism along the Central Tian Shan suture. The collision was followed by oceanic lithosphere consumption, deep subduction and coeval with top-to-the-North ductile shearing (Figure 2-6 (2)).
35
Figure 2-6. A multi-subductins and collisions geodynamic evolution model for the
36
(3) Early Carboniferous closure of the South Tian Shan back-arc basin, and formation of the North Tian Shan magmatic arc.
The welding of the Kazakh-Yili-North Tian Shan and Central Tian Shan blocks collided with the Tarim block and induced closure of the South Tian Shan back-arc basin. Southern Tian Shan ophiolitic mélange formed by sedimentary rocks (chert, siliceous mudstone, limestone), remnants the oceanic crust (pillow lava, diabase, gabbro), and the underlying mantle (serpentinized peridotite) of the South Tian Shan back-arc basin mixed together with sedimentary rocks of the Tarim block. This unit crops out as klippes emplaced from South to North upon the Central Tian Shan block in the current Tian Shan. Furthern north, high pressure eclogitic rocks along the Central Tian Shan suture are retrogressed into greenschist facies during their exhumation. Finally, the northern boundary of the Kazakh-Yili-North Tian Shan became an active margin along the North Tian Shan accretionary complex, coeval with the North Tian Shan ophiolitic melange, and the North Tian Shan magmatic arc developed (Figure 2-6 (3)).
(4) Late Carboniferous tectonics in the Kazakh-Yili-North Tian Shan block. During this period, Most of the tectonic activity was located in the Kazakh-Yili-North Tian Shan block. The end of North Tian Shan arc magmatism is probably the consequence of subduction of the continental part of the Junggar basement. Late Carboniferous sedimentation was characterised by shallow marine terrigeneous and carbonated rocks in the Central Tian Shan. South-directed thrusts and folds that developed in the Kazakh-Yili-North Tian Shan and Central Tian Shan blocks can be considered as back-folding and back-thrusting due to the north Tian Shan subduction (Figure 2-6 (4)).
(5) Permian dextral strike-slip faulting.
During the end of the Carboniferous, the various tectonic elements, including magmatic arcs, continental blocks, and ophiolitic melanges, were already welded together. Later in Permian, all these units experienced major dextral wrenching parallel to the strike of the orogen. The Altai Fold Belt underwent sinistral strike-slip
37
faulting to the norther. The two strike-slip systems accommodated an opposite motion of Tarim and Siberia as suggested by paleomagnetism studies. This strike-slip tectonics was accompanied by pull-apart basin opening and post-tectonic magmatism expressed by volcanic rocks and granitic plutons. The coeval emplacement of Permian calc-alkaline and alkaline suites suggest the influence of the mantle metasomatism during the Carboniferous subduction (Figure 2-6 (5)).
During the Mesozoic, deformation resumed, as documented by Triassic and Jurassic unconformities. But these tectonic events were purely intracontinental, like the Cenozoic event responding to the Asia-India collision.
2.2.2 Mesozoic activity and inactivity
Up to now, most of the previous studies in Tian Shan focused on either the Paleozoic evolution of the range linked to the agglomeration of Central Asia and the accretion of Central Asia Orogenic Belt or its Cenozoic intracontinental evolution linked with the India-Asia collision. Few studies found in the literature essentially concern the sedimentological studies on Mesozoic sediments of these basins adjacent to the Tian Shan (Hendrix et al., 1992, 2000; Li et al., 2004, 2010). The Mesozoic of the Tian Shan are poorly studied. Explanation for the regional Jurassic sedimentation is at odds. Some Chinese geologists have the hypothesis of a Mesozoic Tian Shan (Huang 1978; 1949) with long time. They proposed that the Mesozoic-Tian Shan was the remains of eugeosynclinal variscides and less lofty by erosion, associated by intermountain basins interior. Watson et al. (1987) proposed that the Tarim and Junggar Basins were flexural, foreland basins in the Jurassic, loaded by thrusts originating within the orogenic belts at their margins.
38
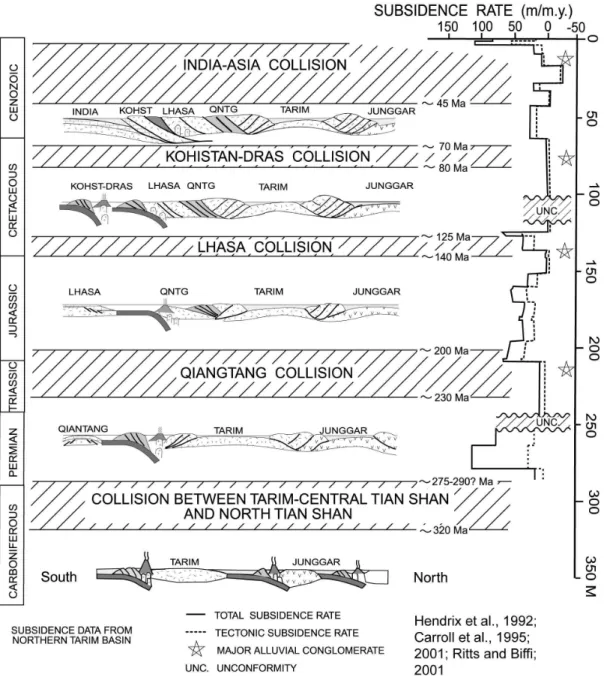
Figure 2-7. Summary diagram of indicators of timing of deformation in Chinese Tian
shan. Subsidence history in northern Tarim basin shows rapid subsidence during collisions at southern margin of Asia (After Dumitru et al., 2001).
Several stratigraphic evidences suggest that the Junggar and Tarim basins continued to be physiographically separated by the ancestral Tian Shan during Mesozoic contractile deformation (Hendrix et al., 1992; Figure 2-7). However, basing on Jurassic basins without fault control, Allen et al. (1991) suggested that it was proceeded a phase of thermal subsidence associate with fluvial and lacustrine sedimentation throughout the Jurassic, Cretaceous and early Tertiary. Shu et al. (2004)
39
take notice of the coaly Jurassic deposited widely even in the Tian Shan without molasse of marginal facies. He proposed that in the interval of Jurassic-Paleogene, extensional tectonic activity within plate split the peneplaned Tian Shan region into a series of sub-E-W-striking extensional basins. Jia et al. (1997) related the Chinese northwest basins to the evolution of the Tethyan orogenic belt. He proposed the extension in early to middle Jurassic, whereas compression in latest later Jurassic to Cretaceous.
Low temperature thermochronology approach (fission tracks and (U-Th)/He) is widely used to constrain the Triassic to present history of the range. The thermochronolgy ages distributed in various periods during Mesozoic and Cenozoic (Dumitru et al., 2001; Wang et al., 2009; Jolivet et al., in press). These ages indicate the multiphase uplifting in the Tian Shan area. It is noteworthy that the ages vary along the orogen strike in the Tian Shan and difference between the northern and southern sides along faults (Figure 2-8).
Figure 2-8. Low temperature thermochronology ages in the Tian Shan area. The
numbers denote the cooling ages (Ma). Red lines are the faults in the mountain basement (faults from XBGMR, 1993).
40
2.2.3 The current Tian Shan
(a) Seism
Figure 2-9. Seismicity map of the Tian Shan (IRIS).
The biggest documented earthquakes in Tian Shan took place on Decembre 3rd, 1906, with M≈8, in Manasi area, north piedmont of Tian Shan (Molnar and Deng, 1984; Avouac et al., 1993; Wang et al., 2004). Field investigations indicate that this earthquake occurred along a blind thrust fault (Deng et al., 2004).
Figure 2-9. presents about 500 seisms in Tian Shan area science 1965 (M≥5;
82°-88.5°E in longitude; 40.5°-45°N in Latitude;
http://www.iris.edu/data/event/eventsearch.htm). This map show that the deformation in the Tian Shan is mainly located in both the northern and southern fronts. Seismic moment tensors of major earthquakes in this century suggest an average shortening rate of 7 (± 2) mm yr-1 across the Tian Shan (Molnar and Ghose, 2000).
41
(b) GPS measurement
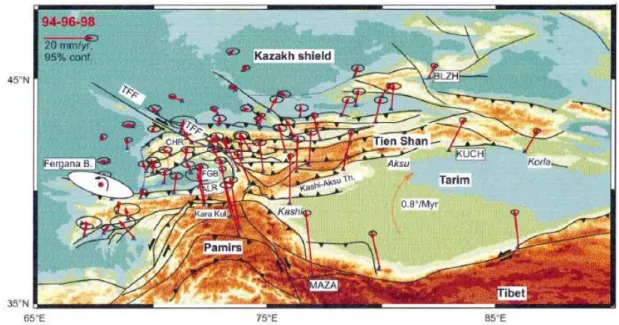
Figure 2-10. GPS vectors with respect to stable Eurasia. Fergana B.: Rotation pole of
FGB, TFF: Talas Fergana Fault, CHR: Chatkal range, ALR: Alai range (Reigber et al., 2001).
GPS (Global Positioning System) is used to measure the present-day kinematics of deformation on the surface of earth. The results of GPS network in the Republics of Kyrgyzstan and Kazakhstan suggest that the total shortening of Tian Shan is approximately 20 mm yr-1. This result also indicates that most of Tian Shan has been constructed during the past 10 Myr (Abdrakhmatov et al., 1996). Later, more dense GPS network measurement suggested 20 mm/yr N-S shorting rate in the west of Tian Shan and 10 mm/yr in Chinese Tian Shan (Reigber et al., 2001; Figure 2-10). Chinese GPS measurements taken from 1992 to 2006 in the Tian Shan mountains and their adjacent areas show that slip rates on east-west trending detachment vary from 10-13 mm/yr in the southwest of Chinese Tian Shan to 2-5 mm/yr in western Chinese Tian Shan (Yang et al., 2008). The rotation clockwise of Tarim basin was proposed by paleomagnetic results and structural analyses with the pole in the west of Tian Shan (Chen et al., 1991; Avouac et al., 1993), which is corresponding to the GPS results (Reigber et al., 2001).
42
(c) The deformation along the piedmont.
Based on fault scarp offsets (10.2±0.7m) and the Holocene age (10±2 kyr) for highest terrace surface, Avouac et al., (1993) proposed the surface shortening rate is about 1.25±0.5 mm/yr and the mean depth shortening rate have been 3.0±1.5 mm/yr. They also estimated the Cenozic shortening amount was the order of 30 km in the northern piedmont Cenozoic shortening, assuming with an imaged antiformal stacking in the front. The differences of relative heights between two terraces could reach 100 to 120 m over the crests of anticlines in the northern piedmont, Morlnar et al., (1994) infer that this spacing is due to alternating stages of valley widening and rapid incision associated with climate changes with a periodicity of 100 kyr. Hence, the average vertical rate of is about 1 mm/yr. Burchfiel et al., (1999) constructed four cross-sections in the northern piedmont of Tian Shan, the southern part of the Hutubi River, Tugulu anticline, Tuositai anticline and Dushanzi anticline. The balanced cross-sections show that the shortening amounts are 6.2km, 5.5km, 4.6-5.0 km and 2.12-2.35 km respectively. Calculating large-scale shortening rate is difficult, because the four profiles are spare and not lined. Moreover, their structures are active and laterally vary significantly. The range interior is poorly studied as well. A minimum shortening rate of >5.7 to 7.2 mm/yr was proposed assuming the time of initiation of deformation is 2.5 Ma (Burchfiel et al., 1999).
Along the southern piedmont, at least 20-40 km of crustal shortening with a hozizontal shortening strain of 20-30% was proposed by Yin et al. (1998). It was suggested that these estimates are minimum because of both conservative extrapolation of the thrust geometries and partial coverage of the thrust belt by the cross sections. A shortening strain of 1.0-1.9 mm yr-1 was obtained, assuming the initiation thrust begin about 21-24 Ma (Yin et al., 1998). Burchfiel et al. (1999) constructed cross-sections of Kalasu River, Qiulitage anticline in the west part and Boston Tokar in the east and suggested the shortening of 12-14 km, 6-7 km and 10.3-13.0 km, respectively. Deng et al (2000) applied system studies in the Tian Shan
43
area on the active tectonics. Based on geological mapping and technique of balanced cross-section, the amounts of shortening in Tulufan, Urumqi and Kuche foreland basins are calculated with 10-12 km, 17 km and 23 km respectively.
The reason of these diversity values of shortening amounts and rate are due to lacking of reliable geometry data in depth, such as seismic profiles or other geophysics data. Most of the cross-sections are constructed by surface observations, combining with theoretical models.
2.3 Problems and methodology
The northern and southern piedmonts of Tian Shan are characterized by foreland thrust-and-fold belts, which are the key areas to understand the multiphase mountain building. Geodesic measurement shows the decrease GPS velocity from the southern Tibet plateau, to the northern Tian Shan area (Reigber et al., 2001; Wang et al., 2001; Niu et al., 2007; Figure 2-10). The northern piedmont of Tian Shan has been proposed to be the north end of the far-effect by India-Asia collision (Tapponnier and Molnar., 1977; Avouac et al., 1993; Tapponnier, 2001). Within the northern piedmont depression of Tian Shan, three sub-parallel fold belts prolong along east-west strikes due to the north-south convergence. North-flowing rivers incise the anticlines perpendicular to strike where they expose successions of deposited series. Magnetostratigraphy studies have been carried out in the Cenozoic series of some of these anticlines to find out the sedimentary rates and defined the growth strata ages (Charreau et al., 2005; 2006; 2008; 2009; Sun et al., 2004; Huang et al., 2006; Ji et al., 2008; Li et al., 2010; Lu et al., 2010). Numerous petroleum seismic profiles and drilled wells are located in this area by profit-driven. Furthermore, the structural and the sedimentary characteristics in the northern piedmont of Tian Shan may offer direct evidences of the far-effect by India-Asia collision and the Cenozoic tectonic evolution history of Central Asia. This is the the reason why we chose the northern piedmont of Tian Shan as the study area. Up to now, structural studies along the northern front of Tian Shan are mostly modern–driven than data-driven (Avouac et al., 1993; Burchfiel
44
et al., 1999), which were essentially based on surface studies. The structural profile published from seismic profiles lack often surface constraints and, moreover, with limited extent to the piedmont of Tian Shan that may make missing of information on the contact between the range basement and basin cover (Wang et al., 2005; Chen et al., 2007; Lu et al., 2007). The results from previous studies by different methods are often therefore contradictory, such as shortening rates along the northern piedmont (Avouac et al., 1993; Burchfiel et al., 1999; Deng et al., 2000). This study focuses on the field observations along the northern front of Tian Shan, especially in the contact zones between the mountain basement and basin sediments, to define their tectonic and geometric relationships. Following major problematic subjects are evoked in this study:
1, What are the relationships between the Paleozoic mountain basement and the Meso-Cenozoic basin sediments in the northern front of Tian Shan?
2, What is the nature of Tian Shan during Mesozoic as most of previous studies are concentrated on its Paleozoic and Cenozoic histories? Moreover, a good understanding on its Mesozoic nature will help to recognize better the Cenozoic evolution of Tian Shan;
3, Consequently, how much the deformation has occurred due to the Cenozoic tectonics along the northern piedmont of Tian Shan?
4, What is the mechanism of the Cenozoic deformation in the northern piedmont of Tian Shan?
To answer these questions, multidisciplinary studies are carried out in the northern piedmont of Tian Shan. Two types of the data are obtained, the surface and subsurface data (Figure 2-11). The surface data consist of (1) available geological maps, which were digitized in Arcgis (ESRI) with geological limits, faults, strikes and dip angles. (2) detailed geological observations made in the northern front of Tian Shan. Subsurface data consist of available seismic profiles and drilled wells. For following reasons, the gravity measurements have been carried out along certain profiles and then integrated into subsurface data, (1) Outcrops cannot be continuously
45
observed in the field because of the important Cenozoic cover; (2) Seismic profiles are often limited in the basin and there is no any data available on the depth close to the mountain; (3). Seismic method becomes less sensitive to the strongly deformed zone. These gravimetric data are treated to Bouguer anomaly and two dimensional (2D) forward gravity modeling has been performed using the Geosoft-GM-SYS software. With these surface and sub-surface data, a 3D model of the northern piedmont of Tian Shan is possible to construct with Geomodeller or Gocad softwares (Figure 2-11, see Annexes).
Chapter 3. The Mesozoic paleo-relief of the
northern Tian Shan - submitted manuscript
Chapter 3
The Mesozoic paleo-relief of the northern
Tian Shan - submitted manuscript
49
The Mesozoic Paleo-relief of the Northern
Tian Shan –
submitted manuscript
Ke CHEN1,2, Charles GUMIAUX1, Romain AUGIER1, Yan CHEN1, Qingchen WANG 2, Wei LIN2 , Shengli WANG3 ,
1 Université d'Orléans, CNRS/INSU, Université François Rabelais - Tours, Institut des Sciences de la Terre d'Orléans - UMR6113, Campus Géosciences, 1A rue de la Férollerie, 45071 Orléans cedex2, France
3 State Key Laboratory of Lithospheric Evolution, Institute of Geology and Geophysics, Chinese Academy of Sciences, P.O. 9825, Beijing 100029, China 3 Department of Earth Sciences, Nanjing University, 210093, Nanjing, China
3.1 Abstract
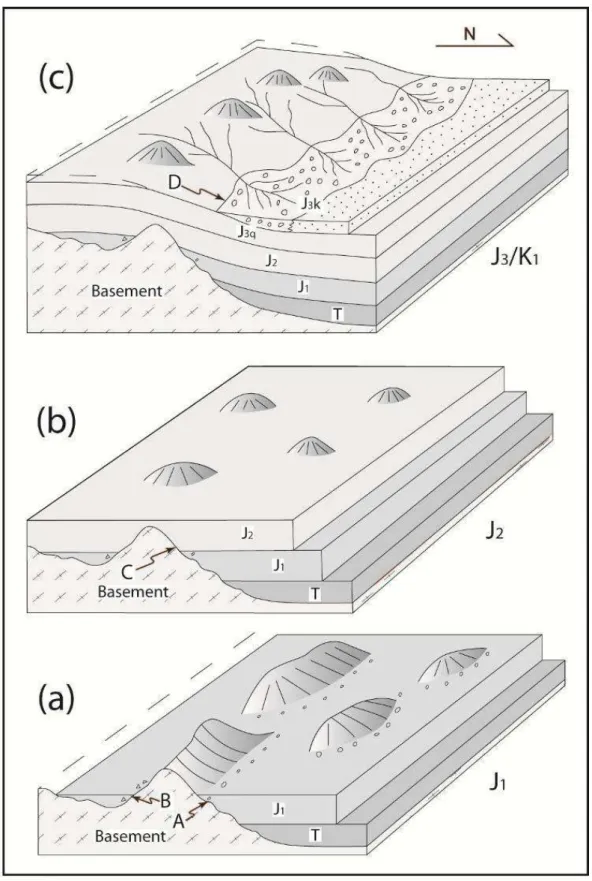
The Tian Shan mountain range offers a natural laboratory to study orogenic processes. Most of the previous studies focused on either the Paleozoic evolution of the range or its Cenozoic intracontinental evolution linked with the India-Asia collision. In this study, detailed stratigraphic and structural investigations on the relationship between sedimentary cover and basement allow to constrain the Mesozoic evolution of Northern Tian Shan. Stratigraphic field observations argue for Jurassic sedimentation with very limited transport in certain places of the range front. Sections presented in this paper show that, in some locations, Triassic to Jurassic sedimentary series present a continuous onlap type sedimentary unconformity on the top of the basement. At different scales, observations clearly evidence the existence of a major paleo-relief during Mesozoic. According to the present study, the actual Tian Shan nature and the associated movements along its northern front structures cannot be considered as the consequence of Cenozoic reactivation alone.
3.2 Introduction
50
The current structure of the Tian Shan results from two principal tectonic phases: i) subductions, arc-accretions and continental collision during Paleozoic (e.g. Windley et al., 1990; Söngor et al., 1993; Gao et al., 1998; Laurent-Charvet et al., 2002; Charvet et al., 2007; Wang et al., 2007) and ii) intracontinental reactivation linked with the India-Asia collision, during Cenozoic (e.g. Tapponnier and Molnar, 1977; Avouac et al., 1993). At first order, this finite structure displays a remarkable uprising of Paleozoic ‘basement’ rocks – as a crustal-scale ‘pop-up’ – surrounded by two closed intracontinental basins (Figure 3-1). The present-day high topography of the Tian Shan, with a mean altitude of ~2500m and summit of more than 7000m, is traditionally related to the latest intracontinental reactivation of the range (e.g. Tapponnier and Molnar, 1977; Avouac et al., 1993). Ages constraints for the onset of this intracontinental reactivation range from 10 Ma to 24Ma (Avouac et al., 1993; Hendrix et al., 1994; Abdrakhmatov et al., 1996; Métivier and Gaudemer, 1997; Sobel et al., 1997; Dumitru et al., 2001; Charreau et al., 2009). In spite of this relative age discrepancies mostly related to the method applied, all ages estimated for the deformation and the associated relief erosion suggest that the mountain range reactivation and relief creation began during Early Miocene at oldest.
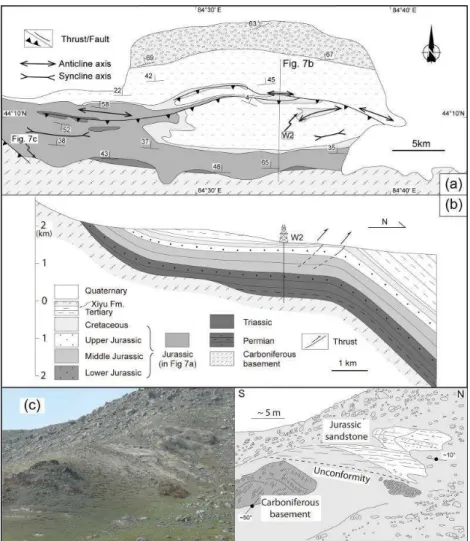
Figure 3-1. Simplified geological map of the northern Tian Shan from Wusu to
Urumqi area. Mesozoic series are most exposed in the southernmost parts of the Junggar basin along the adjacent Tian Shan range. ‘He’ indicates river in Chinese (geological map modified after He et al., 2005).
51
However, recent fission track analyses suggest that uplifting may have existed well before the onset of the Tertiary reactivation through Tian Shan, with exhumation ages as: 160-120Ma in central Tian Shan, 200-250 Ma detritus cooling age in the Manasi River valley (Dumitru et al., 2001) or 140-120Ma from Bayanbulak intracontinental basin, in the southern Tian Shan (Wang et al., 2009). Moreover, Triassic to Cretaceous sediments are composed of thick series often coarse grained continental sediments within both foreland basins, suggesting rather high erosion rate at that time (Hendrix et al., 2000; Carroll et al., 2010).
This study considers the Mesozoic tectonic and morphologic evolution of Tian Shan through a combined stratigraphic and structural analysis of Mesozoic deposits. It focuses on the northern piedmont of the range, along a ~280Km west-east trending segment (Figure 3-1); thanks to deep incisions of seasonal rivers, contacts between Paleozoic basement and Mesozoic-Cenozoic sedimentary cover are particularly well exposed along several north trending sections in this region (Figure 3-1). A better understanding of the Mesozoic Tian Shan would lead to highlight the real role of Cenozoic tectonics and the relative contribution of the paleo-topographic remained in the mountain range building.
Figure 3-2. Synthetic
stratigraphic log of the study area (Modified after Hendrix et al., 1992). The Mesozoic lie unconformably over the Paleozoic basement.
52
3.3 Stratigraphy of Mesozoic sediments within the
study area
Sedimentary series can be extensively observed and have already been studied within the Junggar basin, as summarized below (Figure 3-1 and Figure 3-2; Hendrix et al., 1992 and references therein; XBGMR, 1993). Basement units of the north Tian Shan mainly consist of Paleozoic volcanic and sedimentary rocks. From bottom to top, the entire Mesozoic series is composed of continental clastic deposits (Figure 3- 2). In the study area, the Triassic series is mostly missing along the piedmont though locally exposed (Figure 3-1). Where it crops out Triassic displays alluvial or braided-fluvial sandstone and siltstone intercalated with conglomerate and mudstone.
Figure 3-3. Landscape pictures of representative features of the Mesozoic series (see position in the Fig.1) (a) Coarse-grained conglomerate bars in the lowermost Jurassic (southern Qingshui He area); (b) Uppermost Jurassic breccias (J3k) unconformably overlie the Upper Jurassic Qigu formation (Hutubi He area); (c) Detailed view of the Uppermost Jurassic breccias (west to Hutubi He area).
53
Lowermost Jurassic layers are characterized by thick and coarse conglomeratic layers which can be observed in numerous places along the northern front of Tian Shan, as to the south of Qingshui He (Figure 3-3a). Lower Jurassic thickness reaches 1000m over an area extending from Manasi to Urumuqi, and decreases westwardly and eastwardly. Series become finer upward, grading into a very thick series of Lower/Middle Jurassic gray sandstone, siltstone and shale (Figure 3-2). Middle Jurassic sandstone and mudstone locally contains very rich coal layers consistent with a lacustrine environment deposit (Hendrix et al., 1992). Upper Jurassic comprises typical fine-grained red beds. Transition from Jurassic to Cretaceous series is marked by up to 800m thick breccias (Kalaza formation; Figure 3-3b). Clasts forming these particular layers are dark, 5 to 30 cm in width and display highly angular shapes (Figure3-3c) suggesting very short transport distances of material before deposition. The basal contact of this formation is sharp and often presents unconformity on top of the finer-grained Upper Jurassic red beds (Fig3-3b). The Kalaza formation laterally grades to finer deposits and is exclusively made of sandstone within the Junggar basin itself.
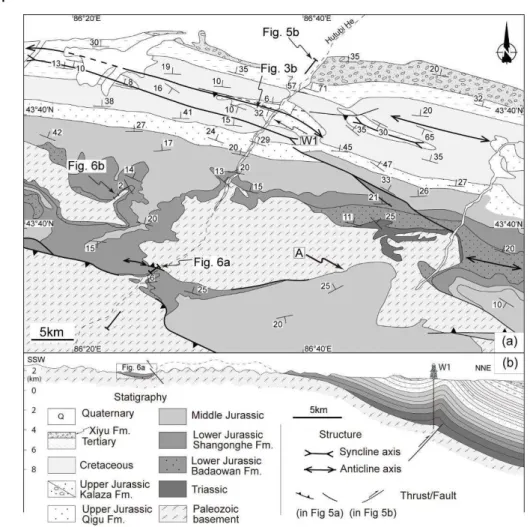
In this study, Mesozoic sediments have also been extensively observed within internal parts of the range, and more particularly in the eastern half part of the study area (Figure 3-1). Triassic to Jurassic sediments lying in direct contact with the Paleozoic basement can be found at rather high altitudes (2000 to 3000 m) in comparison with the mean altitude of the foreland fold-and-thrust belts (1000 to 1500 m high). In the Houxia valley – 65km SSW of Urumuqi – a Lower to Upper Jurassic continuous sedimentary series is preserved in a syncline structure (Figure 1-4a). According to the map (Figure 4-4a; XBGMR, 1993), a south verging thrust developed along one limited central segment of the northern limb of the fold while, elsewhere, sediments unconformably rest on top of the Carboniferous volcanic sediments. Besides, according to the geological map, Lower Jurassic formations directly lie on top of basement units to the northwest, with no preserved sediments owning to Triassic or to the lowermost Jurassic formation (Figure 3-4a). Along a
54
section made to the north of the syncline, in a small south trending valley, sedimentary
series can be continuously observed with no internal structural contact. To the south, its upper and main part is composed of fine grained sandstone with mudstone layers with a constant stratification dip-angle of about 30˚ to the south. To the north, stratifications progressively straighten up and overturned below the thrust displayed on the map (Figure 3-4a, b).
Figure 3-4. Structural and sedimentological features of the Houxia area (a)