Publisher’s version / Version de l'éditeur:
Technical Note (National Research Council of Canada. Division of Building Research), 1973-10-01
READ THESE TERMS AND CONDITIONS CAREFULLY BEFORE USING THIS WEBSITE.
https://nrc-publications.canada.ca/eng/copyright
Vous avez des questions? Nous pouvons vous aider. Pour communiquer directement avec un auteur, consultez la
première page de la revue dans laquelle son article a été publié afin de trouver ses coordonnées. Si vous n’arrivez pas à les repérer, communiquez avec nous à PublicationsArchive-ArchivesPublications@nrc-cnrc.gc.ca.
Questions? Contact the NRC Publications Archive team at
PublicationsArchive-ArchivesPublications@nrc-cnrc.gc.ca. If you wish to email the authors directly, please see the first page of the publication for their contact information.
NRC Publications Archive
Archives des publications du CNRC
For the publisher’s version, please access the DOI link below./ Pour consulter la version de l’éditeur, utilisez le lien DOI ci-dessous.
https://doi.org/10.4224/20338477
Access and use of this website and the material on it are subject to the Terms and Conditions set forth at
Performance of the Mark IX Steel Basement to 31 March 1973
Hamilton, J. J.; Tao, S. S.
https://publications-cnrc.canada.ca/fra/droits
L’accès à ce site Web et l’utilisation de son contenu sont assujettis aux conditions présentées dans le site
LISEZ CES CONDITIONS ATTENTIVEMENT AVANT D’UTILISER CE SITE WEB.
NRC Publications Record / Notice d'Archives des publications de CNRC: https://nrc-publications.canada.ca/eng/view/object/?id=319449f7-a7bc-43ae-8c82-30e541f45662 https://publications-cnrc.canada.ca/fra/voir/objet/?id=319449f7-a7bc-43ae-8c82-30e541f45662
'
..
DIVISION OF BUILDING RESEARCH
No.
579.-"
NOTE
4.. - .J"
'If
E
C
lHIIV ][ CAlL
NATIONAL RESEARCH COUNCIL OF CANADA
". - i _ }..•セ\ PREPARED BY J. J. Hamilton and S. S. Tao CHECKED BY CBC APPROVED BY NBH セ October 1973
PREPARED FOR General Distribution
SUBJECT
PERFORMANCE OF THE MARK IX STEEL BASEMENT TO 31 MARCH 1973
In response to an invitation from the Research Committee of the Housing and Urban Development Association of Regina, the Prairie Regional Station of the Division of Building Research is conducting
a.
performance study of the steel basement of the Mark IX research house. The results of many observations taken throughout construction in the spring of 1972 and its subsequent perform.ance to the end of March 1973 are summarized in this Note.INSTRUMENTATION
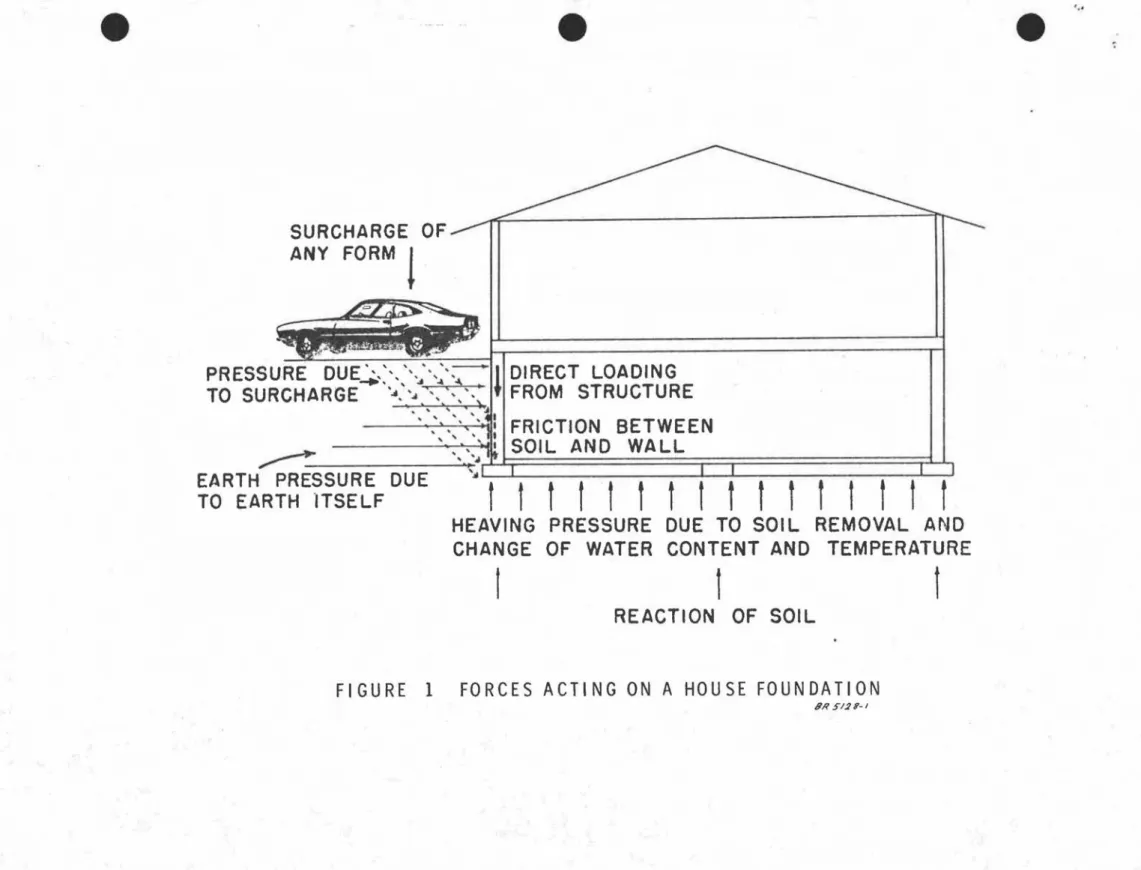
The types of instruments installed and the objectives of the measurements at the Mark IX research house were outlined in Technical
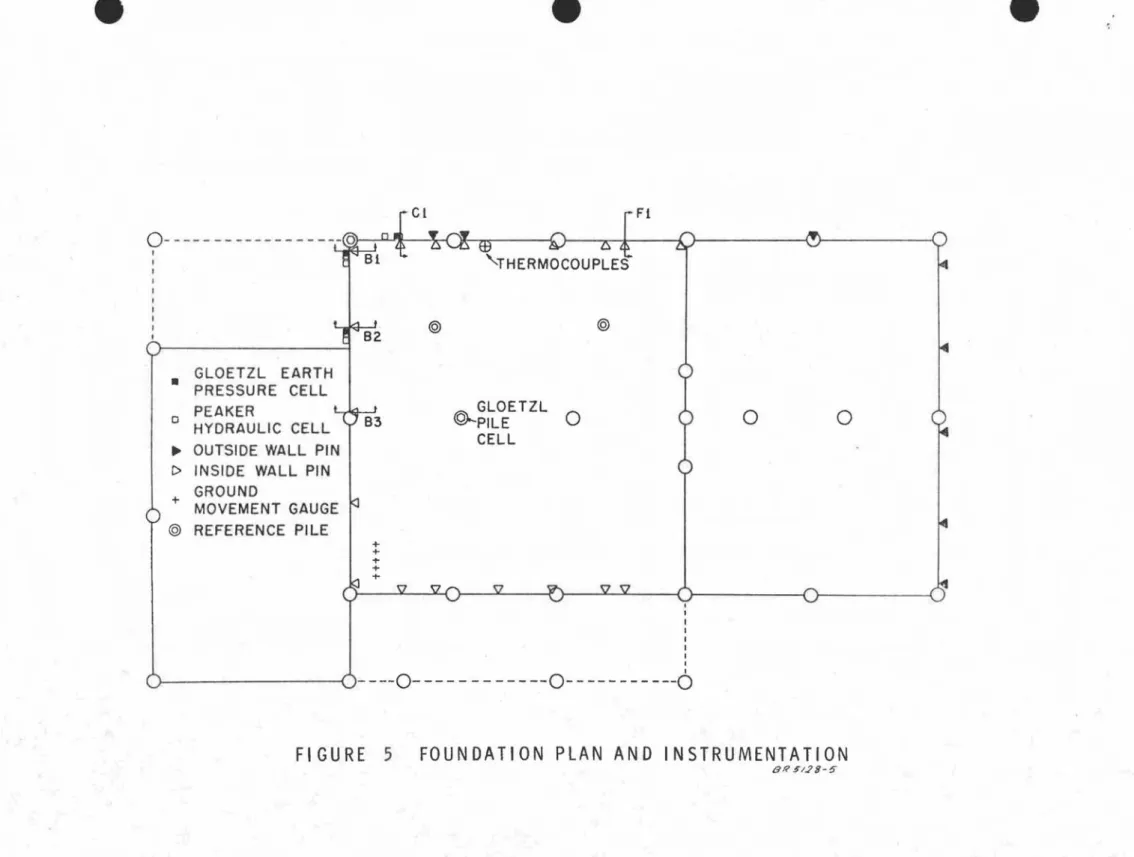
Note 566. The present Note shows schematically the forces acting on a typical house basement and the pressure and deflection measuring instru-mentation installed in the walls of the basement (Figures 1 to 4). The various items of instrumentation are listed in Table I and located in plan view on Figure 5. Typical wall cross-sections in Figures 6 to 14 further illustrate the positioning of the instrumentation.
RESULTS OF MEASUREMENTS TO 31 MARCH 1973
Although some significant results cannot be obtained for many months until long-term equilibrium conditions have been established and several seasonal cycles have occurred. some results of measurements taken during construction and to 31 March 1973.
2
-As was expected. the vertical movements of the walls. floors. foundation units and subsoil beneath the crawl space. have proven to be insignificant. Typical horizontal movements and earth pressures mea-sured along the west and north walls are presented in Figures 6 to 10. Typical temperature measurements taken at various locations through the insulated basement wall are shown in Figures 11 to 14. Unfortunately. no severely cold weather took place during the period stUdied.
EARTH PRESSURES AND BASEMENT WALL MOVEMENTS
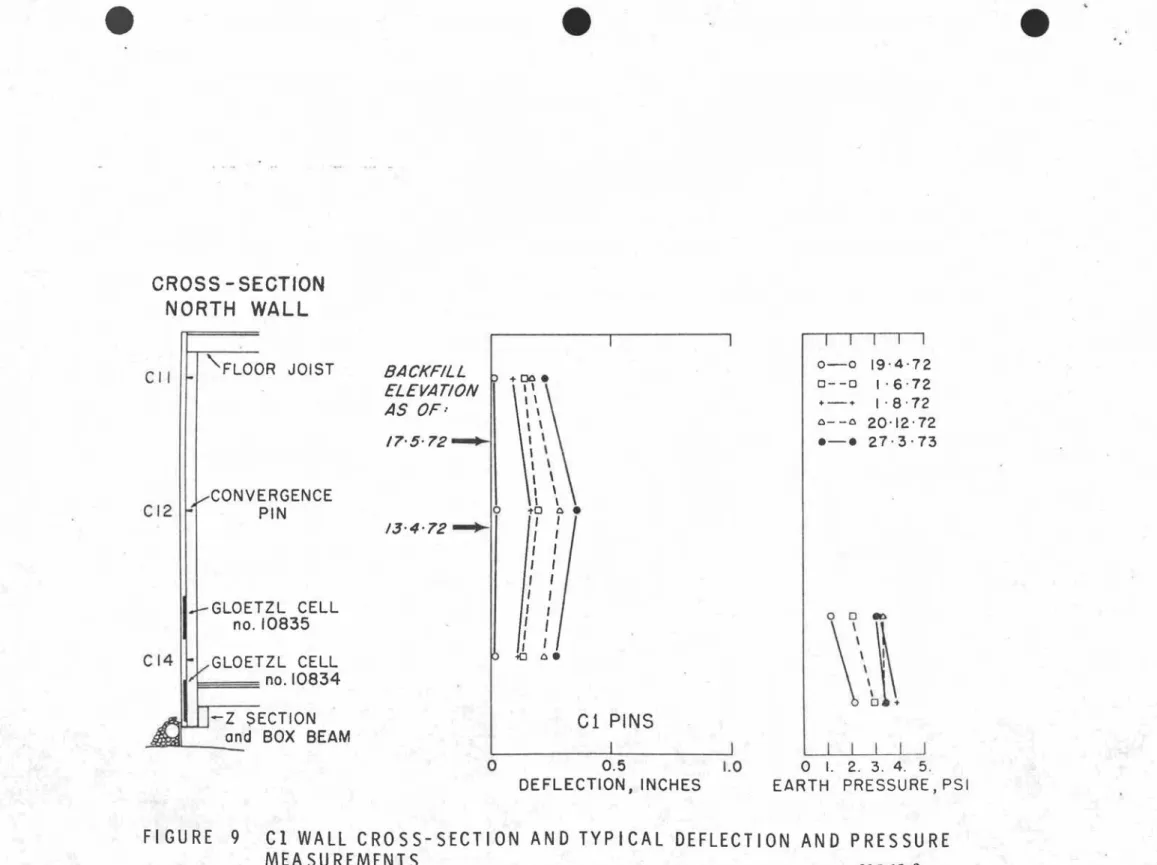
It is common practice to use the equivalent-fluid method when designing shallow basement walls to retain clay backfill. The wall is designed to withstand pressure of a liquid that is assumed to exert a pressure equivalent to that of the real backfill. In Western Canada it is often assumed that clay backfills have equivalent -fluid unit weights':c of between 60 and 65 lb/cu ft. The maximum earth pressures measured to date at the Mark IX have been considerably higher, at least for short periods of time. For the 20 December 1972 reading at Section CI, depth 4. 06 ft below outside grade, the eqUivalent -fluid unit weight was calculated to be 113 Ib/cu ft. High equivalent-fluid weights in excess of 100 Ib/cu ft have been constant at this section since eary August 1972.
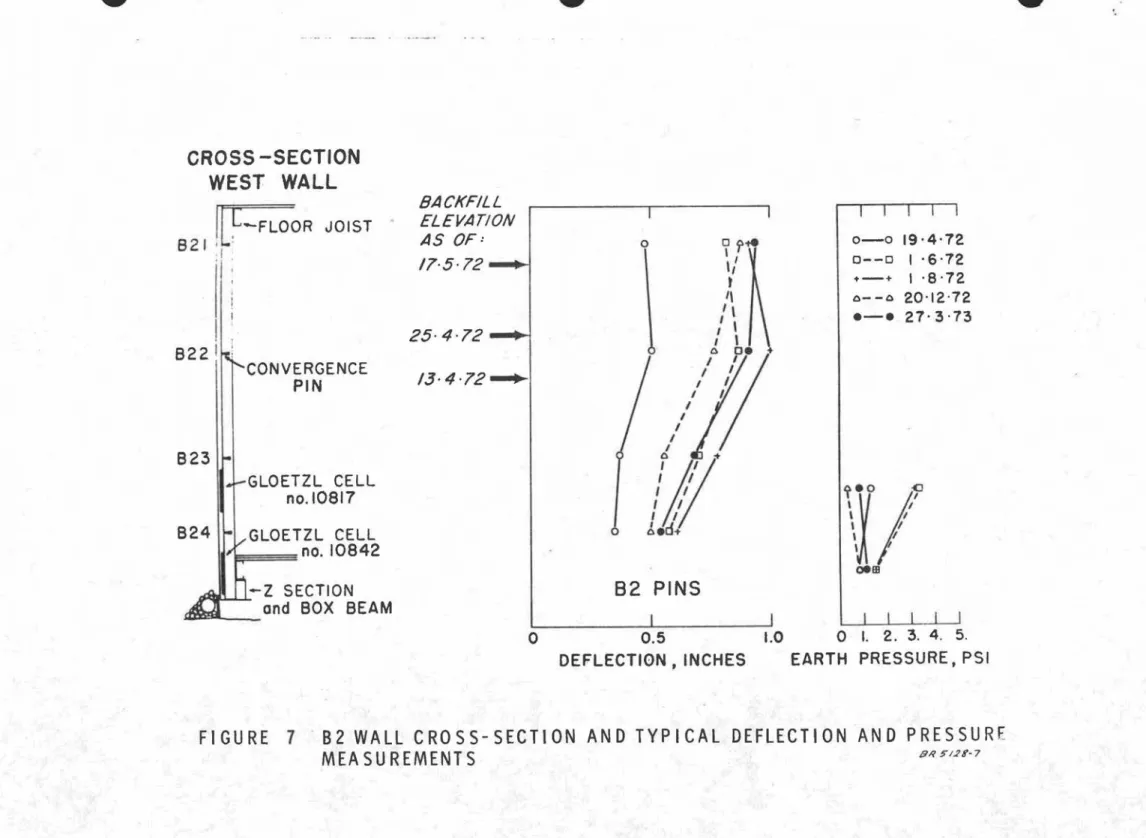
At sections Bl and B2, the maximum equivalent-fluid unit weights calculated for the end of backfilling stage were 65 and 90 lb/cu ft. re-spectively. at the shallower gauges, but less than 65 Ib/cu it at the deeper gauges. During the period from late summer to early winter, the pressures dropped significantly at both gauges at the Bl section and at the shallowest gauge at the B2 section. During the same period. the equivalent -fluid unit weights indicated by the deeper gauge at section B2 were in the range of 30.5 to 16.2 lb/cu ft.
In spite of what appeared at first to be contradictory evidence. the deflection and earth pressure measurements have consistently confirmed and agreed with other observations made throughout the period. For in-stance. it was observed in December that considerable shrinkage of the backfill had taken place along the north wall and a crack had opened up between the wall and the backfill to a depth of some 3 ft below grade near the CI section. In spite of this separation at the upper levels the wall
continued to increase in deflection inward and the earth pressures remained high nearer the bottom of the wall as measured by earth pressure cells.
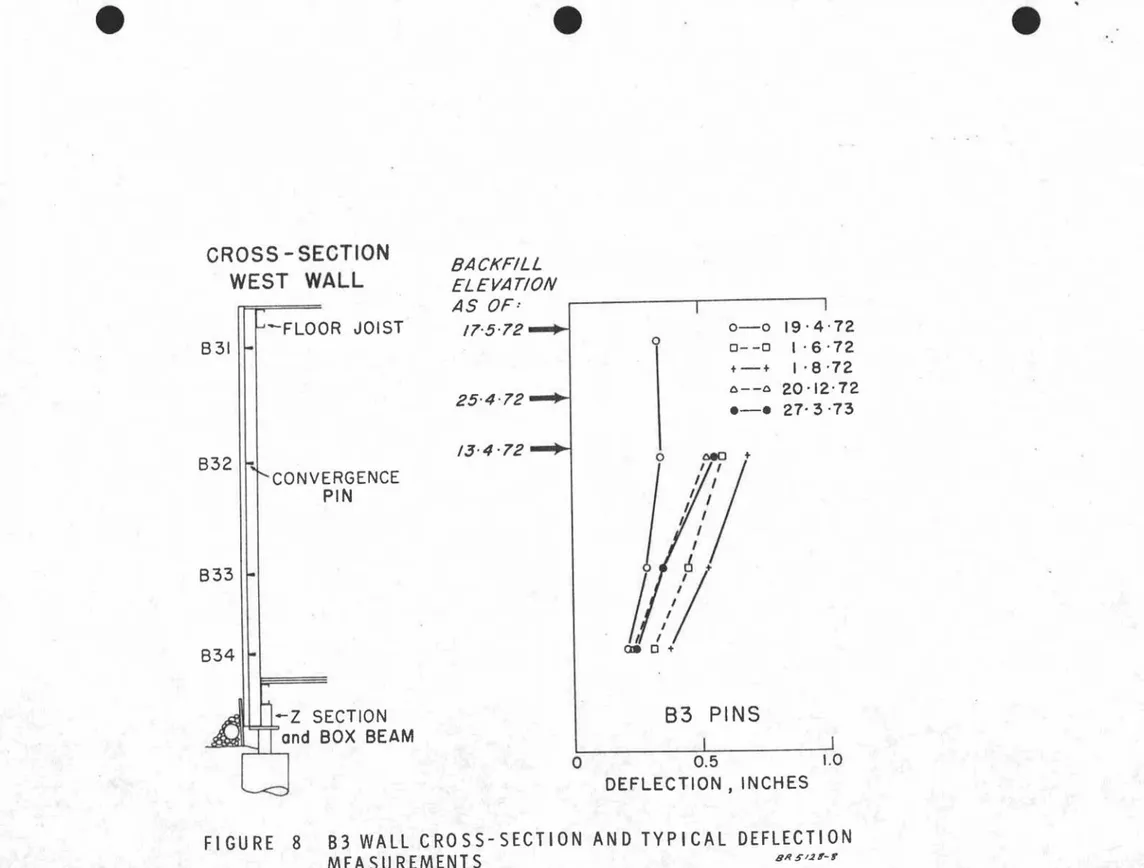
As shown on Figures 6. 7 and 8. relatively lar ge displacements of the west wall took place during and shortly after backfilling. A bulldozer was used to carefully push the lumpy native clay into the space between the
*
Equivalent-fluid unit weight - the unit weight of a hypothetical liquid that is assumed to exert the same pressure against the wall as the real backfill. Ref. "Soil Mechanics in Engineering. Practice" p. 314. by Karl Terzaghi and Ralph B. Peck. John Wiley and Sons 1948."
.
3-basement wall and the edge of the excavation. Backfilling was started in the northwest COrner and proceeded in a counterclockwise direction, first along the west wall, then along the south, east, and north walls. The backfill was slowly rolled and pushed at approximately its angle of repose into position against the wall with no attempt being made to place the backfill in even layers or to compact it to any specified density. The procedure followed was the same as that widely practiced throughout the prairie region. After the first backfilling stage, the maximum in-panel deflection':' ,+ measured on 19 April 1972 was approximately O. 08 in. at Section Bl. The maximun in-panel deflection measured on 1 June was 0.14 in. at the B2 section. For the same period, the measurements for points on the north wall, Sections Cl and Fl, revealed considerably smaller displacements and in-panel deflections.
Earth pressures measured along the west wall at Section B3 in-creased to reach maximums in early August and then declined to stress levels equal to or lower than those measured during the early backfilling stages. Near the base of the north wall, however, the earth pressures had not decreased to the same extent and remained in March 1973 near the maximums previously attained. Consequently, the north wall con-tinued to move inward at a fairly uniform rate and the maximum dis-placements at Section Cl and Fl approached 1/3 and 1/2 in. respectively. The maximum in-panel deflection measured at the Cl section is approxi-mately O. 11 in.
In contrast, both the earth pressures and the in-panel deflections measured on the west wall declined during the fall and early winter period and the in-panel deflections dropped to insignificant amounts. During the latter half of the winter, the deflections of the west wall again increased at Sections B1 and B2 with the maximum in-panel deflection measured at B1 equal to O. 12 in.
THERMAL PERFORMANCE OF THE BASEMENT WALL
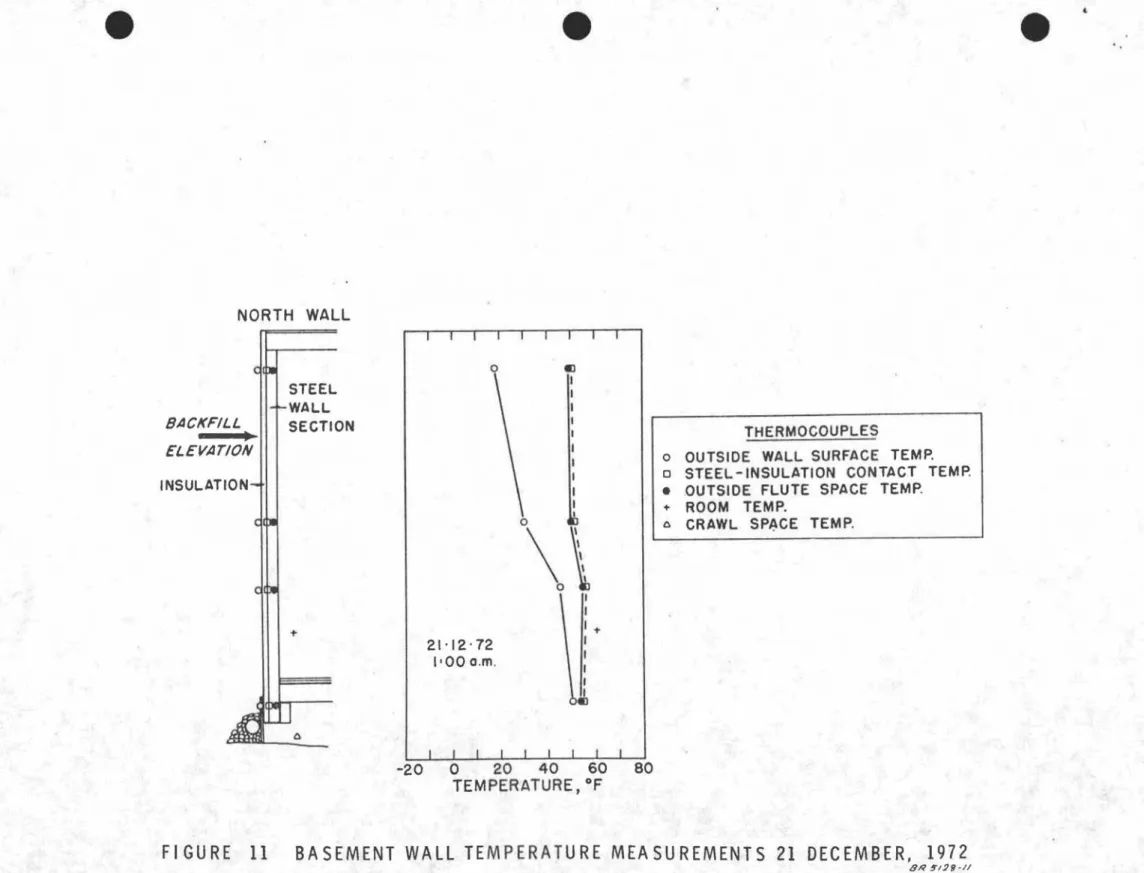
As shown on Figure 5, and Figures 11, 12, 13 and 14, a total of 15 thermocouples were installed to measure the thermal performance of the insulated steel wall. Four sets of three thermocouples were installed at various elevations and through the wall cross -section, and single
thermocouples were provided to measure the ambient air temperature
in the crawl space, the basement, and outside. A multipoint chart recorder
*
In-panel deflection for the purpose of this report is defined as the mea-sured horizontal deflection of the basement wall sheathing panel at a given section and time relative to an imaginary straight line joining the top and bottom measurement pins at the same section and time.+Maximum in-panel deflection is defined as the largest in-panel deflection measured to date at the given section.
."
4
-was used to monitor the temperatures of these points.
An unusually warm winter was experienced in Regina so the normal extremely low outside temperatures were not recorded from December 1972 to March 1973. In December, however, the occupants of the house expe-rienced increasing problems in maintaining comfortable temperatures in the lower basement and noted severe condensation on the inside of the steel basement, especially along the north wall. It was observed at this time that the clay backfill had shrunk away from the basement wall more than
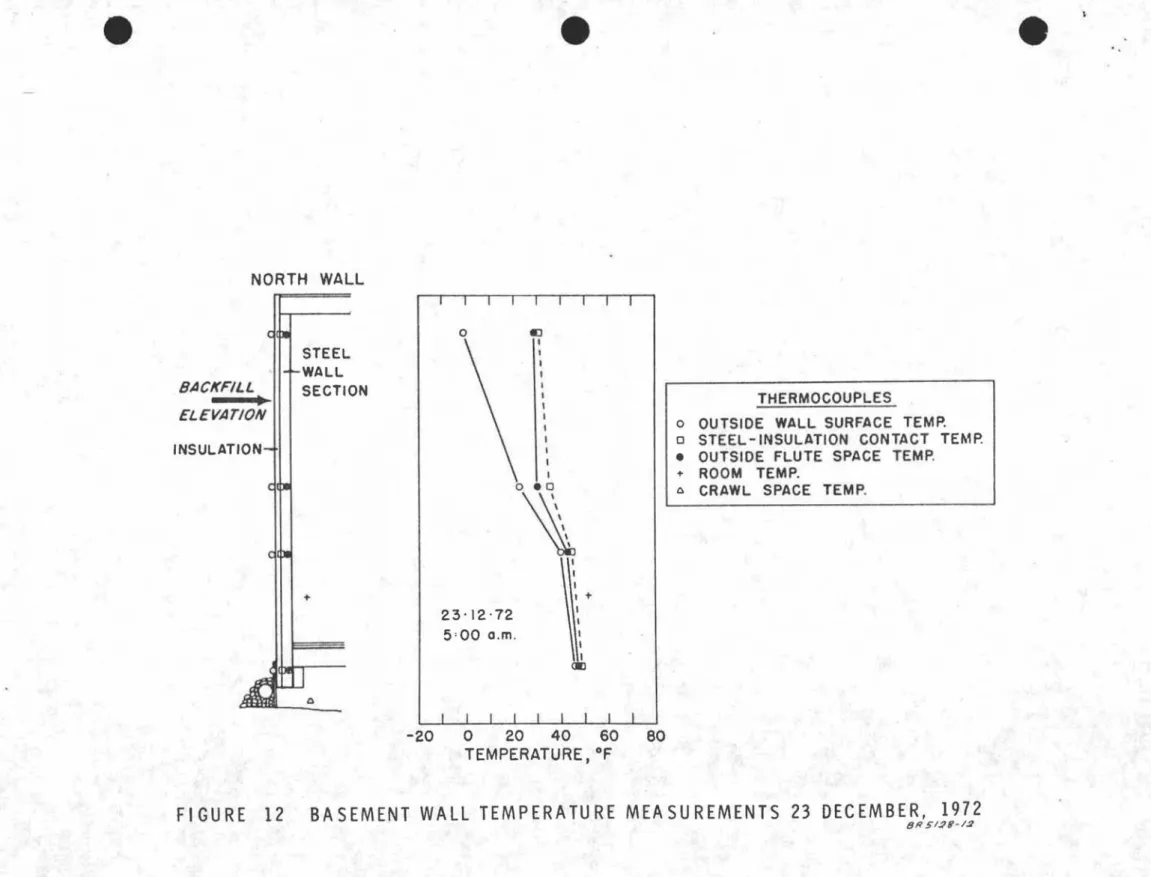
2 in. horizontally and almost 1 in. vertically. In some areas the exterior insulation and coating over the basement panels bowed outward and followed the soil until it parted from the wall. Wide gaps developed between the soil and the outside of the wall and between the insulation and the steel wall panels. The construction joints between the insulation and coating covering the basement wall and the insulation and coating on the first floor sheathing opened and allowed free circulation of outside air between the insulation and the steel panel. As shown on Figure II, when the outside air tem-perature was 18°F at 1 a.m. on 21 December 1972, the inside basement wall temperature was approximately 50°. As shown in Figure 12, when the outside air temperature dropped below 0° F at 5 a. m. on 23 December 1972, the steel panel temperature dropped to approximately 31 ° F near
the top of the wall. Considerable condensation in the form of frost developed on the inside of the steel wall. By 28 December a temporary remedial measure was taken to restore the thermal resistance of the wall system. The crack between the basement wall and first-floor wall insulations was plugged and the basement wall above grade was further insulated with batt-type insulation wedged against the wall. The benefits of this action can be readily seen in Figures 13 and 14. On 1 January 1973, when the outside air temperature was _14° F, the inside wall temperature did not drop below 43° near the top of the wall. On 15 January at 8 a. m., when the outside air temperature was above 20 ° F, the inside steel panel temperature was a minimum of 52 ° near mid-height of the wall and approximately 60° near the top of the wall.
SUMMARY OF PERFORMANCE OF THE MARK IX BASEMENT TO 31 MARCH 1973
1. There were no significant vertical movements of the foundation and base-ment walls up to March 1973.
2. The structural basement floor system appeared to be performing satisfactorily.
3. Horizontal movements of basement walls were quite large but neither excessive by structural considerations nor objectionable from the service or appearance points of view. Much of this movement might be eliminated in future construction through slightly modified backfilling procedures'.
•
•
5
-4. Maximum earth pressures measured against the basement walls were considerably higher than those generally used in design calculations for walls to retain clay backfills.
5. The thermal resistance of the external insulation system was lost when outside air was able to circulate between the insulation and the steel wall panels. At some sections of the basement wall, the fastening of the insulation to the steel panels proved inadequate to resist the pull and downdrag of the backfill soil. Corrective measures taken in
December 1972 to block off air leakage between the insulation and steel panels were necessarily of a temporary nature. More permanent irn-provements must be made for long-term good performance when weather and ground conditions permit.
TABLE I
IN;STRUMENTATION INSTALLED IN THE MARK IX BASEMENT
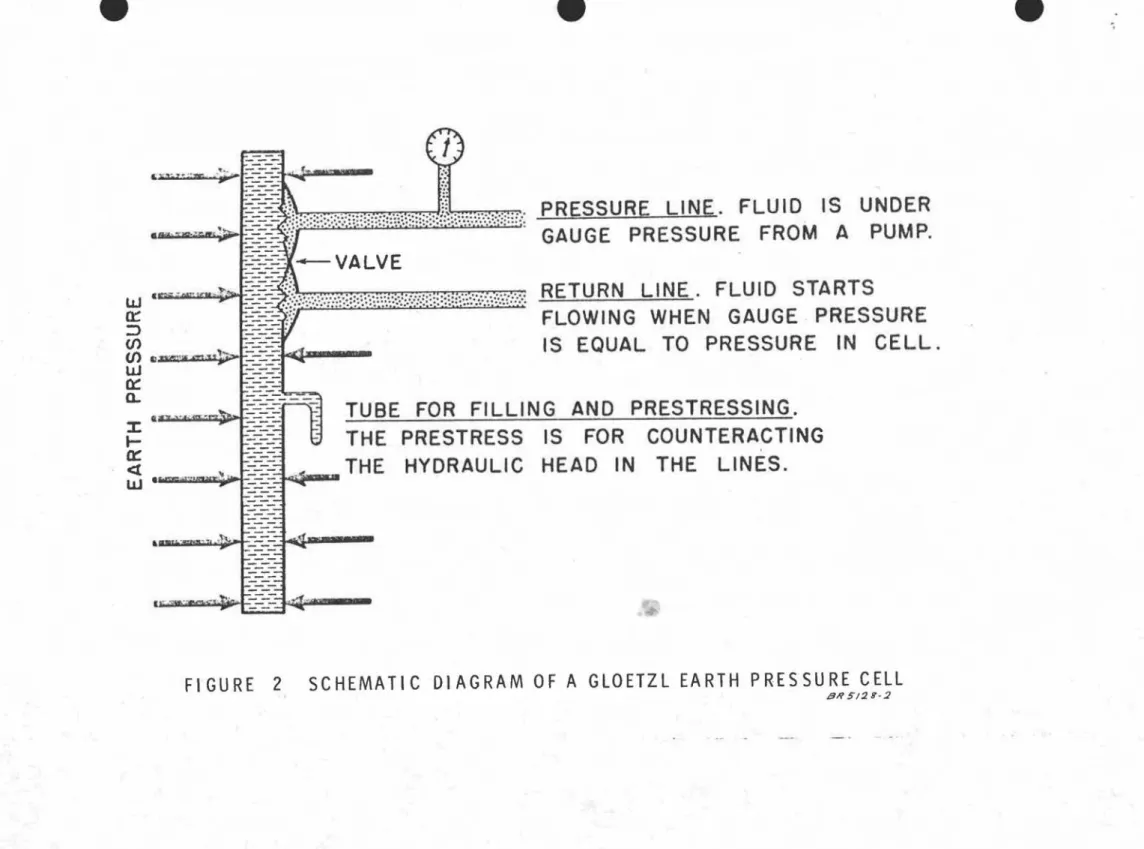
6 GIoetzl earth pressure cells
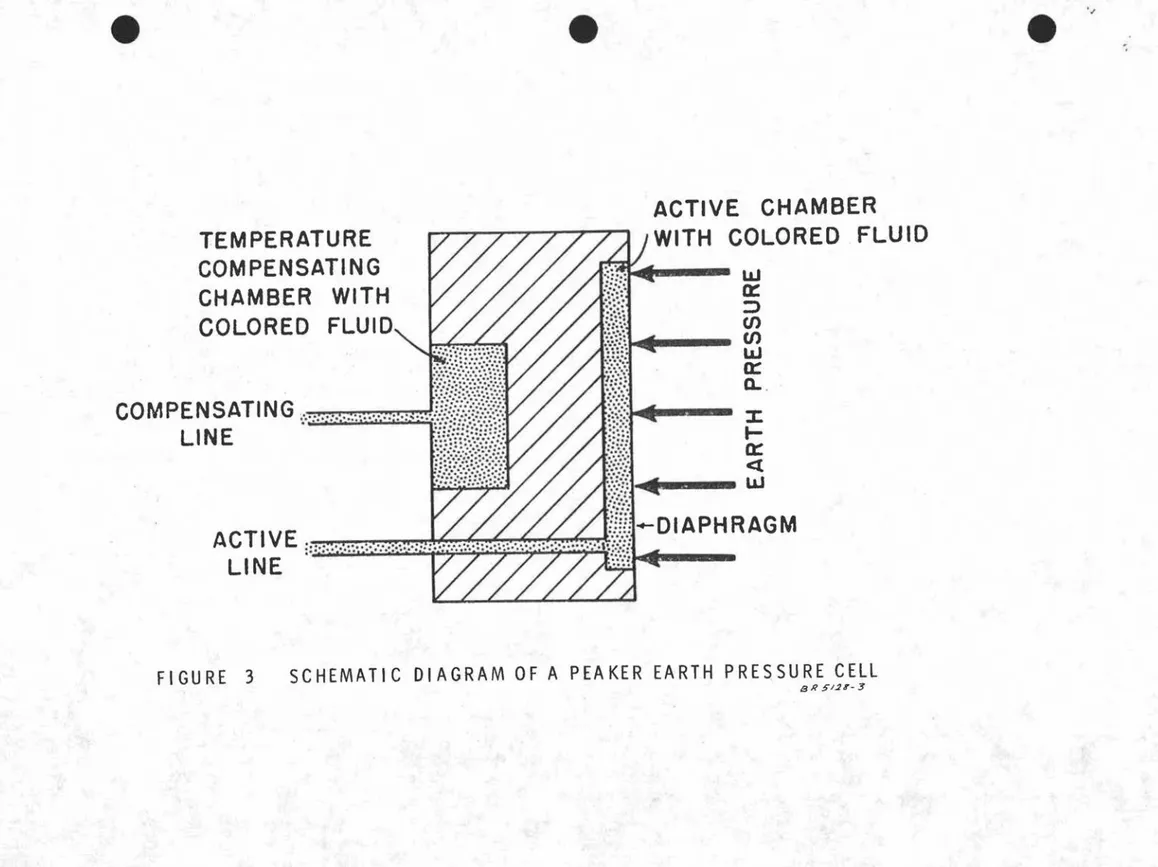
6 Peaker earth pressure cells 2 GIoetzl concrete stress cells 47 Interior wall movement pins
8 Exterior wall ュッカ・ュ・セエ pins 12 Therm ocouples
5 Ground movement gauges 2 Deep bench marks
e
e
e
'"SURCHARGE OF
ANY FORM!
f
t
t
f
t
t
t
t
f
f
f
f t t
f
f
HEAVING PRESSURE DUE TO 501 L REMOVAL
AND
CHANGE OF
WATER CONTENT AND
TEMPERATURE
PRESSURE
dueセLセGLZGLNZGLセGZZM}i
DIRECT LOADING
TO SURCHARGE
'..,
''':'_:-:<
t
FROM STRUCTURE
.
...セ \... '\. :..
FRICTION
BETWEEN
セ
'''-,.. Iltl SOIL AND WALL
I IEARTH
PRESSURE DUE
セ
I i i i I ITO EARTH
"ITSELF
1
REACTION
OF SOIL
t
FIGURE
1
FORCES ACTING ON A HOUSE FOUNDATION
e
e
e
1
RETURN
LINE.
FLUID
STARTS
FLOWING
WHEN
GAUGE
PRESSURE
IS
EQUAL
TO
PRESSURE
IN
CELL.
PRESSURE
LINE.
FLUID
IS
UNDER
GAUGE
PRESSURE
FROM
A
PUMP.
TUBE
FOR
FILLING
AND
PRESTRESSING.
THE
PRESTRESS
IS
FOR
COUNTERACTING
THE
HYDRAULIC
HEAD
IN
THE
LINES.
--
...
Gセ セ oM- _ ....^ゥセQセZZZBGZZGZZBG|GZ|GゥZBBG[EゥZLL[ZAイ||Gゥ[⦅ZZク[Z[イ
G[ゥ
W icャs[N・ャAAuG[xセセa::
::>
(/)セ iiuBBGkイョー^セセセKTBGMMM
0= ---:.a.
:I: 11-11;>,wm:.-cW...
Q: <tw·
GGGGᄋᄋsャヲGセv セIエK]M]Mセ]セ-ャGMセGMMGM d,.
FIGURE
2
SCHEMATIC DIAGRAM OF A GLOETZL EARTH PRESSURE CELL
e
TEMPERATURE
COMPENSATING
CHAMBER
WITH
COLORED
FLUID
,
ZエJ{GQセサセ}
COMPENSATING '..' ..
1 • • • • • • • , . . . , . : : : . : : ••• : ••: •••••••LI
NE
':
····'..
ャゥセZjAᆪHᄋ[ュ[ゥ ZZセZZZZ...
ZZZNZNセァAェヲエPセ
e
ACTIVE
CHAMBER
WITH COLORED FLUID
NセNNN セ
=>
(J) (J) }セ LLJn::
0..:J •
:I:
l-n::
e
セ セFIGURE
3
SCHEMATIC DIAGRAM OF A PEAKER EARTH PRESSURE CELL
e
e
e
,-HORIZONTAL MOVEMENT OF
PIN CAN BE CALCULATED
FROM CHANGE OF DISTANCE
TO THE REFERENCE PILE.
VERTICAL MOVEMENT OF
PIN CAN BE DETERMINED
BY LEVEL SURVEY. '/ /
/
/
/
/
WALL PINS OF KNOWN POSITIONi!:----
_
REF. PILE no. 2
REF. PILE
no.
IFIGURE
4
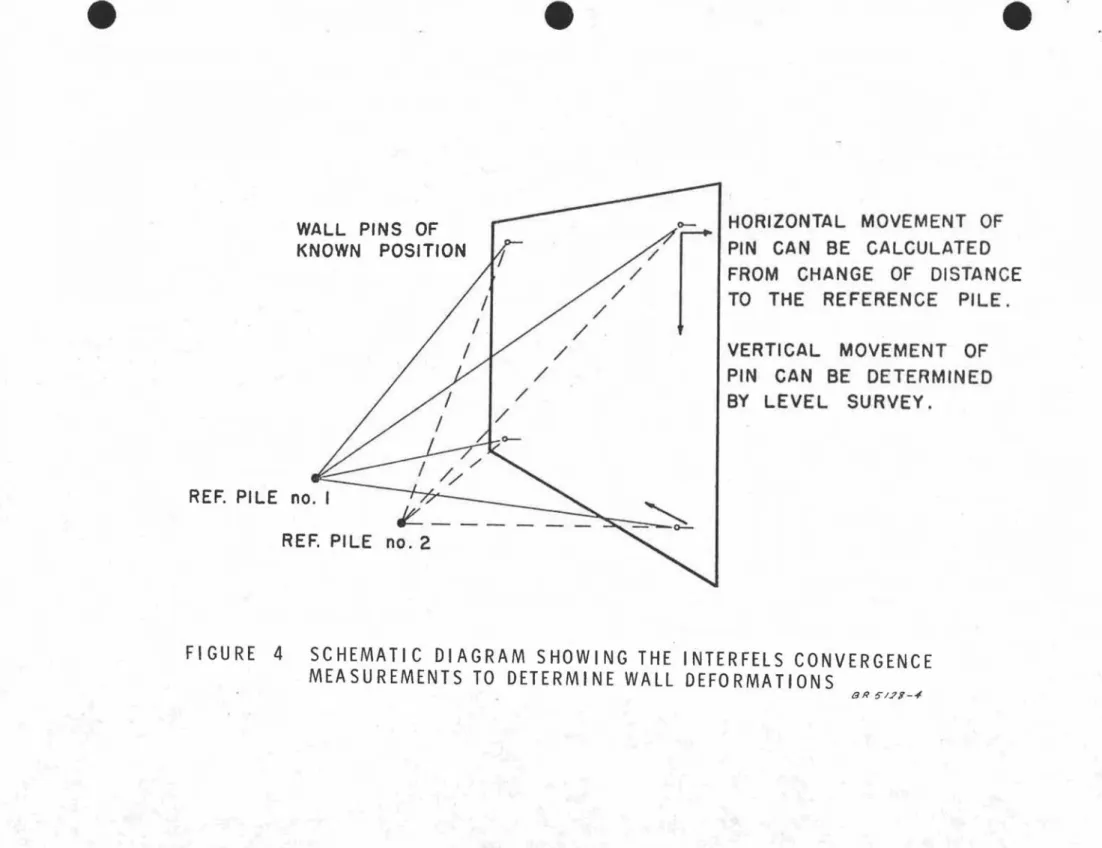
SCHEMATIC DIAGRAM SHOWING THE INTERFELS CONVERGENCE
MEASUREMENTS TO DETERMINE WALL DEFORMATIONS
•
e
e
I I I I I I I I I----0--- - - --0- - --- - - - ---0
o
o
@ tR\ GLOETZL0
e.-PILE CELL @ Cl • GLOETZL EARTH PRESSURE CELL o PEAKER HYDRAULIC CELLセ OUTSIDE WALL PIN
[> INSIDE WALL PIN GROUND
+ MOVEMENT GAUGE
@ REFERENCE PILE
FIGURE
5
FOUNDATION PLAN AND INSTRUMENTATION
•
e
CROSS - SECTION
WEST WALL
e
-FLOOR JOIST
BtlBI2
CONVERGENCE
PIN
BI3
GLOETZL CELL
no. 10808GLOETZL CELL
no.10845.-Z SECTION
and BOX BEAM
BACKFILL ELEVATION AS OF: /7'512 . -25'412 /3'412
o
o 0 , £ 1 . I I I I I , I , II I 1/ o D I•
•
n"
"
II/ 1/
orfl..
81
PINS
0.5 1.0DEFLECTION, INCHES
0 - 0 19·4·72 0 - - 0 1'6'72 + - + 1·8·72 0 - - 0 20'12·72 Nセ 27'3·73|セ|
<2:\.01-o
I. 2. 3. 4. 5.EARTH PRESSURE,PSI
BR5/211-6FI GURE
6
81 WALL CROSS-SECTION AND TYPICAL DEFLECTION AND PRESSURE
MEA SU REMENTS
e
e
e
Gセ 0 - 0 19·4·72 0 - - 0 I '6·72 .. - + I ·8·72 0 - - 0 20'12'72 e - e 27· 3·73W/
9
oem
1.0 0 I. 2. 3. 4. 5.EARTH PRESSURE,PSI
o ッセ ... , I I,•
II , I,
,
: I o oe I I I I I I I " I I I I I1//
oed..82 PINS
0.5DEFLECTION, INCHES
o
BACKFILL ELEVATION AS OF:17·5·72
13·4-72'-'"
25· 4-72GLOETZL CELL
no.10817 セMzSECTION
セ
and BOX BEAM
GLOETZL CELL
1'1,
no. 10842CONVERGENCE
PIN
CROSS -SECTION
WEST WALL
f-FLOOR JOIST
82J I .1 :I
B22 1FIGURE
7
82 WALL CROSS-SECTION AND TYPICAL DEFLECTION AND PRESSURE
e
e
e
83 PINS
o
0.5 1.0DEFLECTION J INCHES
セセz SECTION
and BOX BEAM
CROSS - SECTION
BACKFILLWEST WALL
ELEVATIONAS OF: 0 - 0 19' 4·72 -FLOOR JOIST 17'5-72--1 0 0 - - 0 I' 6 ·72 831
1rl
I
1'8 '72 +-+ 0 - - 0 20'12·72 25.4121
\
. - . 27-3-73 13'412XSRQセ
CONVERGENCE PINFIGURE
8
B3 WALL CROSS-SECTION AND TYPICAL DEFLECTION
e
e
e
CROSS - SECTION
NORTH WALL
\\.1
0 - 0 19·4·72 0 - - 0 1·6·72 + - + 1·8'72 0 - - 0 20'12'72 . - . 27·3'73Cl PINS
+00. 1\ 1\ I I I \ I \,
\,
,
\ \ I \ I I . +0,
o.
,
,
,
,
,
,
,
, ,
,
,
,
,
, I:
,
.jQo.
o QWGUGWRセQ 13·4-72 ... BACKFILL ELEVATION AS OF·' ECTION BOX BEAM ERGENCE PIN TZL CELL no. 10834 TZL CELL 10835 OR JOIST C I I f- 'FLO ,...,...CONV CI2 セ ..'- GLOE no. CI4"'v
GLOE I, ..aP.l-z
s
セ
ando
0.5 1.0 0 I. 2. 3. 4. 5.DEFLECTION, INCHES EARTH PRESSURE, PSI
FIGURE
9
Cl WALL CROSS-SECTION AND TYPICAL DEFLECTION AND PRESSURE
e
e
e
CROSS -SECTION
NORTH WALL
FII
FI2
Fl3
'FLOOR JOIST
CONVERGENCE
PIN
BACKFILL
ELEVATION
AS OF:
17'5'
72
. - . . J13·4'72
/ 0 セ +f
I I I I I I I I I Io
0 セ I I I,
I I I I <ID ••
•
0 - 019·4·72
0 - - 01'6·72
t - t1'8·72
0 - - 020'12·72
. - .
27'3 ·73
Fl
PINS
..z
SECTION
セオNNNNNljand BOX BEAM
o
0.5
1.0
DEFLECTION, INCHES
FIGURE
10
Fl WALL CROSS-SECTION AND TYPICAL DEFLECTION AND
e
e
NORTH WALL I I I .-1 1 I I Ie
q¢Jqlf:ll
q4-BACKFILL ELEVATIONINSULATlON-セ
STEEL I'-WALL SECTION +I
o o 21'12'72 l'OOo.m. til0\\
\ I:
1+ I I I I Vセ THERMOCOUPLESo OUTSIDE WALL SURFACE TEMP.
o STEEL-INSULATION CONTACT TEMP.
• .OUTSIDE FLUTE SPACE TEMP.
+ ROOM TEMP.
o CRAWL spセce TEMP.
I I I I I I I 1 I
-20 0 20 40 60 80
TEMPERATURE, of
FIGURE
11
BASEMENT WALL TEMPERATURE MEASUREMENTS 21 DECEMBER, 1972
e
NORTH WALLe
e
23'12·72 5'00o.m. BACKFILL -ELEVATION INSULATION STEEL WALL SECTION + o «l I I,
,
,
,
,
I I I I I I0\
,
I I I + I I I,
I THERMOCOUPLESo OUTSIDE WALL SURFACE TEMP.
o STEEL-INSULATION CONTACT TEMP.
• OUTSIDE FLUTE SPACE TEMP.
+ ROOM TEMP.
o CRAWL SPACE TEMP.
o
-20 0 20 40 60
eo
TEMPERATURE, of
FIGURE
12
BASEMENT WALL TEMPERATURE MEASUREMENTS 23 DECEMBER, 1972
e
NORTH WALLe
•
BACKFILL -ELEVATION INSULATION STEEL WALL SECTION + o o 4'1·73 10'00o.m. セ I I I I I I I I I I I I I eoセ
I I I 1-I I I 1 I THERMOCOUPLESo OUTSIDE WALL SURFACE TEMP.
o STEEL-INSULATION CONTACT TEMP.
• OUTSIDE FLUTE SPACE TEMP.
+ ROOM TEMP.
o CRAWL SPACE TEMP.
-20 0 20 40 60 80
TEMPERATURE, of
FIGURE
13
BASEMENT WALL TEMPERATURE MEASUREMENTS 4 JANUARY, 1973
e
e
..
,.
NORTH WALL
INSULATION
BACKFILL
-
THERMOCOUPLESo OUTSIDE WALL SURFACE TEMP.
o STEEL-INSULATION CONTACT TEMP.
• OUTSIDE FLUTE SPACE TEMP.
+ ROOM TEMP,
o CRAWL SPACE TEMP.
-a J