A Comparative Study of Wind Power in the United States, Europe and Japan:
Strategies Applicable to Japan
by Shinji Shimizu
M.E. Civil Engineering, Tokyo Metropolitan University, 1989 B.E. Civil Engineering, Tokyo Metropolitan University, 1987
Submitted to the MIT Sloan School of Management in Partial Fulfillment of the Requirements for the Degree of
Master of Business Administration at the
Massachusetts Institute of Technology June 2006
C 2006 Shinji Shimizu. All Rights Reserved
The author hereby grants to MIT permission to reproduce and to distribute publicly paper and electronic copies of this thesis document in whole or in part.
Signature of Author:
MIT Sloan School of Management May 8, 2006 Certified by:
Henry D. Jacoby Professor of Management, MIT Sloan School of Management Thesis Supervisor Accepted by:
Stephen J. Sacca Director, Sloan Fellows Program in Innovation and Global Leadership
ARCHIVES
MASSACHUSETTS IST1TEOF TECHNOLOGY
AUG
3 12006
A Comparative Study of Wind Power in the United States, Europe and Japan:
Strategies Applicable to Japan
by Shinji Shimizu
Submitted to the MIT Sloan School of Management on May 8, 2006
in Partial Fulfillment of the Requirements for the Degree of Master of Business Administration
ABSTRACT
This thesis explores measures in the Japanese energy industry in order to meet the Kyoto target and further abate carbon dioxide beyond this target. To meet the Kyoto target, the Japanese government wants to increase renewable energy such as wind power as one of the measures. Wind power may be one of the most cost-effective renewable energy sources to address global warming. The world market for wind power is growing rapidly and the markets are concentrated in a few primary countries, with Europe (especially Germany) and the United States leading expansion. However, Japan is now taking its first steps to develop a large-scale commercial market for wind power.
It is now difficult for renewable energy, such as wind power, to become a major energy source due to its high cost and intermittent supply. However, it is the author's belief that Japan can increase wind power energy to reduce carbon dioxide emissions by applying appropriate policies and technical development in the power industry.
This thesis examines policies designed to encourage the development of wind power in three countries-Germany, Denmark, and the United States--and compares the policies enacted in each of these countries to policies that are used in Japan. Measures that are applicable to shaping the implementation of renewable energy, especially wind power energy are examined and future policy measures are proposed to increase the use and development of wind power in Japan, consequently reducing carbon dioxide emissions.
ACKNOWKEDGEMENTS
In every phase of this study, many people have helped me directly and indirectly to complete this thesis. I cannot forget to extend my gratitude to all of them for their support. I would like to thank my thesis adviser, Professor Henry D. Jacoby. He gave me hands on suggestions and advice while I was doing my research and writing this thesis. Without his help, I could not have accomplished this thesis.
This thesis could not be done without the influence of many people and opportunities I have encountered during my stay at Massachusetts Institute of Technology. I would also like to thank all those professors and colleagues for their splendid courses and discussions.
Last but not least, I would like to acknowledge the contribution of my wife, Mari and our son, Haruki, who endured the late nights and weekends when I was consumed with writing this thesis and had very little time for them. Your support and encouragement are truly appreciated.
-3-Table of Contents
1. O v erview ... ... ... ... 6
2. Japan's target in the K yoto Protocol... 8
2.1 Global Climate Change and the Role of Carbon Emissions ... 8
2.2 The Kyoto protocol and GHG emissions in Japan ... ... 9
2.3 Pow er generation sector ... ... ... 12
3. W ind Power developm ent in Japan ... ... 16
3.1 Background of renewable energy... ... 18
3.2 R enew able Policies ... ... 19
4. Wind Power Development in the United States ... 21
4.1 Federal renewable policy ... ... ... ... 26
4.1.1 Background ... ... 26
4.1.2 Federal Non-Hydro Renewable Energy Policies ... ... 27
4.2 California ... . 30
4.2.1 B ackground... ... ... ... 30
4.2.2 Non-Hydro Renewable Energy Policies ... 31
5. W ind power development in Europe ... ... 34
5.1 G erm any... .. ... ... ... ... ... 34
5.1.1 Background... ... ... ... 35
5.1.2 Research, Development, and Demonstration (1974-present) ... 38
5.1.3 Electricity Feed-In Law (1991) and Renewable Energy Law (2000) ... 39
5.2.2 Investment Subsidy (1979-1989)... 48
5.2.3 Production Subsidy and other Direct Support Mechanisms (1981 and 1992) ... 48
5.2.4 Domestic Market Support (1990-2000) ... 50
6. Comparison of policies in various countries that support wind power ... 53
6.1 Political C om m itm ent ... 53
6.2 Polocies Affecting Wind power... 55
6.2.1 Price- B ased System s... 57
6.2.2 Renewable Quota Systesm... 60
7. Issues hindering the promotion of wind power in Japan ... 63
7.1 Issues regarding present policies in Japan ... 63
7.2 Issues of the grid in Japan ... 64
7.3 Issues of the densely populated country... 66
8. Conclusion-Proposals for promoting wind power in Japan... .... ... 67
8.1 Components of a wind policy ... 67
8.2 Economic analysis of Japanese wind policies... ... 73
9 . R eferences ... 78
-5-1. Overview
This thesis explores measures in the Japanese energy industry in order to meet the Kyoto target and further abate carbon dioxide beyond this target. The Kyoto Protocol to the United Nations Framework Convention on Climate Change, an agreement among the industrialized nations of the world to reduce emissions of six greenhouse gases over a specific period of time, is a milestone in the international effort to address the anthropogenic causes of climate change. The Protocol was adopted at COP3 (the Third Conference of the Parties to the United Nations
Framework Convention on Climate Change), held in Kyoto, Japan in 1997. The Kyoto Protocol requires industrialized countries agreeing to it (including Japan) to cut their greenhouse gas emissions by an average of 5.2% relative to 1990 levels. These emission reductions are to be completed by a commitment period ranging from 2008 to 2012. With Russia's ratification in November 2004, this international agreement entered into force in February 2005.
To meet the Kyoto target, the present measures by the Japanese government to reduce the carbon dioxide emissions in the energy sector rely heavily on the development of nuclear power generation. Therefore, the current delay of nuclear power development is a crucial problem to be solved to achieve the target. The Japanese government also wants to increase renewable energy as one of the measures. It is now difficult for renewable energy, such as wind power, to become a major energy source due to its high cost and intermittent supply. However, it is author's belief renewable energy can be increased in order to reduce carbon dioxide emissions by applying appropriate policies and technical development in the power generation sector. Wind power may be the most cost-effective renewable energy source to address global warming.
The world market for wind power is growing rapidly: from 14,000 megawatts in 1999 to over 48,000 megawatts in 2004.1 Wind power markets are concentrated in a few primary countries, with Europe (especially Germany) and the United States leading the expansion in 2004. However,
Though the Japanese government has raised its wind power target to 3,000 megawatts by 2010, only 900 megawatts of wind power had been introduced by 2004.2
This thesis examines policies designed to encourage the development of non-hydro renewable energy such as wind power in three countries-Germany, Denmark, and the United States-and compares the policies enacted in each of these countries to policies that are used in Japan. For each country, policy development is analyzed in the context of historical non-hydro renewable generation data to try to determine which types of policies would most effectively increase non-hydro renewable generation. In this thesis, measures discussed are applicable to shaping Japan's non-hydro renewable implementation, especially wind power energy.
Chapter 2 introduces the Kyoto Protocol; Chapter 3 reexamines wind power development in Japan; Chapter 4 analyzes wind power development in the United States; and Chapter 5
analyzes wind power development in European countries. Chapter 6 compares policies in various countries that support wind power. Chapter 7 discusses the issues hindering the promotion of wind power in Japan. The final chapter, Chapter 8, proposes future policy measures to increase the use and development of wind power in Japan, consequently reducing carbon dioxide emissions.
-7-2. Japan's target in the Kyoto Protocol
2.1 Global Climate Change and the Role of Carbon Emissions
The entire global climate and ecosystem have been altered by the accumulation of gases including carbon dioxide, methane, nitrous oxide, chlorofluorocarbons, and ozone in the
atmosphere. These so-called green house gases (GHGs) are produced by various human activities, including agricultural and industrial practices, deforestation, and the burning of fossil fuels.
"Global warming" and "climate change" are common expressions used to describe the threat to human and natural systems resulting from continued emissions of heat-trapping or "greenhouse" gases (GHGs) from human activities. These emissions are changing the composition of the atmosphere at an unprecedented rate. While the complexity of the global climate system makes it difficult to accurately predict the impact of these changes, the evidence
from modeling studies, as interpreted by the world's leading scientists assembled by the
Intergovernmental Panel on Climate Change (IPCC), indicates that the global mean temperature will increase anywhere from 1.4 to 5.80 C within 100 years.3 For reference, a global increase of 20 C from today's levels would yield global average temperatures exceeding any the earth has experienced in the last 10,000 years, and an increase of 50 C would exceed anything experienced in the last 600,000 years. Moreover, it is not simply the magnitude of the potential climate change, but the rate of this change that poses serious risks for human and ecosystem adaptation, with potentially large environmental and socioeconomic consequences.4
The combustion of all carbon-based fuels, including coal, oil, natural gas, and biomass, releases carbon dioxide (CO2) and other "greenhouse gases" into the atmosphere. Over the past century, emissions of greenhouse gases from a combination of fossil fuel use, deforestation, and other sources have increased the effective "thickness" of the atmospheric blanket by increasing the concentration of GHGs in the troposphere, or lower part of the atmosphere (ground level to
about 10-12 km). It is this "thicker blanket" that is thought to be triggering changes in the global climate.
The warming of the earth may, in turn, have numerous secondary effects, some of which can have a potentially serious impact on the well being of both humans and the plants and animals with which we share our planet. These effects include an increase in sea level due to thermal expansion and the melting of polar ice, changes in precipitation patterns, and changes in vegetation. The timing and spatial distribution of these effects around the globe are as yet extremely uncertain.
2.2 The Kyoto Protocol and GHG Emissions in Japan
A milestone in the international effort to address the anthropogenic causes of climate change was the Kyoto Protocol to the United Nations Framework Convention on Climate Change, an agreement among the industrialized nations of the world to reduce emissions of six greenhouse gases over a specific period of time. The Protocol was adopted at COP3 (the Third Conference of the Parties to the United Nations Framework Convention on Climate Change), which was held in Kyoto, Japan in 1997. The Kyoto Protocol requires industrialized countries agreeing to it
(including Japan) to cut their greenhouse gas emissions by an average of 5.2% relative to 1990 levels. These emissions reductions are to be completed by a commitment period ranging from 2008 to 2012. Japan ratified the Kyoto Protocol in 2002. With Russia's ratification in November 2004, this international agreement entered into force in February 2005.5
Under the terms of the Protocol, Japan has agreed to reduce its GHG emissions by 6% relative to 1990 levels. Japan's GHG emissions of late are 5% higher than Japan's 1990 emission levels.6
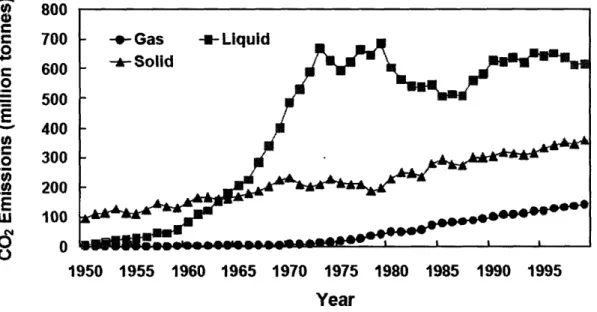
More than 90% of the total GHG emissions in Japan, measured in carbon equivalents, are accounted for by carbon dioxide emissions.7 Figure 2-1 shows the pattern of carbon dioxide emissions by fuel type in Japan since 1950, illustrating both the substantial growth in emissions
-9-during the 1970s and 1980s (in particular), and a transition in fuel use from coal to oil to gas. Figure 2-2 shows Japanese CO2 emissions by sector during the 1990s. The main CO2 emission sources in 2000 were the energy industries including the power sector (31%), other industries (33%), and the transportation sector (21%).8As of 2000, Japan was fourth among nations in CO2 emissions, behind only the United States, China and Russia. On a per-capita basis, Japan ranked 37th in the world as of 2000, with approximately 9.35 tonnes of CO2 emissions per person.9
800 700 600 500 400 300 200 100 0 1950 1955 1960 1965 1970 1975 1980 1985 1990 1995 Year
A Aflf c 1,200 C C 1,000 o 800 0 600 o 400 0 E 200
9
n
M Energy Industries B Other industries U Transport M Others
1990 1991 1992 1993 1994 1995 1996 1997 1998 1999 2000
Year
Figure 2-2 CO2 Emissions in Japan by Sector, 1990 to 2000 "
According to the Japanese Government's "Guideline for Measures to Prevent Global Warming," the GHG reduction targets relative to 1990's emissions levels for the sectors of the Japanese economy and specific GHG sources and sinks are as follows:
* C02 from energy sources (0%),
* C02 from non-energy sources, CH4 and N20 (-1.2%),
* Development of innovative technologies and further extensive efforts by the public (+0.6%),
* HFCs, PFCs and SF6 (+0.1%), * Sinks (-3.9%).
Additional cuts necessary to meet the overall emission reduction target (-1.6%) will be covered by Japan's share of savings achieved elsewhere as allowed through Kyoto mechanism
-11-initiatives such as Emissions Trading, the Clean Development Mechanism, and Joint Implementation. 12
This plan suggests that Japan's COz emissions could be reduced most by energy
conservation efforts of all sectors and by the aggressive adoption of energy efficient technologies. Given, however, that the efficiency with which energy is used in Japan is already relatively high -as an indicator, annual electricity consumption per capita in Japan as of 2000 was 8.3 MWh,
versus 13.8 MWh per person-year in the US13 -it is likely that the level of national GHG
reductions required by the Kyoto Protocol will be difficult to achieve by relying solely on energy efficiency improvements and other forms of energy conservation.
2.3 Power Generation Sector
Emissions associated with the energy transformation sectors alone are estimated to be over 30% (including indirect emissions) of Japan's total national CO2 emissions. As a consequence, substantial efforts to reduce GHG emissions in the power sector--which accounts for over half of the energy transformation emissions-could have a significant impact on climate change
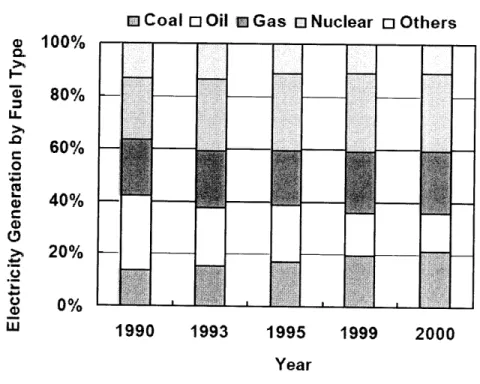
mitigation in Japan. It is therefore imperative for Japan's power sector to consider switching to less carbon-intensive fuels and energy resources. As shown in Figure 2-3, carbon dioxide emissions from electricity generation in Japan increased by 16.5% between 1990 and 2000. This increase is largely the result of an overall increase in electricity production in Japan (27.8% between 1990 and 2000), that has occurred even though there has been a small overall reduction in the fraction of total generation produced in thermal power plants. Figure 2-4 shows how the composition of electricity production has changed between 1990 and 2000.5
If Afl*
C
C
1990 1991 1992 1993 1994 1995 1996 1997 1998 1999 20(
Year
Figure 2-3 Carbon Dioxide Emissions from Electricity Generation in Japanl4
oD
Coal O Oilm
Gas o Nuclear o Othersa. H LL .00)(U
>11
I-L_ 0 0 C, (D FUC)0 100% 80%60%
40% 20% 0%00
1990 1993 1995 1999 2000 YearFigure 2-4 Electricity Generations in Japan by Fuel Type, 1990 to 2000'5
-
13-,
390
0 - 380o
370
360E
" 350 = 340n
330
320
U 3105
300
--.1The major fuel-switching options for electricity generation that are currently under consideration by the Japanese government to reduce GHG emissions, as evidenced by the recent Long-Term Energy Outlook, are a large increase in the use of nuclear power, an increase of utilization of coal-fired power plants using high thermal efficiency generation technologies, an increase in the use of natural gas and gas-fired technologies for generation, and a variety of technologies for the expanded generation of electricity using renewable fuels and resources. Among these options, governmental and also semi-governmental research groups have focused most extensively on the emissions reduction potential of increased nuclear power development. The most recent Long-term Energy Outlook'6 for Japan published by METI (Ministry of Economy, Trade and Industry) includes the assumption that Japan's GDP (Gross Domestic Product) growth rate will be 2% annually through 2010. This assumption implies a continued increase of energy consumption and the necessity of emphasis on nuclear and fossil fuel
use--especially coal-and modest increases in the use of renewable energy. In the METI outlook, although oil consumption as a primary energy input to the Japanese economy is projected to decrease from 5 2% in 1999 to 45% in 2010, coal use and the use of nuclear power (despite extreme difficulties related to the siting of new coal and nuclear facilities in Japan) will increase. Non-conventional energy (new energy) including renewable sources will account for 3% of Japan's primary energy by 2010 in the METI's "business as usual" case.5
All other C02 emission reduction scenarios that comply with the government energy outlook, not surprisingly, conclude that it is difficult for Japan to meet the national target for greenhouse gas emissions reduction set at the Kyoto Conference.
In addition to the difficulties described above, global liberalization of energy markets might also negatively affect Japan's progress toward its CO2 emission reduction target. Japan has few indigenous fossil fuel energy resources. Japan has regulated all domestic energy markets, and
has been protecting Japan's energy markets from the risks associated with competition through the use of large energy subsidies and centralized implementation of national energy policy. The global trend of energy market liberalization, however, cannot be avoided. METI realizes that to some degree Japanese domestic energy markets must ultimately open up to fair competition and start promoting a more open market liberalization. In recent years, the Japanese public has become aware of the real costs-including social and environmental costs-of energy, and
especially of nuclear power generation, and partially as a result, along with increasingly severe difficulties in siting facilities, there has been less private investment in what is perceived as a risky, inflexible, large, centralized power system.5
If, as a result, nuclear power plant development will not occur on the time scale projected by METI, then the reduction of Japan's CO2 emissions to meet the target set by the Kyoto Protocol
will be even harder to achieve.
Some research has been accomplished to examine alternative measures to achieve the target for the electric power sector. For example, the Ministry of Environment of the Japanese government analyzed auxiliary measures to reduce GHG emission. To achieve the reduction by 2010, which is a relatively short period for the electric power industry and definitely limited for the introduction of new technologies, realistic measures which are in the mature stage of the
technological development that could be installed by 2010 should be considered.5
From the perspective of the technological maturity and feasibility, acceleration of the introduction of renewable energy, especially wind power generation, seems to be one of the key issues. We recognize that it is now difficult for renewable energy, such as wind power, to become a major energy sources due to its high cost and intermittent supply. However, I believe that we can increase renewable energy to reduce carbon dioxide emissions by applying appropriate policies and technical development in the power generation sector. Wind power may be the most cost-effective renewable energy source to address global warming.5
-15-3. Wind Power development in Japan
Japan's wind energy industry has surged forward in recent years, partly spurred by a government requirement for electricity companies to source an increasing percentage of their supply from renewables. Development has also been encouraged by the introduction of market incentives, both in terms of the price paid for the output from renewable plants and in the form of capital grants towards clean energy projects. Power purchase agreements for renewables also have a relatively long lifespan of 17 years, which helps to encourage investor confidence. The result has been an increase in Japan's installed capacity from 644 MW at the end of 2003 (fiscal year) to more than 900 MW by 2004.2 (See Figure 3-1, 3-2)
300 250 200 150 100 50 0 1992 1993 1994 1995 1996 1997 1998 1999 2000 2001 2002 2003 2004 Year
4 Ann nf)7 1,VVV 900 800 700 2 600 . 500 0
400
300 200 100 1992 1993 1994 1995 1996 1997 1998 1999 2000 2001 2002 2003 2004 YearFigure 3-2 Cumulative installed wind power capacity (MW) in Japan
In pursuit of the Kyoto Protocol objectives, Japan has a target to reduce the level of its greenhouse gas emissions by 6% (compared to their 1990 level) by 2008-12. To help achieve this
goal, the Japanese government introduced a Renewable Portfolio Standard (RPS) law in April 2003 with the aim of stimulating renewable energy to provide 1.35 per cent of total electricity supply in 2010.
However, the law has a number of weaknesses, including a very low target (almost one tenth of Germany's), the inclusion of electricity generated by waste incineration as "renewable" and insufficient market incentives. Apart from the RPS, the Japanese wind industry also benefits from the government's Field Test and New Energy Business Support Programs.
The leading regions for wind power development in Japan are Tohoku and Hokkaido, two areas located in the northern part of the country, with an installed capacity respectively of 275 and 159 MW, and Kyushu, situated in the south, with 113 MW. '
-17-70
Two other issues have created challenges for Japanese wind developers. Firstly, the country is relatively densely populated in areas where construction is feasible, and secondly, the capacities of acceptance of wind power in each utility company are limited because of its intermittency.
The official government target for wind power in Japan by 2010 is 3,000 MW. Achieving this figure could face unnecessary difficulties, however, due to the current RPS law and the lack of co-operation from power companies in introducing renewable energy, especially wind projects, into the grid.
3. 1 Background of renewable energy17
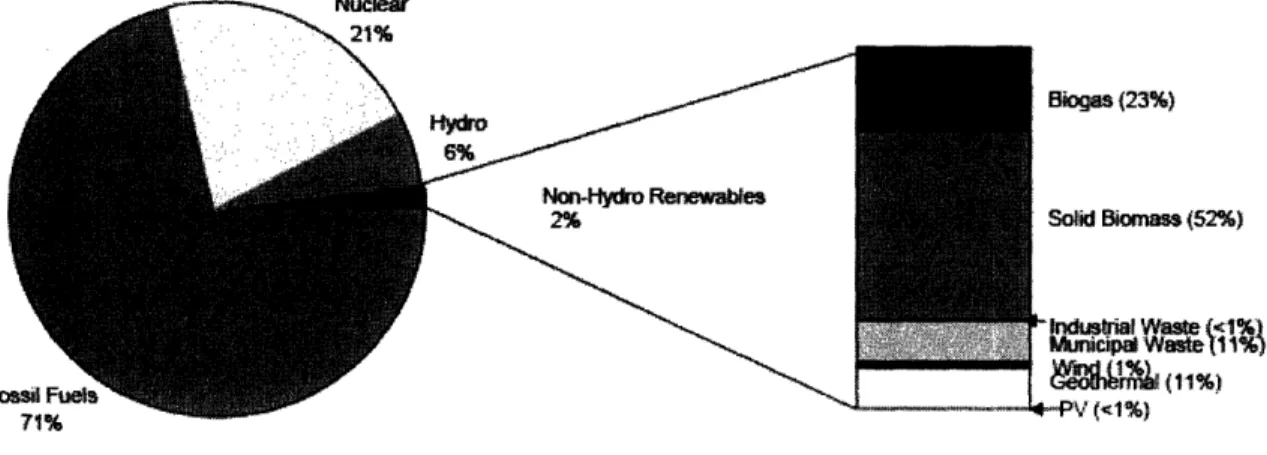
Japan is an island nation of about 127 million people living in a land area slightly smaller than California.' Japan generated 1,097 billion kWh of electricity in 2002, of which 71% was generated from fossil fuels, 21% from nuclear power plants, 6% from hydropower and 2% from non-hydro renewables.19 (See Figure 3-3) Japan got electricity from non-hydro renewables such as waste, biomass, geothermal, solar, and wind sources.
]as (23%) d Biomass (52%) atrial Waste (•1%) lici pWaste 11%) (1~%11w%) (t1%) F
Source: Interatic~al Energy Agency. Enermy Statistics of OECD Countries. 2001-2002 OECD/IEA, 2004, Paris.
As with Germany and Denmark, Japan became interested in renewable energy during the energy crises of the 1970s. In 1973, Japan used oil to supply 76% of its energy needs. This dependence had declined to 68% by the late-1980s.20 Japan's reaction to the energy crisis was to work towards securing stable oil supplies, promoting the development of nuclear power and renewable energy sources, and encouraging energy conservation. 21
In 1997, Japan hosted the Third Conference of the Parties to the United Nations
Framework Convention on Climate Change. During this meeting, the Conference negotiated the Kyoto Protocol, the implementation mechanism of the Climate Change Convention. Japan ratified the Protocol and has agreed to reduce its CO2 emissions to 6% less than 1990 levels by 2012. While Japan's initial interest in renewable energy was fueled by energy supply and security concerns, environmental considerations, including climate change, have continued to drive policies in recent years.
3.2 Renewable Policies17
Japan's support of renewable energy began in 1974 with the Sunshine Project, a program meant to develop alternative energy resources (including solar, geothermal, coal
gasification/liquefaction, and hydrogen) through R&D efforts.22 Solar energy efforts focused initially on solar thermal applications rather than photo voltaics, but after 1980, Japan began to fund more R&D for PV.23 The Moonlight Project, targeting R&D for technologies promoting
energy efficiency began in 1978. Together these two projects oversaw R&D programs that conducted basic research and applied the research in the projects undertaken cooperatively by government, industry, and academia.24
In 1980, Japan passed the Law Concerning the Promotion of Development and Introduction of Petroleum Substituting Energy, which charged the government with adopting guidelines for the use of alternative energy sources and technologies and fiscal measures to
-19-24
promote their development. The law also created the New Energy Industrial Technology Development Organization (NEDO) which was established to urge the development of new, non-petroleum sources of energy.25
In 1981, NEDO began conducting wind R&D under the auspices of the Sunshine Project. Between 1981 and 1986, the R&D program successfully developed a 100 kW pilot wind plant and conducted research on materials, reliability, control properties, power generation, and the
potential impact of wind-generated electricity on power grids. In 1986, the focus of R&D shifted to larger, MW-sized machines. The 1990s were characterized by a series of demonstration projects and further research, particularly into interconnection and grid stability issues.26 In the mid-1990s, the Ministry of International Trade and Industry (MITI, now METI) declared a goal of 20 MW of installed wind capacity by 2000, and 600 MW by 2010.27 The goal of 600MW by 2010 was met in 2003, so METI decided to set another goal, 3,000MW, to be met by 2010. By the end of 2004, wind power capacity in Japan was over 900 MW.28
In 1992, the government introduced the New Sunshine Program to further support alternative sources of electricity. This program combined the R&D efforts of the Moonlight Project and the original Sunshine project together into one program.29
In May 2002, Japan instituted an RPS, the "Law on Special Measures for the Utilization of New Energy, etc." This law, passed to ensure energy security and curb global warming, promotes the use of solar, wind, biomass, geothermal, and small hydro (less than 1,000 kW). This measure allows power companies to meet their obligations by producing power from new generation sources, purchasing allowable generation from others, or trading with other power companies via a renewable energy certificate trading system. Eight-year goals are to be re-evaluated and set every 4 years.30
4. Wind Power development in the United States
2003 came close to being a record-breaking year in the United States, with 1,687 MW installed, just a few megawatts shy of the 1,696 MW installed in 2001. By December 2004, following the credit's renewal, the industry brought into service only 389 MW of new equipment
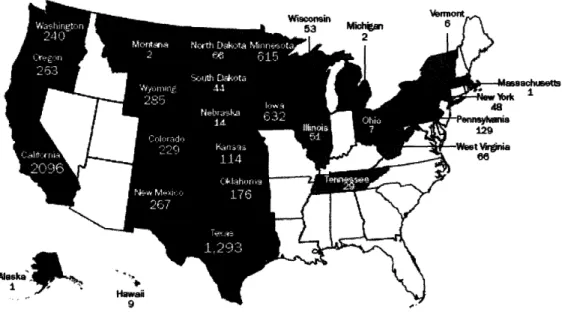
- well under what would have otherwise been installed. 31 The cumulative capacity stood at 6,740 MW at the end of 2004, with utility-scale turbines operating in 30 states.32 2005 was a record-breaking year for the United States wind energy industry, with up to 2,500 MW of new capacity installed. This should confirm the position of the United States as one of the largest wind power markets in the world.' (See Figure 4-1, 4-2)
In 2005, the development of wind energy included a number of wind farms of well over 100 MW capacity, arrays which it is possible to accommodate in the wide open spaces of many states. Projects that were to be completed before the end of the 2005 include wind farms in Washington State, Montana, Kansas and north central Iowa. Each of these projects was projected to have an eventual capacity of 150 MW. FPL Energy, the largest developer of wind farms in the United States, said its goal was to add up to 700 MW of capacity by the end of 2005.This included the 220 MW Horse Hollow wind farm near Abilene in Texas.'
The American Wind Energy Association (AWEA) estimated that these new developments in 2005 would produce enough clean power for the equivalent of 700,000 US homes, bring US$3 billion of immediate investment into the power generation sector and generate an estimated 10,000 jobs of employment nationwide. 1
-21-2000 1500
OaN
fi
-SI
MUM0
r5
500 .nd , '92 '93 '94 '95 '6 :'97 '98 '99 ' '00 0 :'02. 03 '04 '05 (prpjected)Figure 4-1 Annual Installed Capacity in the United States32
, 740MW as f 12/31/04 Wisconsin a53 Miligan
P~Ii
2 -Masschutsw rks Fia "ae Aask!a Me9' -, , 1'.Figure 4-2 United States Wind Power Capacity (MW) in 200432
m
- ]:•u
(1)Production Tax Credit
The United States was one of the pioneers in wind energy development, with hundreds of turbines erected across the mountain passes of California during the 1980s. In recent years, however, it has been held back from realizing its full potential by the intermittent nature of the main federal incentive introduced to encourage development. First brought into force in 1992, the Production Tax Credit (PTC) currently provides a 1.9 cent per kilowatt hour credit for electricity produced commercially from a wind energy facility during the first ten years of its operation. In order to qualify, a wind farm must be completed and start generating power while the credit is in place.
The justification for the credit is that it both recognizes the environmental benefits of wind energy and helps to level the playing field with the subsidies available to other fuels used for power generation. When the credit expires, however, as it has three times over the past six years, contracts are put on hold, investments trickle to a halt, and jobs are lost. During the period from the PTC's last expiry in December 2003 until its extension in October 2004, for example, thousands of jobs were lost and over US$2 billion in investment were put on hold. By the end of 2004, following the credit's renewal, the industry had brought into service only 389 MW of new capacity, well under what would otherwise have been installed. Renewal of the PTC is the main reason for the boom in construction activity during 2005.1
The American Wind Energy Association is continuing to lobby in and outside Congress for a longer term renewal of the PTC so that both financial stability and continuity can be maintained in the wind power industry.
(2) Renewable Portfolio Standards
A second factor which has encouraged wind energy in the US has been the introduction of a Renewable Portfolio Standard in a number of states. This lays down an increasing percentage of renewable electricity which utilities are expected to source within a prescribed timescale. Twenty
-states have now introduced some form of RPS, plus the District of Columbia. In Illinois, for example, the aim of the RPS is for renewables to reach a contribution to electricity supply of 8% by 2012.'
The introduction of an RPS in New York State has provided the impetus behind the largest wind park yet planned for any of the east coast states, where development has lagged far behind other parts of the US. The New York RPS calls for 25% of the state's electricity to be supplied by renewable energy in 2013, resulting in five power generators being selected in a first phase. 31 Among them is the Maple Ridge project for 120 Vestas 1.65 MW turbines to be erected on a site not far from the town of Harrisburg. The wind farm will eventually be expanded to a capacity of 240 MW.1
(3) Utility Investment
The rising cost of natural gas, which now accounts for about 20% of US electricity generation, has also encouraged some utilities to look more closely at the attractiveness of wind. Wind energy provides stable, affordable insurance against the risk of increases in the price of natural gas and other fuels. Wind energy development can also cut consumers' bills by lowering demand for natural gas - particularly during winter peak demand periods - and extending its supply. A growing number of energy companies have started to invest in the wind power business. Recent examples include AES Corporation, which acquired California-based wind developer SeaWest Wind Power, and Goldman Sachs, which bought Houston-based developer Zilkha Renewable Energy.1
Jobs are an important bonus of the US wind industry's increased level of activity. A major study released last autumn by the Renewable Energy Policy Project reported that boosting wind energy from 6,000 MW to 50,000 MW would create 150,000 manufacturing jobs. A number of companies have recently announced plans for new or expanded production in the U.S., including
Spanish turbine maker Gamesa, blade manufacturer LM Glasfiber, and turbine maker Vestas-American Wind Technology.1
The AWEA estimates, using growth projections of 3,000 MW installed every two years over the next four years, that the U.S. could reach 15,000 MW of capacity by the end of 2009. If the PTC were renewed on a continual basis, that figure could be substantially higher. Current
AWEA estimates are that by 2020 wind power could provide 6% of U.S. electricity, from 100GW of wind, a share similar to today's contribution from hydro-electric plants.'
(4) Unlocking transmission barriers
In order to unlock the vast wind energy potential of America's heartland and transport that power to market, it is critical that wind generators be able to gain access to the transmission
network on fair terms compared with other generation technologies. Fortunately, transmission barriers, which have slowed expansion of wind power in many regions of the US, are beginning to recede. Federal regulators have proposed a dramatic overhaul of the wholesale electricity market structure that includes fair treatment of wind energy in transmission pricing. Among other changes, this would eliminate all penalties associated with wind's variable output when that variability does not result in increased costs to the system.
However, carrying out these changes will be difficult due to power struggles between federal and state authorities. Wind development also requires investments in bulk transmission capacity from the rural, sparsely populated but windy regions to markets in major population centers. In Minnesota, for instance, the state has authorized construction of the largest single transmission project in over twenty years specifically to tap the state's powerful winds.'
The United States still has far to go before wind power realizes its full potential -enough, according to federal studies, to meet more than twice the nation's electricity demand. The state of North Dakota alone has about fifty times the wind resource of Germany. But the pace of wind
-power development in the U.S. will depend to a large extent on the adoption of steady, supportive policies.'
4.1 Federal renewable policy17
4.1.1 Background
The United States has the largest economy in the world, with a population of 290 million in an area about two and a half times the size of Western Europe.33 In 2003, the United States
34
generated 3,883 billion kilowatthours (kWh) of electricity. About 71% of United States electricity was generated from fossil fuels, about 20% from nuclear power, another 7% from hydroelectric facilities, and the remaining 2% from other renewables (Figure 4-3). Biomass (71%) was the predominant non-hydro renewable fuel for electricity generation in 2003, followed by geothermal and wind. Solar thermal and photo voltaics together accounted for less than 1% of U.S. non-hydro renewable generation.
In the United States, energy policies are the product of both individual state and federal policies. California is featured because it has been among the most active states in encouraging
35 renewable energy.
-Scar
Thermal and 1%PV ...
L
thrrW(1%
Biomass (71%)
Wind (13%)
Solar Thermal and PV (<1%)
Source: Energy Information Administrabo Electric Power Anual 2003, December 2004, Table 1. 1, ht1p:,w.ea.degov/icneafletnecriyvepDadf and Electric Power Monthy, November 2004, Tabe 1.1.a, http:lw v.ea.doe.govfcreafeectrcitepnVeýý.pdf. accessed December 15, 2004.
Figure 4-3 United States Electricity Generation, 2003
4.1.2 Federal Non-hydro Renewable Energy Policies
Federal policies used to promote renewable energy have included financial incentives, regulatory measures, and research and development (R&D) programs.
In response to energy security concerns of the mid-1970s, the United States passed the National Energy Act of 1978 (NEA), which sought to decrease the nation's dependence on
36
foreign oil and increase domestic energy conservation and efficiency. The Public Utility Regulatory Polices Act (PURPA) of 1978, part of the NEA with a stated purpose of improving energy conservation and energy efficiency in the utilities sector, also had a major impact on the development of renewable electricity.37
PURPA opened the door to competition in the electricity supply of the United States by requiring utilities to buy electricity from qualifying facilities (QFs), which are defined as nonutility facilities that produce electric power using cogeneration technology or renewable power plants with capacities of less than 80 MW. Utilities are required to purchase power from qualifying facilities at the utilities' "avoided cost." The interpretation of "avoided cost" was left up to individual states. This resulted in a number of avoided cost calculations on forecasts of
-27-Nuclear
20%
natural gas and oil prices, which were higher than prices actually turned out to be, resulting in favorable investment conditions for renewable power.38 However, in 1995, the Federal Energy
Regulatory Commission (FERC) took responsibility for interpreting "avoided cost," directly linking it with the costs a utility would incur either generating the power directly or purchasing it from another supplier. This interpretation resulted in lower avoided costs than the interpretations of some states, including California.39
The United States has also used financial incentives to try to spur the growth of renewable energy. The 1978 Energy Tax Act (ETA), part of the NEA, included a 30-% investment tax credit for residential consumers for solar and wind energy equipment and a 10-% investment tax credit for business consumers for the installation of solar, wind, geothermal, and ocean thermal
technologies. Although the level of these tax credits changed over time until their expiration in 1985, the fundamental policies were developed with the passage of the ETA.40
The most important law promoting renewable energy in the 1990s was the Energy Policy
41
Act (EPACT) of 1992. EPACT established a 10-year 1.5 cents per kWh inflation-adjusted production tax credit (PTC) for tax-paying privately and investor-owned wind projects and closed-loop biomass plants brought online between 1994 and 1999. The incentive expired in 1999, but was renewed twice, later in 1999 and 2001 before its expiration at the end of 2003. Late in 2004, it was extended again through 2005. This latest extension increased the number of renewable technologies that were covered by the incentive.
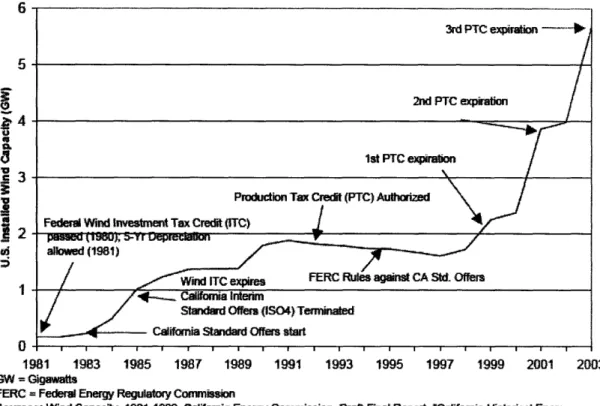
Figure 4-4 illustrates the relationship between wind capacity in the United States and the PTC. Although the graph depicts total installed capacity in the United States, nearly all the windpower capacity was in California until the 1990s. EPACT also created a Renewable Energy Production Incentive (REPI) for electricity generated from biomass, geothermal, wind, and solar
available through REPI is subject to annual congressional appropriations, thereby making the availability and level of the credit uncertain.
6 5 I
I
1981 1983 1985 198T 1989 1991 1993 1995 1997 1999 2001 2003 GW = GigawattsFERC = Federal Energy Reguatory Commission
Sources: Wind Capcity, 1981-1989, Califorria Energy Commission, Draft Final Report, '"aih,~faa -storical Energy
Stalisfbcs,' January 1998, P300-98-001; 1990-2002, Energy ornabon Adminitratio Annual Ene Review 2002. Table
8.7a; Policies comnpiled by Office of Integrated Analysis and Forecasting, Energy ~nformaton Administration.
Figure 4-4 Wind Capacity & Major U.S. and State Policies, 1980-2003
29
-FERC Rules against CA Std. Offers Ca~aioma Interim
Standard Offers (IS04) Terminaed
e
4.2 California17
Until the early 1990s, nearly all growth in non-hydro renewable capacity in the United States took place in California. In more recent years, other states have begun pursuing policies to increase non-hydro renewable generation, and in particular, states are developing Renewable Portfolio Standards (RPS). However, most of these initiatives are still relatively new and their impact on non-hydro renewable generation is still unclear. For a review of current State RPS policies, renewables mandates and targets see "State Renewable Energy Requirements and Goals: Status Through 2003."42 A comprehensive overview of state renewable energy incentives is provided in the Database of State Incentives for Renewable Energy.4 3Because this paper examines
historical trends in non-hydro renewable generation, it is enlightening to examine California's policies that, along with Federal statutes, encouraged the development of non-hydro renewable energy there. Needless to say, the Federal laws described above-particularly PURPA and EPACT-have had a significant influence on the development of renewable energy in California. However, many laws enacted at the state level have also significantly affected the development of renewables in California.
4.2.1 Background
California is the most populous state in the United States, with about 35 million people spread out over 150,000 square miles. California produced 277 billion kWh of electricity in 2003 and imported 22% of its electricity needs.44Of the electricity generated within the state, 58% was generated from fossil-fuel sources, 15% from nuclear power plants, 18% from large- and
small-scale hydropower plants, and about 9% from other renewables (Figure 4-5). Most of the non-hydro renewable power was generated by geothermal energy, with smaller amounts from biomass, wind energy, and solar.4 5
Nuclear I J:01 Bionass (24%) Non-Hydro Renewales 9%•/ SGeotem-ial (58%) Wind (15%)
Source: California Energy Commission, "Catifora Gross System Power for 2003,
htp~•lAvw.enerqy.ca.qovfelectrcictqross system power.html, accessed August 12, 2004.
Figure 4-5 California Electricity Generation, 2003
4.2.2 Non-hydro Renewable Energy Policies
California began providing tax incentives for installing renewable
46
technologies-particularly solar energy devices-in 1976 with a 10-% investment tax credit. Two years later, the amount of this investment credit was increased to 55%. The investment credit was consistently extended (though the periodic extensions did create uncertainty in the market) through 1986 for wind energy projects and into the 1990s for other renewable projects.4 6 This state incentive was in addition to federal incentives for the construction and use of renewable energy technologies that were offered between 1978 and 1985. In 1978, California started the Wind Energy Program with a target of having 500 MW of wind capacity installed by the mid-1980s.47 Although the federal government was also funding R&D for wind energy technologies at this time, the California Energy Commission (CEC) wanted to explore a wider range of designs than were eligible for the federal program. As such, it funded several turbine projects to determine the efficacy of different designs.48
-31 ---
C----
In the early 1980s, California moved from funding strict R&D projects for wind energy to focusing on demonstration projects for wind turbines. These demonstration projects resulted in an improvement in design that helped to bring costs down for wind energy developers. Throughout this period, the focus was on relatively small machines compared to the multi-megawatt R&D efforts at the federal level.47
In 1982, California's Public Utilities Commission (CPUC) defined California's interpretation of the term "avoided cost" as used in PURPA. The interpretation was based on long-term avoided costs partially derived from forecasts of natural gas and oil prices. The price reverted to the actual avoided cost after the first 10 years. However, actual avoided cost turned out to be much less than contract costs because oil prices had fallen significantly during the
mid-1980s. Thus, after the initial 10-year period, the price that wind producers were receiving dropped dramatically in what is sometimes called the "11-year cliff."4 9 In 1982, the CPUC
created the "Standard Offer" contracts to secure renewable electricity generation. The contracts were 10-year power purchase agreements for a price of 6.9 cents per kWh. The contracts were based on the notion that there should be no difference in electricity rates regardless of whether the electricity was generated by a utility or by a qualifying facility.50
The next year, CPUC authorized Interim Standard Offer Number 4 contracts (ISO4), which were granted for periods of 15-30 years, with prices guaranteed for the first 10 years. The majority of California's wind energy capacity was installed through this program, starting in late 1983. Wind energy projects began reaching the "11-year cliff' in 1992. The "cliff' reduced the profitability of California wind developments after their first 10 years of operation.
Nonetheless, by 1985, mostly via ISO4, California had installed 1,000 MW of wind
51
capacity. By 1990, this had increased to 1,799 MW of wind capacity, which was more than half 52
In 1999, California began offering a 1.5 cents per kWh customer credit for purchasing renewable electricity. The rebate was reduced to 1 cent per kWh in 2000, with a ceiling of $1000
per year.47 This incentive is similar to the demand-pull incentive (Ecotax exemption) used in the
Netherlands, though it has not been as successful in increasing the demand for non-hydro renewable electricity.
In 2002, California introduced an RPS requiring utilities to purchase 20% of electricity from renewable generators by 2017. All non-hydro renewable sources are eligible, as well as small-scale hydropower and municipal solid waste if it is not combusted. To reach 20%, utilities are expected to increase the proportion of power they get from renewable generators by at least 1% each year through 2017.5 3 The CEC estimates that by 2017 California will need to generate
30,610 billion kWh of non-hydro renewable generation in addition to the approximately 2,500 54 billion kWh of non-hydro renewable generation in 2003 to meet the RPS requirement.
-5. Wind power development in Europe
5.1 Germany55
With 2,000 MW of new installations, Germany accounted for almost half of the new capacity installed in the EU-15. The wind power capacity for the country totaled 16,600 MW in 2004. Germany remains the world's biggest market, in spite of a considerable, and anticipated, decline in its growth rate. In a typical wind year, Germany's wind farms generate enough to meet about 6% of the country's electricity needs, according to the German Wind Energy Association. 56
The German wind energy industry currently employs 45,400 people. Wind power
generation is concentrated in the northwestern regions of the country: Schleswig-Holstein, where the target of 25% of power to be generated from wind by 2010 has already been achieved; and other provinces in Northwestern Germany such as Mecklenburg-West Pomerania, Saxony-Anhalt, Lower Saxony, and Brandenburg. 56
3,500 3,248 2,640 2,650 2,500 - - -2,054 S 2,000 ... 1,568 1,671
1,500
CL 1,000 793500 420 -529
500095 150
1992 1993 1994 1995 1996 1997 1998 1999 2000 2001 2002 2003 2004 Year18,000 16,000 14,000 12,000 10,000 O 8,000 0 6,000 4,000 2,000 1992 1993 1994 1995 1996 1997 1998 1999 2000 2001 2002 2003 2004 Year
Figure 5-2 Cumulative installed wind power capacity (MW) in Germany
5.1.1 Background17
Germany has a population of 82 million in a land area slightly smaller than that of Montana." Although Germany's economy and electrical grid are smaller than those of the United
States, it is one of the largest economies in the world. Non-hydro renewable power generation in Germany decreased over the period 1980 through 1987, declining from 5.2 billion kWh in 1980 to 3.8 billion kWh in 1987. After 1987, however, non-hydro renewable generation has consistently increased each year, regaining 1980 levels in 1991. Installed non-hydro renewable electricity generation capacity in Germany was very small until the early 1990s, when installation of wind turbines and solar panels began to increase. Between 1987 and 1997, German non-hydro
renewable generation grew at about 10% per year to nearly 10 billion kWh. During this time, the capacity of non-hydro renewable generation grew by a factor of 20, from less than 100 MW in
-58
1987 to more than 2,000 MW in 1997. Germany also had the greatest installed wind capacity in
59
the world, with more than 14,500 MW at the end of 2003.
In 2002, Germany generated 72 billion kilowatt hours of electricity, of which about 63% was from fossil fuels. (See Figure 5-3) Germany generated about 29% of its electricity from nuclear power, about 4% from hydropower, and about 5% from non-hydro renewable sources.60
The contribution of renewables has increased since 2001, mainly due to wind power. Over 3,200 MW of wind capacity were added in 2002, followed by another 2,600 MW in 2003, 2,000MW in 2004, bringing the cumulative installed capacity to 16,600 MW by the end of 2004.61
Nucar 29% Fol B8ogps (8%) Solid Biamass (3%) Waste (43%) Wind (45%) PV (1%) Source: International Energy Agency, Energy Statistics of OECD Countries. 2001-2002. OECDlIEA, 2004, Paris.
Germany became interested in spurring the growth of renewable energy in the 1970s during the energy crisis brought on by the high cost of imported oil. Germany used a variety of policies to reduce oil imports, including subsidizing domestic coal, increasing the import quota on coal, expanding nuclear generation, and increasing research and development for new energy
62
technologies (mainly renewables). (See Figure 5-4)
C D.U . % 4.5% 4, 4.0% 3.5% 2 3.0% m 2.5% W 2.0% g 1.5% 1.0% S0.5% g 0.0% Z 1980 1982 1984 1986 1988 1990 1992 1994 1996 1998 2000 2002 kW = Kilowatts MW = Megawatts PV = Photovoltaic
Sources: Generation, Energy Information Administration, International Energy Annual; Policies, various sources compiled for and cited in this article by Office of Coal, Nuclear, Electric and Alternate Fuels, Energy Information Administration.
Figure 5-4 Germany's Non-hydro Renewable Energy Policies and Growth, 1980-2002
Although the development of renewable-generated power was initially driven by a desire to reduce dependence on foreign oil, current renewable energy policies are developed with the goal of reducing air pollution and carbon dioxide emissions. More recently, the German
government announced its intentions to phase out nuclear power over the next 2 decades, a move 63
that will probably continue to drive demand for renewable energy in the future. Since 1998, the
-37-Green Party has been part of the ruling coalition in Germany and has had a major role in affecting the country's energy and environmental policies.64
Germany and the United States enacted similar policies to promote the growth of renewable energy. However, Germany has surpassed U.S. installed wind capacity, despite the smaller size of the German grid.
5.1.2 Research, Development, and Demonstration (1974-present) 17
Germany invests significant resources into the development of renewable energy. As in the others country, early R&D into wind turbines was completely government-funded and conducted by companies in the aerospace industry. From 1975 through 2000, Germany spent about $215 million (1995 dollars) on R&D of wind turbine technology. Funding levels for wind R&D varied from year to year, peaking at more than $28 million (1995 dollars) in 1980 and 1981
64 before declining and leveling off in the early 1990s at about $6 million (1995 dollars) per year. While funding levels for wind R&D were higher in the United States, over the next decade, and then increasing beginning in FY 1992.65
Germany began the 250-kW Prototype Program for wind turbines in 1986. The program subsidized the first five turbines of a company after the prototype was constructed and tested. Although more than 50 commercial wind turbines were installed under that program, costs remained too high for market conditions in Germany at the time. In 1989 this was followed by the
100-MW Demonstration Program, which provided a subsidy of 0.08 Deutsche Marks (DM) per
62
kWh (4.3 cents U.S.) for wind-generated electricity by turbines accepted into the program. Participants could choose either this production subsidy, or a 60-% capital investment grant for
66
the cost of the facility. Due to its popularity, this program was expanded in 1991 to the 250-MW
67
68
onto the national grid. These latter programs, with their focus on large turbines, mirrored the wind energy efforts in the United States. Therefore, the wind R&D programs in the two countries were very similar in their funding patterns and their focus.
5.1.3 Electricity Feed-In Law (1991) and Renewable Energy Law (2000)17
Germany's Electricity Feed-In Law, enacted in 1991, changed the market conditions for renewable electricity producers by mandating utilities to buy renewable electricity and by
dictating the price that renewable electricity producers would receive for their power. Utilities were required to buy renewable power at 90% of the retail rate for electricity. This law did two important things for renewable electricity producers in Germany. First, it created a market for renewable electricity. Second, it guaranteed producers of renewable electricity a sustainable price high enough to cover their long-term costs. Both of these factors combined made renewable
electric generating capacity a better investment.
In many ways, PURPA is similar to Germany's Feed-In Law. They both require utilities to purchase electricity from nonutility renewable producers, and they both define (if loosely, in the United States) the price at which the transaction will take place. A difference, however, is that in the United States, calculations of "avoided cost" tended to be lower and closer to market
wholesale electricity rates than the higher fixed-price German utilities are required to pay to
69
renewable electricity producers. This means that in Germany, where the price paid to producers of renewable energy was higher, new renewable technologies became competitive earlier. Additionally, while the buyback rate for renewable power in Germany was linked to future retail prices in California, buyback rates for the first 10 years were linked to projections of future oil and natural gas prices. After 10 years, buyback rates reverted to actual costs, which were much lower, thereby decreasing the rates (premiums) paid to renewable power producers.
-Another major difference between Germany's Feed-In Law and the U.S. PURPA is that the main purpose of the Feed-In Law was to promote the use of renewable resources, while the main purpose of PURPA was to promote energy efficiency. In the United States, before FERC interpreted the meaning of "avoided cost" in 1995, PURPA also promoted the development of renewables in states with favorable "avoided cost" calculations (like California). However, after FERC's interpretation of "avoided cost," the law became less favorable to renewable producers, but was still useful in its original purpose of promoting efficient nonutility electricity generation.
70
Since the U.S. net metering programs obligate utilities to purchase renewable power, they can be compared to Germany's Feed-In Law. Although net metering allows consumers to sell excess electricity back to the grid, the policy is not analogous to Germany's energy policies, which obligate utilities to purchase renewable power from private producers, regardless of their size. The German law encourages much larger contributions to the grid from private renewable energy producers.
In 2000, Germany passed the Renewable Energy Law, which set specific prices that independent renewable power producers could receive for each type of renewable energy source, although for a limited amount of time. For instance, in 2000, a new wind turbine project would be paid 0.178 DM per kWh (U.S. 11 cents per kWh) for the first 5 years and then the rate would begin to fall. The decreasing nature of the prices is reflective of Germany's expectation that these projects would become increasingly cost-competitive. The buyback tariff rate for PV systems was
C 0.51 per kWh (U.S. 45 cents per kWh) and was set to decrease by 5% annually.7 1' 72 Finally, this
law also dictates that the costs of grid connection for renewables projects are the responsibility of the utility, which can be passed on to consumers.62 This new law, while still dictating the buyback rates paid by utilities, can more precisely target each renewable energy technology with a buyback rate designed to further its growth. Since each technology's cost of generation differs, the support
It is clear that while the German Feed-In Law had a significant positive effect on the development of renewable electricity generation in Germany, PURPA did not have a similar effect throughout the United States. While some states, including California, did manage to install new renewable electric generation capacity, PURPA was a necessary measure, but not a sufficient incentive for investors to develop new renewable energy projects.73
One reason that PURPA did not have a similar effect as Germany's Feed-In Law could be the timing. The wind industry was significantly more developed, both in terms of technology and in terms of costs, in 1991 when Germany passed its Feed-In Law than in 1978 when PURPA was passed. Given that, subsequent development of wind turbines in the United States was undertaken with the relatively inefficient machines of the early 1980s, while post-Feed-In-Law wind turbines in Germany were both cheaper and more advanced. If the timing of PURPA versus Germany's Feed-In Law was the only consideration, one would have expected the U.S. market to begin to grow as technological advances in turbine designs brought costs down. However, even with the advances in turbine technology, PURPA did not begin to create the kind of market growth associated with the Feed-In Law in Germany until additional incentives (in the form of the U.S. Production Tax Credit, among others) were added in 1992.
-41-5.2 Denmark
Denmark's total cumulative installed capacity for wind power topped 3,100 MW in 2004. In 2003, Denmark installed 220 MW. Most of the new capacity came from offshore projects: Rodsand/Nysted (158 MW); Samso (23 MW), and Frederickshaven (10.6 MW). Denmark generates some 20% of its power from wind. It is the nation that gets the highest percentage of its electricity from wind.32 (See Figure 5-5, 5-6)
Denmark's wind power manufacturing industry is a major commercial success story. From a standing start in the 1980s to a turnover of more than C 3 billion, the wind sector has grown faster than any other business sector in Denmark and is bigger than the cement or steel industries. Danish wind turbines dominate the global market, and the country has forged itself a position at the head of the fastest growing energy source in the world.31
Over the past 15 years, the Danish wind turbine industry has grown into one of the heavyweights in machinery manufacturing. Alongside the two major turbine manufacturers-Vestas and Bonus -there are a score of large component companies and dozens of smaller suppliers. From a few hundred workers in 1981 the industry now provides jobs for over 20,000 people in Denmark - more than the whole electricity sector - and further thousands in
manufacturing and installation around the world.31
The past decade in particular has seen a dramatic increase in the production capacity of Danish turbine manufacturers. Annual output, mainly for export around the world, increased from 500 MW in 1994 to over 3,100MW in 2004. Despite the emergence of competing manufacturing countries, 40% of the wind turbine capacity being installed globally today is of Danish origin. 31
1992 1993 1994 1995 1996 1997 1998 1999 2000 2001 2002 2003 Year
Figure 5-5 Annual installed wind power capacity (MW) in Denmark
(* The cumulative installation from its conception to 1992 was 454.)
3,500 3,000 2,500 2,000 1,500 1,000 500 2004 1992 1993 1994 1995 1996 1997 1998 1999 2000 2001 2002 2003 2004 Year
Figure 5-6 Cumulative installed wind power capacity (MW) in Denmark
43 -600 500 400 S300 0 200 100
(1) Government commitments31
One reason for the success in the Danish wind industry is the commitment from successive governments to a series of national energy plans aimed at reducing dependency on imported fuel, improving the environment, and moving towards greater sustainability. Nuclear power has been rejected as an option and there is a firm commitment to completely phase out coal as a fuel in power stations. No new coal-fired capacity will be installed. These domestic policies have in turn helped spawn a thriving export industry for wind turbines.
In 1981, the first Danish government energy plan envisaged that 10% of electricity consumption should be met with wind power by 2000. The government then expected that this could be reached by installing 60,000 wind turbines with an average capacity of 15 kW. The 10% target was in fact reached three years early with less than 5,000 turbines with an average size of
230 kW. In 2004, wind power accounted for more than 20% of Danish electricity consumption.3 1 Following a new agreement in parliament adding a total of 750 MW to existing installed capacity will, by 2010, increase the proportion to more than 25%. This is a higher proportion than any other country in the world.
By 2030 wind is expected to be supplying up to half of the country's electricity and a third of its total energy. To reach this level, a capacity in excess of 5,500 MW will need to be installed, a good proportion of it offshore.
(2) Engineering innovation31
Having already achieved more than 20% penetration, fresh challenges have emerged for wind power in Denmark, especially in the context of a new liberalized EU internal electricity market. The Danish authorities, transmission system operators, power companies and
manufacturers are now working closely to find new market bases, as well as technical solutions for introducing even more wind power into the system.