HAL Id: hal-00019933
https://hal.archives-ouvertes.fr/hal-00019933
Submitted on 2 Mar 2006
HAL is a multi-disciplinary open access
archive for the deposit and dissemination of
sci-entific research documents, whether they are
pub-lished or not. The documents may come from
teaching and research institutions in France or
abroad, or from public or private research centers.
L’archive ouverte pluridisciplinaire HAL, est
destinée au dépôt et à la diffusion de documents
scientifiques de niveau recherche, publiés ou non,
émanant des établissements d’enseignement et de
recherche français ou étrangers, des laboratoires
publics ou privés.
equilibrium radiation from an inductively coupled
plasma in the near-UV to near-IR spectral region for a
martian-type CO2-N2 mixture
Damien Vacher, Géraldine Faure, M. Lino da Silva, M. Dudeck, Pascal André
To cite this version:
Damien Vacher, Géraldine Faure, M. Lino da Silva, M. Dudeck, Pascal André. Definition of a new
level-one test case - measurements of equilibrium radiation from an inductively coupled plasma in the
near-UV to near-IR spectral region for a martian-type CO2-N2 mixture. International Workshop on
Radiation of High Temperature Gases in Atmospheric Entry - Part II, 2004, Porquerolles, France.
pp.99. �hal-00019933�
DEFINITION OF A NEW LEVEL ONE TEST CASE – MEASUREMENTS OF EQUILIBRIUM RADIATION FROM AN INDUCTIVELY COUPLED PLASMA IN THE NEAR–UV TO NEAR–IR SPECTRAL REGION
FOR A MARTIAN–TYPE CO2–N2MIXTURE
D. Vacher1, G. Faure1, M. Lino da Silva2, M. Dudeck2, and P. Andr´e1
1Laboratoire Arc ´Electrique et Plasmas Thermiques, CNRS, 24 Av. des Landais, F63177 Aubi`ere cedex, France
2Laboratoire d’A´erothermique, CNRS, 1C Av. de la Recherche Scientifique, 45071 Orleans cedex 2, France
ABSTRACT
A new test case, using a quasi-similar methodology and experimental set-up than previous test case 1, is presented in this paper. An inductively coupled plasma torch,
work-ing at atmospheric pressure, is used to create CO2–N2
Martian-like plasma (97% CO2–3% N2). The operating
frequency and power are 64 MHz and 3 kW respectively. This kind of apparatus allows obtaining plasma in chem-ical and quasi-thermal equilibrium. The plasma charac-terization will consist firstly to determining the chemi-cal composition; a chemi-calculation code based on the Gibbs free energy minimization is used. Secondly, the radial temperature profiles will be given through Abel inversion of atomic and molecular systems. The spectral measure-ments cover the [250–800] nm range and are performed inside the induction coil. Each interesting spectrum is Abel-inverted and calibrated in order to determine the volumetric emission coefficient. These spectra are then compared to the line-by-line spectral code SESAM used for the simulation of the radiative emission of entry-type plasma.
1. INTRODUCTION
Different levels of test-cases have been defined in the frame of the radiation working group. Such test-cases are useful for the evaluation and validation of radiation models used for atmospheric entry applications.
Test case n◦ 1 is devoted to the validation of models
of line-by-line spectroscopic codes and of spectral data used for line-by-line radiation calculations. As the sim-plest case is the modelling of plasma in thermo-chemical equilibrium, an ICP torch, which allows obtaining such conditions, is used. Test case 1 was initially intended to validate measurements in air plasma (Laux 1993). This new level of test case 1 proposes a spectroscopic study of plasma formed with a Martian-like atmosphere gas mix-ture, which will be useful for the validation of spectral databases likely to be used for Martian-type entries radi-ation simulradi-ations (SESAM code).
The outline of the paper is as follows. In section 2, all the characteristics of the experimental set-up and the calibra-tion process are given. In seccalibra-tion 3, experimental spectra in the range [250-800] nm are presented. In section 4, we discuss about the validity concerning the thermal and chemical equilibrium assumptions. On one hand, thermal equilibrium is considered by comparison between exper-imental and numerical spectra. On the other hand, the determination of the reaction rates leads us to say that chemical equilibrium is reached under our experimental
conditions. Then, the chemical composition of a CO2–N2
Martian-like plasma (97% CO2–3% N2) is given through
the calculation code based on the Gibbs free energy min-imization.
2. EXPERIMENTAL SET-UP
2.1. Main characteristics
The ICP-T64 torch located at the L.A.E.P.T. (Thermal Plasmas and Electrical Arc Laboratory) in Clermont-Ferrand, France, is a classical ICP torch able to work
with different kinds of plasma gas (air, argon, CO2, N2
and gas mixtures). This inductively coupled plasma sys-tem operates at a frequency of 64 MHz. A seven-turn induction coil, cooled by air, is used to ignite and sustain
the CO2–N2 plasma. It can be noted that the use of a
seven turn induction coil modify significantly the plasma aspect compared with that one with a classical five turn. We observed a brighter needle along the axis. A first ex-planation concerns the fact that the discharge is not only inductive but there’s also a capacitive effect, involving an axial component of the electric field. A second one con-cerns the consideration of the skin effect, which can be different according to the gas used to form the plasma. So, in our case, the analytical zone is relatively weak, near the plasma axis.
The main features of the experimental set-up and operat-ing conditions are reported in Fig. 1 and Tab. 1, respec-tively. The plasma is generated through the induction coil by a radio frequency (RF) of 64 MHz delivering a power up to 3 kW. The plasma is confined within a 28 mm
quartz tube. The plasma gas is injected at a fixed rate of
6.6 L/min (In order to have a mixture of 97% CO2–3%
N2in molar proportion, the CO2and N2flow rate is 6.4
and 0.2 L/min respectively).
Figure 1. Plasma torch and detection experimental set-up
Inductively coupled plasma
Manufacturer/type: D´efi Syst`emes/ICP T64 Power supply: 64 MHz, 3 kW Tuning: Automatic adaptation Inductor: Seven-turn air-cooled coil Plasma gas flow rate: 6.6 L/min
Operating pressure: atmospheric pressure
Torch: 28 mm internal diameter quartz tube
Optical set-up Spectrometer: Chromex ST 138 500 mm focal length Czerny-turner mounting Entrance slit: e = 100 µm Gratings: 1800 grooves/mm
Detector: CCD EEV 1152x1242 pixels Spatial resolution: 1 mm
Apparatus function: 0.08 nm
Table 1. Main features of the experimental set-up
The optical set-up, placed at 34.3 cm from the plasma
axis, leads to a spatial resolution of 1mm. Spectral
lines intensities are measured with a 0.50 m focal length Czerny-Turner monochromator connected to a CCD de-tector (1242x1152 pixels, each pixel having a width of 22.5 µm). An 1800 grooves/mm grating is used. Its
ap-paratus function ∆λapp, assimilated to a Gaussian profile
with a full width at half maximum, is calculated from the relation
∆λapp=F W HM · fp· D−1 (1)
where F W HM is expressed in pixels, D−1 represents
the gratings dispersion (1.025 nm/mm) and fp defines
the pixel dimension (22.5 µm). The calculated value of gives 0.08 nm for an entrance slit equal to 100 µm.
2.2. Intensity calibration
The measured emission spectra must be corrected from the spectral response of the optical device, which include lens, monochromator and CCD detector. So, a calibra-tion in intensity, between 250 and 800 nm, is necessary to take into account all these effects. A Deuterium lamp (HAMAMATSU L1626 30 W) and a tungsten lamp (OS-RAM WI14) are used to cover the range [200-400] nm and [300-800] nm respectively.
The calibration procedure is realized in the same condi-tions that ones considered for the experimental spectral acquisitions. The spectral radiance of the two calibration lamps are reported on Fig. 2; Fig. 3 represents the spec-tral response of the optical system. The problem of the chromatic aberration is not considered in this paper as a calculation shows that it is inferior to the spatial resolu-tion of the optical set. Fig. 4 reports the influence of the chromatic aberration as a function of wavelength. It can be seen that it becomes significant at wavelengths near 300 nm. 2000 3000 4000 5000 6000 7000 8000 0 2 4 6 8 10 12 14 16 18 20 22 24 Wavelength (A) Spectral Radiance (W/m 2−sr)
Figure 2. Spectral radiance of the Tungsten and Deu-terium calibration lamps
3. EXPERIMENTAL SPECTRUM
Optical emission spectroscopy is the simplest non-intrusive method for plasma diagnostics. The analyti-cal zone is limited between the fourth and the fifth in-duction coil where the luminous response is the great-est. Each spectrum corresponds to one acquisition of one second and the electronic noise is automatically sub-tracted. Fig. 5 reports a global spectrum recording from the plasma formed with a Martian-like atmosphere in the
2000 3000 4000 5000 6000 7000 8000 100 101 102 103 104 105 106 Wavelength (A)
Intensity (A. U.)
Deuterium Tungsten
Figure 3. Spectral response of the optical system for the Tungsten and Deuterium calibration lamps
Figure 4. Variation of the focal distance as a function of wavelength, with a quartz lens
range [250–720] nm. The CN molecular emission is
pre-dominant whereas the C2emission is relatively weak. We
can also observe an atomic line of carbon in the near UV at 248 nm. Measurements up to 900 nm can be carried with the optical apparatus, but a problem with the ICP facility prevented such measurements to be completed in the [720–900] nm spectral range. The measured spectra was Abel inverted and calibrated in intensity in order to obtain the volumetric emission coefficient of each inter-esting wavelength.
A special attention must be made on the application of the Abel inversion in ICP torch. The curvature of the quartz cylinder can play a non-negligible role in the ra-dial spectral acquisitions. For our experimental condi-tions, by geometric consideracondi-tions, the signal received by the optical device does no longer correspond to the posi-tion concerned inside the plasma when the radial posiposi-tion of the optical fibre is above 7 mm. In our case, as the an-alytical zone is restricted to 2–2.5 mm around the plasma axis, the Abel inversion can be done without errors.
2000 2200 2400 2600 2800 3000 3200 3400 0 0.5 1 C Atomique 35000 3700 3900 4100 4300 4500 4700 4900 25 50 Intensity (kW/m 2−sr) . CN Violet ∆v=−1 CN Violet ∆v=0 CN Violet ∆v=+1 50000 5200 5400 5600 5800 6000 6200 6400 0.5 1 1.5 C2 Swan ∆v=0 65000 6700 6900 7100 7300 7500 7700 7900 0.5 1 1.5 Wavelength (A)
Figure 5. Emission from the CO2-N2 plasma inside the
induction coil of the torch
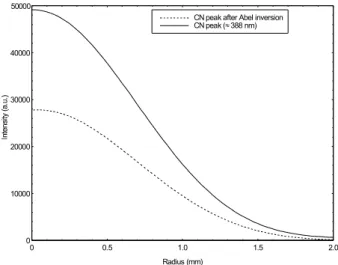
Fig. 6 represents different intensity radial evolutions of CN peaks and Fig. 7 shows the result of the application of Abel inversion for a particular wavelength. It must be noted that each intensity radial evolution of wavelength is interpolated by cubic splines and fitted by a polynomial of degree 9 before applying the Abel inversion.
Figure 6. Radial evolution of intensity peaks of the CN bands
4. THERMODYNAMICAL EQUILIBRIUM
Inductively coupled plasma working at atmospheric pres-sure can generally be considered in thermodynamical equilibrium. Depending of the type of gas and the torch power, a little departure from thermal equilibrium can be observed in such plasmas. It is the case for air plas-mas where a factor of 1.1 to 1.2 exists between the elec-tronic and the heavy particle temperatures. It will be shown from experimental spectra and numerical ones that thermal equilibrium is reach under our experimen-tal conditions. The problem of the chemical equilibrium
Figure 7. Example of the Abel inversion application on an CN peak (≈ 388 nm)
is also investigated in order to confirm the possibility to make spectral acquisitions inside the induction coil of the plasma torch.
Spectral acquisitions being performed between the fourth and the fifth coil of the inductor, we have to be sure that chemical equilibrium is reached at this point.
A first needed step is the calculation of the flow residence time. The distance between two successive inductor coils
is 4 mm wide. The mass flow ˙m is held fixed, and the
densityρ remains equivalent to the density at room
tem-perature, as the flow transits at a constant volume rate inside the quartz tube. Taking into account the mass con-tinuity relationship:
˙
m = ρAv (2)
the flow velocity can be determined, and the flow resi-dence time from the inductor base to the point considered previously, corresponds to 0.12 s. The residence time be-tween the 4th and 5th coil is therefore 30 ms.
4.1. Thermal equilibrium
The SESAM code (Lino da Silva 2004) has been used to reproduce the Abel-inverted CN spectra obtained along the plasma radius. The distribution of the rotational and vibrational levels of the simulated spectra was iterated until a best fit with the experimental spectra was obtained. The rotational and vibrational levels were found to fol-low a Boltzmann distribution and to be in equilibrium
(Tvib=Trot) along the overall radial range where emission
of the plasma was recorded (0-2.5 mm). An example of the fit of the abel-inverted and simulated spectra is
pre-sented in Fig. 8 for the CN Violet system ∆v = 0, −1
transitions.
It is therefore assumed that the plasma can be described
through the use of one overall temperatureT . The radial
3700 3750 3800 3850 3900 0 0.1 0.2 0.3 0.4 0.5 0.6 0.7 0.8 0.9 1 Wavelength (A)
Intensity (A. U.)
Measured Simulated 3460 3480 3500 3520 3540 3560 3580 3600 0 0.1 0.2 0.3 0.4 0.5 0.6 0.7 0.8 0.9 1
Intensity (A. U.)
Wavelength (A) Measured
Simulated
Figure 8. Simulation of the radiative emission of the CN Violet system over the ICP torch axis (r=0) for the ∆v = 0 (top) and ∆v = −1 (bottom) transitions
temperature profile, determined through the fit of the CN Violet system measured spectra using the SESAM code, is presented in Tab. 2
Radial Distance (mm) Temperature (K)
0.0 6050 ± 50
0.5 6050 ± 50
1.0 6050 ± 50
1.5 5900 ± 100
2.0 5900 ± 1000
Table 2. Radial temperature profile of the plasma
It would be interesting to complete these temperature pro-file measurements by some temperature measurements
through the measurement of atomic line peaks. This
allows obtaining the excitation temperature Texc of the
transition electronic levels, and this temperature should
be compared to the vibrationalTviband rotational
tem-peraturesTrotof the CN Violet system to check whether
this additional temperature is equivalent to the former. New measurements in the [720-900] nm range will likely allow observing atomic O radiation, specially from the
triplet at 777 nm, and the plasma thermal equilibrium condition will be checked using this additional method.
4.2. Chemical equilibrium
The temperature T of the plasma is now know, and a
nearly flat temperature profile is obtained in the plasma radiative region, which is the region of interest. This plasma parameter allows us to determine further the librium degree of the plasma, namely, the chemical equi-librium condition.
Initially, we’ve got to determine the thermal history of the plasma gas when it enters inside the induction coil. Knowing the plasma temperature in the measurement re-gion, the approximation that the plasma gas temperature starts from 300 K and reaches 6000 K is made. A simple calculation based on the application of the Fourier’s law leads us to estimate the time required to heat the gas:
∆t = λ · S · ∆T
v · φ (3)
where λ is the thermal conductivity of the CO2 (0.017
W/m K), S the quartz tube section, ∆T the
temper-ature variation, v the plasma gas velocity (0.173 m/s)
andφ the power transferred to the plasma (40% of the
injected power is supposed to be transferred into the plasma, which is underestimated). The order of
magni-tude of ∆t is 0.2 ms which is more than two orders of
magnitude lower than the flow residence time.
Secondly, the determination of the reaction rates is real-ized to show if chemical equilibrium is reached in a time inferior to 30 ms for the considered temperature. This is the matter of the following paragraph.
4.2.1. Reaction rates calculation
It was assumed that the plasma was steadily heated from 300 to 6000 K throughout the induction coils to the
mea-sured section. Therefore, the plasma is heated to an
amount of approximatively 1500 K between two succes-sive induction coils. A one-dimensional calculation of the plasma species concentrations using a reaction rate set was carried in the restrictive hypothesis of an instanta-neous temperature rise of 1500 K. This allowed verifying the time needed for an equilibration of the plasma species
concentration to the new temperatureT0+ 1500 K,
start-ing from equilibrium species concentrations atT0. This
calculated time has to be considered as a majoring value of the actual equilibration time, the temperature rise not being instantaneous, but rather gradual.
A forward reaction rates set (Kf) proposed by Park
(Park 1994) for the Martian atmosphere was used in the
calculation. Backward reaction rates (Kb) were
calcu-lated through the determination of equilibrium constants
Keqand the use of the relationship
Kb=
Kf
Keq
(4)
The equilibrium constants were determined through the calculation of the equilibrium concentrations for the Martian-type gas chemical species at given temperatures
T . A numerical program using the Gibbs energy
minimi-sation technique has been used to achieve these equilib-rium concentrations.
A calculation was carried for an instantaneous increase
of a plasma in equilibrium conditions at T = 3000 K
to a temperature of 4500 K. The time evolution of the chemical species concentration, normalized to their new equilibrium concentrations at 4500 K, is plotted in Fig. 9
0 1 2 3 4 5 10−3 10−2 10−1 100 101 102 103 Time (ms) X/X eq@4500 K
Figure 9. Evolution of the chemical composition of a 97% CO2–3% N2equilibrium plasma at 3000 K
instan-taneously heated at 4500 K
It is verified that a time interval of no more than 4 ms is needed for achieving chemical equilibrium conditions at this new temperature. This is about one order of mag-nitude lower than the flow residence time, and chemical equilibrium conditions can be considered to be reached in the region where measurements are carried (moreover, it is reminded that the calculation of the plasma chemical composition evolution is calculated for a restrictive case).
4.2.2. Plasma composition curves
In the ICP torch, the plasma is formed at atmospheric pressure, so all pertinent chemical reactions occur at this
pressure. Chemical equilibrium is reached when the
Gibbs free energy is at minimum. In order to solve this minimization, two other relations are needed as the elec-trical neutrality and the Dalton law.
The chemical species taken into account for the
calcu-lation are as follows: 11 monatomic species (C, C−, C+
, C++, N, N+, N++, O, O−, O+, O++), the electrons (e−), 16 diatomic species (C2, C−2, C + 2, CN +, CO, CO−, CO+,
N2, N + 2, N−2, NO, NO + , NO−, O 2, O + 2, O−2) and 23 poly-atomic species (C2N, C2N2, C2O, C3, C3O2, C4, C4N2, C5, CNN, CNO, CO2, CO−2, N2O, N2O3, N2O4, N2O5, N2O+, N3, NCN, NO2, NO−2, NO3, O3).
Fig. 10 collects the plasma composition calculated for the Martian-like atmosphere at thermal equilibrium. The main species are CO and O for temperatures inferior to 7500 K. For temperatures inferior to 5000 K, the
elec-trical neutrality is made between NO+ and e− whereas
for temperatures superior to 7000 K, it is made between
C+and e−. Fig. 11 represents the mass enthalpy for our
plasma as a function of temperature.
Figure 10. Plasma composition of Mars atmosphere (97% CO2–3% N2)
Figure 11. Massic enthalpy as a function of temperature for a Martian-like atmosphere (97% CO2–3% N2)
Such calculations, along with the determination of the radial temperature profiles of the plasma and the verifi-cation of the thermodynamic equilibrium of the plasma, allow determining the local species concentrations in the plasma. These overall parameters (temperature and species concentration profiles) suffice in order to allow setting up a simulation of the radiative emission of the plasma along it’s radius. Such calculations can then be
compared against the overall measured and calibrated spectra in order to estimate the accuracy of the spectral datasets used in the calculations.
5. CONCLUSIONS
A new testcase for the validation of radiative codes simu-lating equilibrium radiation from a Martian-type plasma in equilibrium conditions in the near-UV to near-IR range has been defined. First investigations lead to the confir-mation that the plasma is in thermodynamic equilibrium conditions in the measurement region. Such investiga-tions have to be confirmed through excitation
tempera-tureTexcdetermination by atomic line radiation
measure-ments in the [720-900] nm region. Moreover, it would be interesting to calculate the radial electron diffusion rates in order to check if a departure from thermodynamic con-ditions can be favored by this process.
The radial temperature and species concentration profiles can be provided in order to carry a one-dimensional ra-diative transfer calculation and compare the calculated spectrum to the measured one. The methodology for the calculation is the same than the one described in (Laux 1993).
Finally, as theoretical radiation calculations show that most of the radiation of a Martian-like plasma will be emitted in the vacuum-UV and infrared regions (Lino da Silva 2004), it would be interesting to extend the spectral range of such measurements to these additional regions in order to provide more validation data for spec-tral codes.
ACKNOWLEDGMENTS
This research work has been carried thanks to the support of the French Space Agency CNES in the scope of the Mars PREMIER program, and the support of the European Space Agency ESA in the scope of the AURORA program.
REFERENCES
Laux C. O., ”Optical Diagnostics and Radiative Emis-sion of Air Plasmas”, Stanford University, HTGL Re-port No. T-288, 1993.
Lino da Silva M. and Dudeck M., ”A Line-by-Line Spectroscopic Code for the Simulation of Plasma Ra-diation During Planetary Entries: The SESAM Code”,
AIAA paper 2004–2157, 35th AIAA Plasmadynamics and Lasers Conference, Portland, OR, USA, 28 Jun.–1
Jul. 2004.
Lino da Silva M., ”Simulation des Propri´et´es Radiatives du Plasma Entourant un V´ehicule Traversant une Atmo-sph`ere Plan´etaire `a Vitesse Hypersonique – Application `a la Plan`ete Mars”, Ph. D Thesis (in French), Universit´e
d’Orl´eans, Dec. 2004.
Park C., Howe J. T., Jaffe R. L. and Candler G. V., ”Re-view of Chemical-Kinetic Problems of Future NASA Missions, II: Mars Entries”, Journal of Thermophysics