HAL Id: halshs-00562658
https://halshs.archives-ouvertes.fr/halshs-00562658
Preprint submitted on 3 Feb 2011HAL is a multi-disciplinary open access archive for the deposit and dissemination of sci-entific research documents, whether they are pub-lished or not. The documents may come from teaching and research institutions in France or abroad, or from public or private research centers.
L’archive ouverte pluridisciplinaire HAL, est destinée au dépôt et à la diffusion de documents scientifiques de niveau recherche, publiés ou non, émanant des établissements d’enseignement et de recherche français ou étrangers, des laboratoires publics ou privés.
Patrick Guillaumont, Sylviane Guillaumont Jeanneney, Jacky Amprou
To cite this version:
Patrick Guillaumont, Sylviane Guillaumont Jeanneney, Jacky Amprou. Aid Selectivity According to Augmented Criteria. 2011. �halshs-00562658�
Document de travail de la série Etudes et Documents
E 2006.16
AID SELECTIVITY ACCORDING TO AUGMENTED CRITERIA
Jacky AMPROU *
Patrick GUILLAUMONT and Sylviane GUILLAUMONT-JEANNENEY **
Version: May 2006
38 p.
* Agence Française de Développement (AFD) - [email protected]
** Centre d’Etudes et de Recherches sur le Développement International (CERDI) CNRS-Université d’Auvergne - [email protected]
This paper has been presented at the « Development Economics Meeting » organized by the
Association française de sciences économiques (French Economics Association) in May 2005 and at
a meeting of the Expert Group on Development Issues (EGDI), Swedish Ministry of Foreign Affairs in October 2005. In both cases it benefited from useful comments, strongly acknowledged. Some elements of this paper have also been incorporated into a lecture given by P.Guillaumont at the ABCDE Conference in Amsterdam May 2005 (Guillaumont 2006). The authors would also like to acknowledge editorial support by Gill Gladstone and help from Catherine Korachais for the graphs. Two anonymous referees are strongly thanked for very helpful comments. Usual disclaimers apply.
Summary:
A dominant trend in the literature maintains that donor assistance should be targeted to poor countries with sound institutions and policies. In this context, donor selectivity refers to what extent aid is allocated according to the principles of this "canonical" model. This paper shows that it is legitimate for donors to simultaneously use other selectivity criteria corresponding either to expected factors of aid effectiveness or to handicaps to development. It is notably argued that vulnerability to exogenous shocks and low level of human capital should be considered as selectivity criteria. Taking these other criteria into account dramatically changes the assessment of donor selectivity.
Key Words:
1. INTRODUCTION
Not all countries have the same capacity to effectively use external assistance to promote their development. With the decline in international aid during the 1990s, the issue of aid allocation and its effectiveness naturally came into the spotlight. This gave rise to the concept of "aid selectivity", which refers to the quality of aid allocation, the most selective aid being that which maximises the effectiveness with regard to the set objectives. Although the international community has since made the commitment to significantly increase the volume of development aid, the issue of selectivity remains high on the agenda.
We here consider the selectivity of aid as a general concept designing a geographical pattern of aid allocation that maximizes a legitimate objective, primarily poverty reduction. However, according to a current meaning, aid selectivity is also used as a narrower concept, designing an allocation of aid that gives preference to countries with good policies and institutions. This last definition is issued from the assertion of Burnside and Dollar (1997, 2000a) that aid stimulates growth, then leads to poverty reduction, only in countries with sound policies. As we consider that aid purpose is not exclusively economic growth and that aid effectiveness depends on a broader range of country characteristics, the concept of selectivity corresponding to allocating aid on the basis of this range of characteristics is more general than that outlined in such studies as Collier and Dollar (2001, 2002) or Dollar and Levin (2004) , but not inconsistent with it.
Since aid selectivity is here defined as the quality of its geographical allocation, assessing selectivity implies comparing actual allocation to what would be an optimal one. Aid allocation studies are not new, coming back to the 1960s (Little and Clifford, 1965; Bhagwati, 1972; Dudley and Montmarquette, 1976). White and McGillivray (1995) and McGillivray (2004a) propose to divide these studies in three groups. The first one attempts to explain the observed allocation of aid. It is applied either to total aid or to aid from each source. It can be noted that some studies among this first group, in particular the more recent ones, have become to some degree normative as they seek to identify, from among the explanatory factors of allocation, those which represented the recipient countries’ needs, as opposed to the donor countries’ interests: "good allocation" is then deemed to be that which takes into account the recipient countries’ needs (Alesina and Dollar, 2000; Berthélémy and Tichit,
2004; Berthélémy, 2004; Canavire et al., 2005). The second group describes and evaluates the observed allocation against normative criteria and tries to measure “donor performance” with respect to geographical aid allocation. It is the selectivity issue. As soon as 1989 McGillivray proposed and calculated a performance index, which has been revised and extended further. This index was focused on the recipient country level of development. Still in this group and more recently, Dollar and Levin (2004) and Roodman (2004) have sought to establish selectivity indicators by examining to what extent aid is allocated to countries where it is likely to be the most effective. These works refer primarily to Burnside and Dollar paradigm, which makes aid effectiveness to depend upon good policies. Finally a third group of studies seeks to prescribe an inter-recipient allocation of aid by calculating the amount of aid each country should receive based on normative criteria (McGillivray and White, 1994; Collier and Dollar, 2001, 2002; Llavador and Romer, 2001; Cogneau and Naudet, 2004; McGillivray, 2004a). While the second group of studies analyses each donor aid allocation in order to obtain a ranking of donors, the third group mainly considers the total amount of aid to be received by each country1.
The present paper, which belongs to the second group of studies, considers how to assess the quality of geographical aid allocation, then to measure through appropriate indicators the selectivity of donors. Starting from Dollar and Levin and Roodman’s approaches, it proposes an alternative method of assessment. One reason for this choice is that the World Bank and the IMF in their Global Monitoring Report (2004 and 2005) make unquestioning reference to Dollar and Levin’s study, which tends to give it some political credence that could well impact donor behaviour. The main message of these works on selectivity indicators is that selectivity is to be assessed only from the level of income (or poverty) and the quality of policy (governance) of recipient countries. It is consistent with the studies of the third group such as those of Collier and Dollar which determine optimal aid allocation from the same variables. We argue that these analyses of selectivity indicators raise significant methodological problems, which heavily influence the assessment of aid selectivity for both bilateral and multilateral donors. We consider as legitimate for donors to simultaneously use other selectivity criteria, corresponding either to expected factors of aid effectiveness, in order to make aid more efficient, or to handicaps to development, in order to make aid more equitable. Vulnerability to exogeneous shocks and low level of human capital should be
1 McGillivray (2004a) also applied his model to Swedish aid. Unpublished simulations of the Collier-Dollar
considered as selectivity criteria. Taking these other criteria into account dramatically changes the assessment of donor selectivity. This is evidenced through several methods of assessment of aid selectivity.
After stating those principles which, in our opinion, should form the basis of any measurement of the aid selectivity, and thereby clarifying the limits met by the recent analyses on selectivity, we show how donor ranking can be reversed according to the criteria used to assess aid selectivity. We use successively two methods of assessment, one referred to as the elasticity approach, the other as the recipient average profile approach.
This paper is structured as follows. Section 2 examines some principles for the assessment of aid selectivity, while the next three sections investigate three different ways of measuring it: selectivity measured according to a dichotomic criterion (section 3), selectivity measured by elasticities from an aid allocation model (section 4) and selectivity measured by an average profile of recipient countries (section 5). Section 6 concludes.
2. SOME PRINCIPLES FOR THE ASSESSMENT OF AID SELECTIVITY.
The comparative analysis of each donor’s selectivity initiated by McGillivray (1989, 1992), used the recipient countries’ per capita income as the single criterion of selectivity. An additional stage was reached by Dollar and Levin (2004) and Roodman (2004), who diversify the criteria. Dollar and Levin run a descriptive model of aid allocation (for each donor on annual data from 1999 to 2002, and then on a five-year average) including explanatory variables corresponding only to the so-called "good criteria": the level of GDP per capita (negative coefficient expected) and the economic policy, measured by the World Bank indicator Country Policy and Institutional Assessment or CPIA (positive coefficient expected). The control variable is the population size. The per capita income elasticity of aid is intended to represent the sensitivity of each donor to the level of poverty, and the CPIA elasticity of aid its response to the quality of the receiving country’s economic policy. The simple average of these two elasticities (after having reversed the sign of the income elasticity which is normally negative) is taken as the indicator of each donor’s aid selectivity.
The indicator proposed by Roodman (more directly inspired by the work of McGillivray) differs from Dollar and Levin’s in that it is not based on the econometric estimation of
functions of aid allocation. Each donor’s performance indicator corresponds to its aid volume adjusted to take into account the "quality" of aid, particularly its selectivity (the volume of aid is lowered according to the “bad” quality of allocation). The adjustment of aid value with regard to the selectivity does not apply to emergency aid, the granting of which increases the performance of the donors whatever its destination. The aid selectivity depends both on the recipient country’s per capita income and on an indicator of its governance designed by Kaufmann and Kraay.2 The adjustments for project aid and programme support are different, because David Roodman considers, following Radelet (2004), that project aid is more effective than programme support in countries with poor governance. The linear weights applied to the level of the per capita income and to the level of governance are multiplicative, so that the aid granted to a rich, well-governed country is equal to zero, as is the programme aid granted to a poor, badly-governed country. From the adjustment of the actual value of aid according to its quality, two indicators are provided for each donor for 2002: the value of the donor’s adjusted aid in proportion to its GDP, and the rate of aid quality or aid selectivity (i.e. the ratio of the adjusted aid to the aid value before adjustment).
The analysis of the principles, on which these measures of selectivity are based, makes it possible to underline their main limits.
a. Selectivity is only one aspect of aid quality
Evaluating the selectivity of each donor’s development assistance does not mean measuring its overall aid quality, but only one aspect—the quality of geographical allocation, insofar as it affects aid effectiveness. The modalities of the assistance given to each country are obviously also a factor of effectiveness. Thus Roodman (2004), in order to provide an indicator of the aid quality, adjusts its value not only according to the allocation (the selectivity by itself), but also according to its degree of tying and its fragmentation into many purposes.
Moreover, optimal allocation of aid is undoubtedly not independent of its purpose (project, programme, technical assistance, emergency), the conditionality attached, and the type of
2 Kaufmann and Kraay’s indicator is an aggregate including six dimensions: voice and accountability, political
stability, government effectiveness, regulatory quality, rule of law, control of corruption. They are measured by a hundred variables from 24 different sources (Kaufmann, Kraay and Mastruzzi, 2003).
financing (grants or loans). This means that aid effectiveness does not depend only on the behaviour of the recipient countries, but also on the donors’ behaviour. Whilst Roodman takes into account several modalities of assistance to assess donor selectivity (which is somewhat debatable), Dollar and Levin address the issue of selectivity independently of the modalities used, which constitutes a first limit of their measurement of selectivity.
b. Selectivity is related to the objectives of aid
Selectivity is basically a relative concept, as it signifies the optimal allocation of aid with regard to its effectiveness, which is necessarily contingent to its objectives. These objectives can logically differ from one donor to another. The usual objective is economic growth. However, since the adoption of the Millennium Development Goals (MDGs)3, the aid objectives pursued by the international community have become multidimensional, since poverty reduction does not depend exclusively on economic growth. Taking the MDGs into account may lead to consider that, with regard to equity, more aid should be allocated to countries which are more remote from the goals4.
Over and above the Millennium Development Goals, foreign aid can target other objectives in terms of which effectiveness should be assessed. These may include the promotion of democracy or the respect of human rights, neither of which have a clear link with growth and poverty reduction. Aid can also be used to finance global public goods, which generate positive externalities to non-recipient countries (e.g. control of pollution or communicable diseases), or it can finance post-conflict countries and help them to avoid the resumption of conflict and to rebuild their economies. Collier and Hoeffler (2004) also show that aid promotes growth in post-conflict countries more than elsewhere. Finally, some countries, particularly France, assign specific goals to their aid policy, such as supporting former colonies or countries that share their language. These goals can be considered as legitimate insofar as they express specific solidarity or responsibility. They can also be justified with respect to the criterion of aid effectiveness to promote development. Certainly, the ties created by a colonial past or a common language, facilitate understanding between partners when aid
3 Adopted in 2000 by the United Nations General Assembly, the eight MDGs are the following: eradicate
extreme poverty and hungry, achieve universal primary education,, promote gender equality and empower women, reduce child mortality, improve maternal health, combat HIV/AIDS, malaria and other diseases, ensure environmental sustainability, develop global partnership for development.
involves a dialogue on the actions implemented and a transfer of knowledge, which is often the case.
It is difficult for analyses of aid selectivity to take into account the diversity of the donors’ goals. They thus focus on poverty reduction resulting uniquely from the effect of aid on economic growth. This constitutes a second limitation of such analyses.
c. Selectivity depends on various recipient country characteristics which condition aid effectiveness.
Recent studies on selectivity ranking( Dollar and Levin, 2004; Roodman, 2004) are based essentially on Burnside and Dollar’s thesis (1997, 2000a and b)on the relationship between aid and economic growth (used as a basis for the 1998 World Bank report, Assessing Aid), and fail to take into account the academic community’s extensive critical studies that followed Burnside and Dollar’s work5. Leaving aside the criticisms of the robustness of the econometric results and those concerning the choice of economic growth as the sole objective of aid (mentioned above), let us briefly examine the basic questions of the model’s relevance and main assumptions.
The assumption — presented as self-evident, yet not developed in detail — according to which aid effectiveness depends on economic policy and/or institutions, has been discussed less in its principle than because of the definition given of “good policy or institutions”. In the first version of their work (1997). Burnside and Dollar created a policy index based on several variables used in the empirical growth literature (inflation rate, budget balance, and the openness index of Sachs and Warner). In a follow-up paper (2000b) they added a rule of law measure to the index. In a new version of their work (2004a), they use the indicator of governance of Kaufmann and Kraay more related to the quality of institutions than to economic policy. Remind that Roodman uses this last indicator, while Dollar and Levin) (as done by Collier and Dollar, 2001, 2002) use the Country Policy and Institutional Assessment or CPIA indicator) designed and used by the World Bank to determine the amount of its commitments per country. The CPIA itself includes twenty indicators and is at once related to
4 In a same perspective Thiele, Nunnenkamp and Dreher (2006) examine the allocation of global and sectoral aid
with regard to each of the Millenium Development Goals and their specific targets.
economic policy, institutions and governance. Nonetheless, this indicator poses two problems: (i) it is based on an assessment of country policies and institutions by World Bank staff only and (ii) it is not available outside the Bank and cannot be used by either academics or other donors for their own aid allocation purposes. Finally, its use supposes that, in all the countries, whatever their specificities and preferences, it is the same kind of economic policy (defined as good) which promotes growth and increases aid effectiveness. This assumption has been strongly criticised notably by Kanbur (2004), McGillivray (2004b) and Michaïlof (2004). More important, however, is to acknowledge that aid effectiveness in terms of growth does not depend only (and perhaps not even mainly) on the recipient’s economic policy. Other factors, which have been econometrically tested, intervene. The importance of economic vulnerability, for instance, has been identified (Guillaumont and Chauvet, 2001), i.e. shocks to which many developing countries are particularly exposed, either through their foreign trade, notably because of the variations in the international prices of primary commodities, or due to climatic incidents or natural disasters. These factors both have a negative impact on growth and increase aid effectiveness. Indeed, in the countries facing shocks, aid can avoid shortfalls in imports and the slowdown of growth, as well as the cumulative decline that often ensues. The higher the amount of aid, the more it relatively dampens the macroeconomic impact of shocks; that is to say, aid is marginally more effective in more vulnerable countries or, in other words, aid decreases the negative impact of the vulnerability.
The analysis of the ways in which aid effectiveness is influenced by the recipient country’s vulnerability and by factors other than economic policy has been developed in several directions. Studies have highlighted the specific effect of aid provided at a time of negative terms-of-trade shocks (Collier and Dehn, 2001) or in post-conflict situations (Collier and Hoeffler, 2004). Following on from their earlier studies, Chauvet and Guillaumont (2004) highlight how several factors simultaneously influence aid effectiveness. Their findings indicate that economic vulnerability (measured, this time, simply through the instability of exports and the terms-of-trade trend) increases aid effectiveness. Political instability, on the other hand, decreases effectiveness, unless such instability occurs in neighbouring countries, in which case, effectiveness is increased. The quality of infrastructure and education also brings about an increase. As for the level of human capital, however, other authors have recently supported the view that aid effectiveness is marginally higher in countries where this level is lower (Gomanee, Girma and Morrissey, 2004).
Regarding economic policy, the critique of the current view does not only concern the robustness of the econometric results or the indicator selected, it also concerns the assumption that donors cannot influence recipients’ economic policies. Case studies, published in the book Aid and Reform in Africa (Devarajan, Dollar and Holmgren, 2001) and carried out on the initiative of the World Bank, reveal that, in many instances, aid had indeed influenced the countries’ economic policy. If such is the case, aid has a role to play in those countries where there is a particular need to improve economic policy. Thus, in the above-mentioned study by Chauvet and Guillaumont, aid effectiveness appears much more effective if the present policy is “good” and the former policy was bad and thus perfectible.
The fact that the analyses of selectivity retain only good economic policy or good governance as a factor of aid effectiveness is thus the third limitation of these studies.6
d. Selectivity is meaningful only for discretionary aid
A difficult question is to determine which concept of aid is the most appropriate for assessing selectivity. The authors who have assessed aid selectivity have preferred to use the Official Development Assistance disbursements rather than the commitments, whereas a priori the latter represent the donors’ intentions better than the disbursements (Dudley and Montmarquette, 1976), and more accurately reflect actual policy. The reason advanced for this is that, if commitments are durably higher than disbursements, this expresses a "tendency of certain donors to promise more than they can realistically deliver, or a failure to learn from history that certain recipients cannot absorb aid as fast as donors hope " (Roodman 2004, p.5). Another point of discussion is whether the gross or net flows of aid should be considered. Whereas Dollar and Levin refer to the gross disbursements, Roodman chooses the net transfers, i.e. he deducts the whole debt service (principal and interests) from gross aid, because net transfers are a better measurement of the cost for the donors and the benefit for the receivers. Roodman’s choice is related to his objective: to establish an indicator of donor performance taking account of both aid volume and aid quality. The question of whether to
6 This point is emphasized in McGillivray (2003a, 2003b), who proposes different criteria for aid selectivity:
use gross or net aid is related to the treatment of debt cancellations. Should one exclude from aid flows the share attributable to the debt cancellations, as these relate to loans granted beforehand and generally result from decisions taken on the international scene? Given the importance of debt cancellations in development aid, their inclusion involves a risk of strong bias in assessing the aid allocation of each donor. However, this bias is less significant if one considers the gross rather than the net flow of aid, as in Dollar and Levin’s paper, since, unlike net flows, gross flows are affected only by the cancellation of commercial debts.7 A final question is whether development aid only should be considered, or if emergency aid should also be included (as Roodman does, unlike Dollar and Levin), since the latter should not be dissociated from development goals. However, the reasons for offering emergency aid are different from those for development aid and its allocation depends on specific, even random, events such as natural disasters or wars.8
In short, the current analyses of aid selectivity come up against three main limitations: the focus on a single objective for aid, the assumption that aid effectiveness with regard to economic growth depends exclusively or mainly on economic policy and institutions, and the measurement of aid which poorly reflects the discretionary choices of the donors.
In what follows, we will try to push back these limitations of the current studies on selectivity. We will show that the assessment of the various donors’ aid selectivity, such as it was put forward by the Global Monitoring Report (2004), is largely modified when we take into account the different factors affecting aid effectiveness, and to a lesser extent when we consider that donors can legitimately have other goals than to maximize economic growth or even poverty reduction. In order to better focus on "discretionary" aid, we use, as do Dollar and Levin, gross disbursements rather than net transfers, considering that the former better represent the choices of aid allocation. For the same reason, but unlike these authors, we deduct the disbursements corresponding to debt cancellation, and, like them, we deduct
7 According to DAC guidelines, a cancellation of concessional debt (corresponding to an initial loan which had
been included in ODA when it was disbursed) is not included in gross ODA, except for the present value of the interest payment reduction that this cancellation produces. However, the cancellation of a commercial debt is added to gross ODA, since the cancellation takes the form of an automatic repayment of its reimbursements to the debtor country.
8In 2003 for instance debt cancellation plus emergency aid represented 40% of ODA gross disbursements to
emergency assistance from ODA (the Development Aid Committee’s aggregate).9
Three categories of selectivity measurement are successively presented for the year 2003, the last year for which data were available. The first, directly echoing the Global Monitoring Report (2004), uses only one criterion. The second, following Dollar and Levin, uses aid elasticities to the "virtuous" determinants of aid allocation. The third type of measurement, starting from Roodman’s analysis, calculates an average profile of the recipients by donor. This third measurement makes it possible to introduce certain country-specific aid criteria. 3. SELECTIVITY WITH REGARD TO ONLY ONE CRITERION: A DICHOTOMIC APPROACH.
Let us start quite simply by taking the graph in which the Global Monitoring Report 2004 (Chapter "Providing more and better aid"), summarises its analysis of the level and quality of the aid of the various bilateral donors. We then compare this with an alternate graph that is based on the distinction between the Least Developed Countries (LDCs) and the other developing countries (Guillaumont, 2004).
a. Selectivity based exclusively on the CPIA
As on some roman churches’ tympana depicting the Last Judgement, the Global Monitoring Report 2004 divides aid-recipient countries into two equally-sized groups, on the sole basis of the CPIA: those with “good” policies and those with “bad” policies (or institutions). The graph locates each donor according to the volume of aid (per capita of the donor country) granted to both categories of recipients, represented along the axes (cf. Graph 1). The donors located below the bisectrix are indicated as having a low aid selectivity and conversely. It is the angle with respect to the horizontal axis that indicates the degree of selectivity, and not the distance from the diagonal, as an over-hasty reading of the graph might suggest. The further the donors are located from the origin, due to the significant volume of aid allocated, the more they visually deviate from the diagonal (e.g. France, who thus appears in a rather unenviable position…).
The position of the donors above or below the diagonal clearly depends on the cursor chosen to classify the recipient countries as either "good" or "bad". Here, the cursor is the median of the CPIA, which does not allow for a high degree of differentiation since a good number of countries are grouped around this median.10 Although the Global Monitoring Report 2004
acknowledges that it is normal to take into account shocks and post-conflict situations in aid allocation, only the quality of the economic policy measured by the CPIA is visualised in the Graph 1. Far from emphasising the limits and relativity of Dollar and Levin’s method, the authors of the Global Monitoring Report present the conclusions of the analysis (which they use as their starting point) in a simplified form with no apparent reserves.11
b. Selectivity based on the category of the Least Developed Countries (LDCs)
In order to illustrate the particular vision of aid selectivity given by the above graph, we replaced the CPIA median by the criterion of membership or not of the category of the Least Developed Countries (LDCs), officially defined by the United Nations to identify among the low income countries those suffering the most from structural handicaps to growth (cf. Graph 2). The choice of this criterion can be easily justified. The developed countries are committed to a target of 0.15% of their GNP as overseas development assistance (ODA) to this category of countries. The membership of developing countries to this category is governed by three criteria (United Nations, 2000): they have (i) a low level of income per capita, (ii) a low level of human capital and (iii) a high level of economic vulnerability. The level of human capital (Human Assets Index: HAI) is measured by two health indicators (child survival at age five and calorie intake per capita expressed as a percentage of the needs, recently replaced by the percentage of population undernourished) and two education indicators (adult literacy rate and secondary enrolment ratio). Economic vulnerability (Economic Vulnerability Index: EVI) is measured by several indicators, which have been recently refined: four indicators representing exposure to shocks (small population size, expressed in logarithms, remoteness from main world markets, the share of agriculture, forestry and fisheries in GDP, and concentration of goods exports), and three indicators representing the size of the shocks (instability of goods and services exports, instability of agricultural production, percentage of the population displaced by natural disasters).
10 Berg (2003, p.22) already pointed out this limit for Collier and Dollar’s study.
11 The use of Dollar and Levin’s work by the Global Monitoring Report 2005 is less caricatural, since the
recipient countries are classified according to their CPIA in three (instead of two) groups, so that Graph 1 is replaced by a diagram. However the tonality remains the same.
Each of these three criteria stands as a reason to support LDC’s through aid allocation. There are two reasons for allocating aid according to a country’s economic vulnerability. First, as seen above, structural vulnerability reinforces aid effectiveness and, second, it constitutes a structural handicap to growth that should be offset. The first reason is a principle of effectiveness and the second a principle of equity. The low level of human capital is also a handicap to growth, but probably not, at least in the immediate future, a factor of aid effectiveness. On the other hand, in the long run, the actions to promote human capital most probably help to increase the absorptive capacity of aid and thus its effectiveness. The criterion of human capital is perfectly consistent with the Millennium Development Goals, as is the income per capita criterion, which reflects the extent of poverty.
c. Comparison of the two criteria
If the position of the most virtuous donors (Denmark, Luxembourg, the Netherlands, Norway, Sweden) is barely modified, it is not the same for the countries closer to the diagonal: thus Japan passes below the diagonal, whereas France moves above it. The change is most evident for the case of France, reflecting the fact that, compared to other donors, France gives more weight in aid allocation to growth handicaps than to economic policy or governance, at least as it is expressed in the CPIA.
4. SELECTIVITY MEASURED BY AID ELASTICITIES FROM A MODEL OF GEOGRAPHICAL ALLOCATION
Here we follow the method used by Dollar and Levin, and we analyse the consequences of using different criteria to measure multilateral and bilateral donors’ selectivity. It is unfortunately impossible to reproduce Dollar and Levin’s results, since the CPIA remains confidential, although it is used in an official World Bank and IMF report to assess donors’ behaviour. Hence, we take Kaufmann and Kraay’s governance index (also used by Roodman) instead of the CPIA.
a. Estimating four alternative functions of aid allocation
For each donor, we considered aid per capita allocated in 200312 to developing countries as a
function of their per capita GDP and alternatively of three other variables, namely Kaufmann and Kraay’s indicator of governance (KKI), the revised economic vulnerability index (EVI) and the human assets index (HAI). The last two indices are calculated by the United Nations’ Committee for Development Policy (CDP) in order to identify the LDCs13. All the variables are expressed in logarithms so as to obtain elasticities14. The use of the indicator of governance (KKI) makes it possible to establish an index of selectivity in the Dollar-Levin fashion, which we named "focused on governance". The use of the second indicator (EVI) is consistent with the work of Guillaumont and Chauvet and leads to a selectivity index "focused on vulnerability". The use of the third indicator (HAI) refers more directly to the Millennium Development Goals. Each index of selectivity is the simple average of aid elasticities (expressed according to the expected sign)15 with regard to the per capita GDP and to the second indicator selected, as done by Dollar and Levin for the two elasticities they estimated (with regard to the per capita GDP and the CPIA). In order to obtain a composite indicator of selectivity, we then simultaneously estimated the elasticities with regard to the four variables (GDP per capita, EVI, HAI, KKI). This method raises some technical difficulties (Guillaumont, 2004b and Roodman, 2004), that we acknowledge.16 Nonetheless, we have kept to Dollar and Levin’s method, since our objective is to compare our results with theirs.
12 Last year available in terms of statistics.
13 We here use the EVI as revised by the CDP in March 2005 and calculated from data as available for the last
review of the list of LDCs in 2003.
14 The dependent variable is per capita aid (for each recipient country) instead of global aid. We do not introduce
the population size into the explanatory variables, since it is one of the components of the EVI index (a small population is considered as a factor of greater vulnerability to external shocks). This approach ends up imposing a unitary elasticity of aid to population.
15 For good selectivity, we expect a negative coefficient for the per capita income and the human assets index
(HAI) and a positive coefficient for the governance indicator and the vulnerability indicator (EVI). To compute the average of elasticities, the sign of the first two elasticities has been reversed.
16 (i) When a country receives no aid from a donor, it is not possible to keep a zero, since log of zero tends to
infinite. In this case, Dollar and Levin replace the zero by a low value of aid ($10.000). This arbitrary choice has an influence on the value of elasticities. A better solution would have been to estimate a Tobit model as done by Berthelemy and Tichit (2004) and Canavire et al. (2005). (ii) Another difficulty comes from the elasticities that are often not significantly different from zero. Even though the estimated value of elasticities is not a priori more open to critique than a zero value, this casts some doubts on the validity of the method or at least on the signification of the differences in the ranking. (iii) White and McGillivray (1995) contested the use of the coefficients of a regression of aid on economic characteristics, as an indicator of aid allocation performance, as far as these coefficients are influenced by the total amount of aid. However this criticism here does not apply since all the variables are expressed in logarithm so as to have the coefficients measuring elasticities, with a constant included besides the explanatory variables and capturing the size effect.
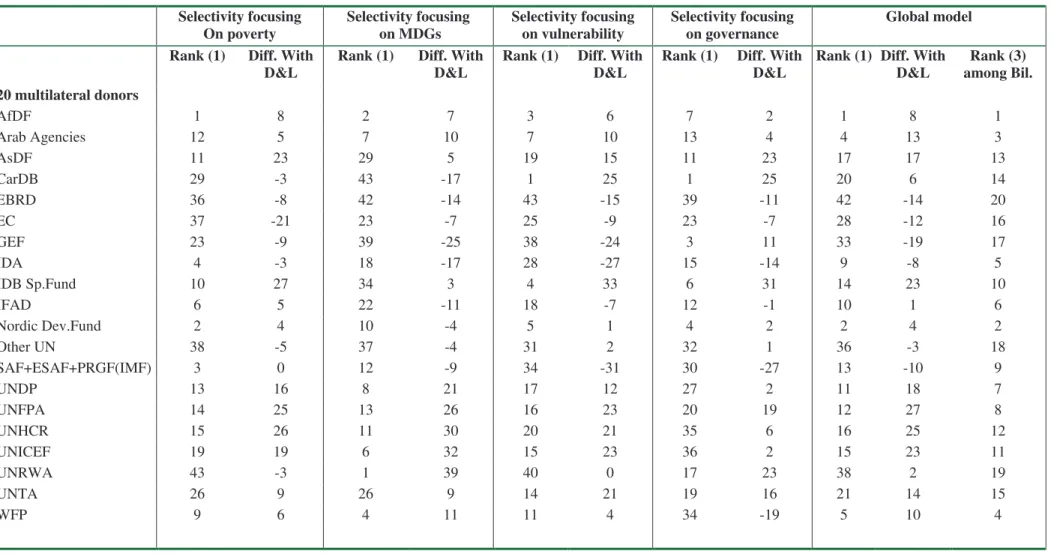
b. A radically changed ranking of donors
It appears clearly that donor ranking changes dramatically from one indicator to the other in Table 1, which gives the results for each donor and in Table 2, which presents a synthetic view of the differences in ranking. First of all, let us compare Dollar and Levin’s ranking with those which take into account the two growth handicaps, resulting from vulnerability to external shocks or from weak human capital. The various United Nations agencies, as do bilateral donors such as Portugal, France and, to a lesser degree, Ireland, Spain and Italy— which are among the least selective donors in the canonical meaning—go up appreciably in the ranking based on the level of the human capital (HAI). The same change appears again for Portugal and United Nations agencies, as well as for Greece and the Development Banks, with the ranking based on vulnerability.
If we now consider the ranking established with the composite or global selectivity index, the inversion of ranking is particularly striking for the United Nations agencies, which gain 27 to 5 ranks and for Portugal which ranked 31st out of 42 donors by Dollar and Levin and becomes 6th and first of the bilateral donors, whereas France gains only two ranks (30th instead of 32nd out of 42). On the contrary, the United Kingdom goes down sharply (minus 35 ranks), as do Austria (minus 30 ranks) and Sweden (minus 28 ranks), due to little weight these countries give to the recipients’ level of human capital and vulnerability in their aid allocation. This is also the case, but to a lesser extent, for Norway, Finland, Denmark and the United States. On the other hand, IDA as well as the IMF maintain a very good ranking. Moreover, we note that the two criteria intended to represent the recipient countries’ "good behaviour" (the CPIA and the Kaufmann and Kraay’s indicator of governance) give differing results for several countries. This is particularly the case of United Nations agencies and Development Banks, as well as Australia, Japan and the United States, whose ranking significantly improves when one refers to the second indicator. The losers are mainly Austria, Belgium, Sweden, Portugal and the United Kingdom. This comparison reinforces the feeling that the assessments related to policy and governance are relatively subjective and consequently sensitive.
5. SELECTIVITY MEASURED FROM AN AVERAGE PROFILE OF RECIPIENT COUNTRIES
The advantage of the second method now used is to not rely on an econometric estimation (prone to criticism) of the determinants of each donor’s aid allocation. This method approaches the one used by McGillivray and Roodman. However, unlike them, we do not calculate a value of aid adjusted by the quality of the allocation. We are directly interested in aid selectivity. We calculate, therefore, an "average profile" of the aid recipients of each donor, weighted by the proportion of its aid allocated to each country. This average profile can be calculated from as many receiver’s characteristics as one wishes. This method offers one significant advantage compared to the selectivity approach: each selectivity criterion indicator included in the average profile is independent from the other criteria, while the elasticity approach measures partial elasticities which depend on the level of the other variables. It avoids to take into account one indicator only to the extent it is not correlated with the others.
a. An average profile of aid recipients of each donor according to four criteria
We here keep the four indicators mentioned in the previous section and used to measure selectivity by elasticities, namely the level of income (GDP per capita), the quality of the governance (Kaufmann and Kraay’s index), the vulnerability (EVI) and the level of human capital (HAI). For each donor i, we calculate an average per capita GDP* of its aid receivers, weighted by the share of its aid to each recipient country j in its total assistance, as well as an average HAI*, an average EVI* and an average KKI*, weighted in the same manner
wij = Aij / Aj
GDP*i = wij
.
GDPjHAI*i = wij
.
HAIjEVI*i = wij
.
EVIjTo give an equal weight to each component, GDP, EVI, HAI and KKI are calibrated on a 0 to 100 scale. Furthermore, we reversed GDP and HAI, in order to have the four components evolve in the same direction. The average profile of each donor’s recipients is then given by the sum of these four components. This gives an indicator of aid selectivity and makes it possible to rank the donors.
Ii = (GDP*i, HAI*i , EVI*i , KKI*i )
so that a higher index I for donor i means that, compared to the other donors, donor i allocates its aid to countries either poorer, or more vulnerable, or with a better governance, or with a lower human capital, or a combination of these four characteristics. It is thus possible to rank the donors according to this index of aid selectivity (Table 3).
The ranking thus obtained is relatively close to that obtained from elasticities (Table 1). However, the ranking improves significantly for some countries, such as the United Kingdom, Sweden, Spain and Germany, and obviously worsens for others, like Greece, New Zealand and Switzerland, as well as IDA and IMF, who nevertheless preserve a good ranking (respectively 9th and 13th). These differences in results reinforce the doubts previously expressed about the elasticity method.17
From the same Table 3, one can clearly see the preferred criteria of each donor. For example, compared to the whole set of donors, the World Bank (through IDA) and the IMF18 support—
by virtue of their mandate—the low-income countries. Moreover, it is worth noting that the World Bank considers “good governance” to be an important criterion, which is less the case of the IMF, even less the case of the United Nations. Among bilateral donors, Japan, Denmark, Spain and Luxembourg are the most attached to governance. France focuses more on the level of poverty—measured by the per capita GDP—and on the level of human capital (HAI) than on governance or vulnerability, while the European Commission, and even more the United States, do not seem to be very sensitive to any of the four criteria.
17 Cf. note 14 above.
18 Here are only considered the Structural Adjustment Facility and the Enhanced Structural Adjustment Facility,
b. Taking specific donor preferences into account
We previously underlined that assessing selectivity should take into account the fact that bilateral donors may logically have preferences for certain countries, mainly due to historical or cultural ties or because they feel that they have a special responsibility with regard to post-conflict countries. We thus consider the possibility of a preference given — in a proportion fixed arbitrarily at 20% — by donors to countries that share their language. This can be justified by the donors’ strategy of defending a minority language by promoting the economic development of the countries speaking this language considered as an international public good. This leads us to identify from among the aid recipients those using the Spanish, Portuguese or French language. However, we do not consider that the United Kingdom, Ireland or the United States could share the same concern of defending the use of English. We alternatively consider that the former colonial powers (Belgium, France, the Netherlands, Portugal and the United Kingdom) may understandably give relatively more aid to their former colonies (in the same proportion of 20%). Finally and again independently, we adjusted the profile of the aid recipients to take account (in the same proportion of 20%) of a possible post-conflict situation.19
The construction of the indicator adjusted for the three kinds of preference consisted in multiplying by 1.2 each of the four elements (wij * GDPi ; wij * HAIi ; wij * EVIi ; wij * KKIi)
when the donor i allocates aid to a receiver j which has the chosen characteristic. The adjustment was done independently for each kind of preference20. The preference given to the
countries in a post conflict situation was taken into account without any distinction between the donors. This adjustment improves the ranking of the countries likely to have specific preferences all the more since they are selective with regard to other criteria in allocating their aid to countries sharing the same language or to former colonies. In other words it is not an additional criterion, but an adjustment or multiplicative factor acting through the other criteria.
19 Unlike cultural preferences, which concern only bilateral donors, preference for post-conflict countries may
also concern multilateral donors. Cf. Annex 2 for a definition of post-conflict countries.
20 For the linguistic preference the selectivity index has been adjusted to take into account the three following
elements:
1. France, Canada, Belgium, Luxembourg and Switzerland disburse ODA towards countries with
more than 33% of children enrolled in French-speaking schools. 2. Spain disburses aid towards countries with Spanish as official language.
Not surprisingly, the new ranking shows the former colonial powers—particularly Portugal, the United Kingdom and France—in a better position. A similar increase in the ranking occurs when linguistic preference is taken into account. Thus, Portugal, which gives a priority to Portuguese-speaking countries, France, Belgium and Canada (but not Switzerland), which give some preference to French-speaking countries, and Spain have a better ranking (Table 4).21 The adjustment carried out in Table 5 for the countries in a post-conflict situation also modifies the ranking, which mainly improves the position of Belgium, Finland and Sweden, and lowers the position of IDA and IMF. But as indicated in Table 2 the impact of any of these three adjustments on ranking is rather limited compared to other changes in the main criteria of selectivity22.
The paper did not aim at analysing the quantitative implications for the receivers of the adoption of new allocation criteria compared to the canonical ones. Such an exercise is made difficult due to the lack of data on the CPIA. Moreover, selectivity criteria cannot be used to determine a new allocation pattern without a general model of allocation. However, a potential change in effective allocation can be noted as an illustration, referring to Dollar and Levin’s work on “forgotten States” (2005), which uses the CPIA. These authors defined a category of states named “Difficult Partnership Countries (DPC)”, which are low-income countries and have weak institutions (low CPIA),23 and find that they receive on average less aid than the other developing countries (even with regard to their CPIA): on average US$ 40 per capita versus 94. If we look at the HAI and EVI average levels of these 29 DPCs, it turns out that they have a lower human capital (HAI equals 40 versus 70) and a higher vulnerability
3. Portugal disburses aid towards countries with Portuguese as official language.
21 The results for “average profile of recipient countries adjusted for the preference given to former colonies”
are not presented here as they are rather similar to those relative to language sharing. They are available on request.
22 We have also tested the sensitivity of the results by using an adjustment coefficient of 1.1 instead of 1.2.
Following the adjustment for former colonies or linguistic preferences, Portugal stays at the first rank (versus 7th
rank without adjustment) among bilateral donors, Belgium is now to the 5th and 6th ranks instead of 4th with 1.2
adjustment (versus 5th without adjustment). France is at the 10th and 11th ranks instead of 7th (versus 13th without
adjustment), United Kingdom, for the former colonies adjustment, is now at the 4th rank instead of the 3rd
(versus 8th rank without adjustment). These results show that even a small adjustment coefficient may change
significantly the ranking of the donors.
23 The authors use two bottom quintiles of World Bank’s Country Policy and Institutional Assessment (CPIA) to
(EVI equals 46 versus 38)24. The adoption of the new criteria (HAI and EVI), as proposed in
our paper, would meet the authors concern about a low allocation of aid to these countries. 6. CONCLUSION
Three main conclusions can be drawn from this paper. First the definition of an optimal allocation of development aid, whatever the donors, raises some problems which have not been appropriately addressed in the literature. Still needed for the international donor community is to agree on satisfactory criteria for aid allocation. Several different criteria have to be used given the complex relationships between development aid, growth and poverty reduction, as underlined by the academic literature. It seems, however, that an agreement should be easily reached on the four criteria that we have used: two poverty-related criteria (per capita income and the level of human capital) and two criteria corresponding to the likely factors of aid effectiveness (governance and economic vulnerability). Agreement on the criteria not yet adopted by the canonical vision of aid selectivity (human capital and vulnerability) could be facilitated by the existence of the two indicators used by the United Nations for the identification of the Least Developed Countries (HAI and EVI). As also shown, the use of these criteria may change donors’ effective allocation of aid. It is all the more important to acknowledge the legitimacy of using a diversity of criteria that in the Global Monitoring Report, the World Bank and the IMF used recipient countries’ CPIA as the main criterion to assess donors’ selectivity, thus intending to influence the donors’ behaviour. This influence depends on the importance that donors attach to this assessment from a political point of view.
Second, based on this analysis, it seems debatable to apply uniform criteria in order to assess the selectivity of the various bilateral sources of aid, since donors legitimately have particular preferences due to specific solidarities, and a comparative advantage in assistance to certain countries. Moreover, a donor’s selectivity can logically aim at compensating for different selectivity preferences of other donors. If one thus wants to compare the aid selectivity of developed countries, it may be advisable to seek a consensus on how to take into account particular, but legitimate preferences of some bilateral donors, at the same time as one applies common criteria. We have outlined a way of doing this in the last section of this paper.
Thirdly the debate about criteria has an implication on the optimal allocation of total aid. The scientific issue still to be addressed is the design of a model that will make it possible to determine an optimal aid allocation using multiple criteria. Collier and Dollar (2001, 2002) have proposed a model of optimal allocation, with the objective to maximize the reduction of the number of poor by 2015. Aid is expected to contribute to this goal through its effect on growth, according to an income elasticity of poverty assumed to be the same across countries. Collier and Dollar assume that the positive effect of aid on growth depends on the quality of the economic policy and institutions (measured by the CPIA). They then design a linear program which enables an optimal aid allocation between the various countries to be calculated on the basis of the current level of total aid. This model is relatively simple insofar as it is based on a clear objective (maximum reduction of the number of poor) and, also, allocation is based on only two criteria (the initial level of monetary poverty and the quality of economic policy expected to impact aid growth effectiveness ). The principle of simulation is then to equalise across recipient countries the marginal contribution of aid to reducing the number of poor. This model, however, does not allow the structural handicaps of the recipient countries to be taken into account simultaneously. Vulnerability could be introduced into this model as it increases aid effectiveness by promoting growth (as good economic policy), but it is not the same for the weakness of human capital. In order that aid be allocated according to both the structural handicaps to be offset and the characteristics of recipient countries which condition aid effectiveness, it would be advisable to design a model based on an objective and an aid-growth relationship other than those of Collier and Dollar. This is what we propose to do in a future work.25 It would then be possible to compare the impact on aid allocation of the new criteria proposed to that of the canonical model.
Once a desirable allocation of total development aid has been determined, each international institution and each bilateral donor would have the responsibility of indicating the share of aid which each recipient country that it wishes to finance should ideally receive. This should be done with each donor country clearly stating its own criteria of selectivity. The share attributed to each donor should be negotiated with all the other donors, in order to explicitly take into account the donors’ interdependence in global aid allocation. One could consider
25 Two other studies have dealt with global aid selectivity: Cogneau and Naudet (2004) and Llavador and
Roemer (2001) have attempted to apply the principle of social equity by allocating aid to countries whose structural growth handicaps most underminethe utility provided by an effort or a similar quality of economic policy. These two studies however adopt Collier and Dollar’s main idea of aid effectiveness depending on economic policy.
that the international institutions have the responsibility to give aid in priority to those countries for which the normal quota of total assistance had not been spontaneously covered by the bilateral donors. This procedure would have the advantage of allowing a better foresee ability of aid flows for each recipient and less donor fragmentation in each of the countries.
REFERENCES
Alesina, A. and D. Dollar (2000), “Who Gives Foreign Aid to Whom and Why ?”, Journal of Economic Growth, 5, 1, 33-63.
Amprou, J. and L. Chauvet (2004), Efficacité et Allocation de l’Aide : Revue des Débats, Notes et Documents No.6 (Paris: Agence Française de Développement).
Berg, E. (2003), “Augmenter l’efficacité de l’aide: une critique de quelques points de vue actuels”, Revue d’économie du développement, 4, Décembre, 11-42.
Berthélémy, J.C. (2004), Bilateral Donors’ Interests vs. Recipients’ Development Motives in Aid Allocation: Do All Donors Behave the Same?, Paper presented to the HWWA conference on Political Economy of Aid (Hambourg, 9-11 December).
Berthélémy, J.C. and A. Tichit (2004), “Bilateral Donors’ Aid Allocation Decisions. A Three Dimensional Panel Analysis”, International Review of Economics and Finance, 13, 253-274. Bhagwati, J. (1972), “Amount and Aid Sharing”, in R. Frank, J. Bhagwati, R. Shaw and H. Malmgren (eds.), Assisting Development Countries (New York: Praeger Publishers for Overseas Development Council).
Burnside, C. and D. Dollar (1997), Aid, Policies and Growth, Policy Research Working Paper No.1777 (Washington DC: The World Bank).
Burnside, C. and D. Dollar (2000a), “Aid, Policy and Growth”, American Economic Review, 90, 4, 847-868.
Burnside C and D.Dollar (2000b), “Aid, Growth, the Incentive Regime, and Poverty Reduction” in C. L. Gilbert and D. Viner (eds.), TheWorld Bank: Structure and Policies, Cambridge: Cambridge University Press.Burnside, C. and D. Dollar (2004a), Aid, Policies and Growth: Revisiting the Evidence, Policy Research Working Paper No.2834 (Washington DC: The World Bank).
Burnside C. and D. Dollar (2004a) « Aid, Policies and Growth : Revisiting the Evidence », Policy Research Working Paper, WPS 3251, Washington D.C.The World Bank.
Burnside, C. and D. Dollar (2004b), “Aid, Policies and Growth: a Reply”, American Economic Review, 90, 4, 847-68.
Canavire, G., P. Nunnenkamp, R. Thiele and L. Triveno (2005), Assessing the Allocation of Aid: Developmental Concerns and the Self-Interest of Donors, Working Paper No.1253 (Kiel Institute for World Economics).
Chauvet, L. and P. Guillaumont (2004), “Aid and Growth Revisited: Policy, Economic Vulnerability and Political Instability” in B. Tungodden, N. Stern and I. Kolstad (eds.), Towards Pro-Poor Policies. Aid, Institutions and Globalisation, ABCDE 2003 Annual World Bank Conference on Development Economics Europe (New York: Oxford University Press). Cogneau, D. and J.D Naudet (2004) Qui mérite l’aide ? Egalité des chances versus sélectivité ? Notes et Documents No.7 (Paris: Agence Française de Développement).
Collier, P. and J. Dehn (2001), Aid, Shocks and Growth, Policy Research Working Paper No.2688 (Washington DC: The World Bank).
Collier, P. and D. Dollar (2001), “Can the World Cut Poverty in Half ? How Policy Reform and Effective Aid Can Meet International Development Goals”, World Development, 29, 11, 1787-1802.
Collier, P. and D. Dollar (2002), “Aid, Allocation and Poverty Reduction”, European Economic Review, 46, 8, 1475-1500.
Collier, P. and A. Hoeffler (2002), “Greed and Grievance in Civil War”, Working Paper No.2002-01 (Centre for the Study of African Economies).
Collier, P. and A. Hoeffler (2004), “Aid, Policy and Growth in Post-Conflicts Countries”, The European Economic Review, 48, 1125-1145.
Comité d’Aide au Développement (2004), Mémorandum de la France sur ses Politiques et Programmes en Matière de Coopération pour le Développement (Paris: OECD).
Devarajan, S., D. Dollar and T. Holmgren eds. (2001), Aid and Reform in Africa: Lessons from Ten Case Studies (Washington DC: The World Bank).
Dollar, D. and V. Levin (2004), The Increasing Selectivity of Foreign Aid, 1984-2002, Policy Research Working Paper No.3299 (Washington DC: The World Bank).
Dollar, D. and V. Levin (2005), The Forgotten States: Aid Volumes and Volatility in Difficult Partnership Countries (1992-2002), Summary Paper prepared for DAC Learning and Advisory Process on Difficult Partnerships (Washington DC: The World Bank).
Dudley, L. and C. Montmarquette (1976), “A Model of the Supply of Bilateral Foreign Aid”, American Economic Review, 66, 1, 132-42.
Gomanee, K., S. Girma and O. Morrissey (2004), Searching for Aid Threshold Effects, Credit Research Paper, No.03/15 (University of Nottingham: Centre for Research in Economic Development and International Trade).
Guillaumont, P. (2004), Comments on Jan Gunning’s paper “Why Give Aid?”, paper for the 2nd AFD-EUDN Conference on “Development Aid: Why and How?” (Paris, 25 November 2004).
Guillaumont P. (2006), “Macro-Vulnerability and Aid Responses” in F.Bourguignon, B. Pleskovic and J Van der Gaag Securing Development in an Unstable World, Annual Bank Conference on Development Economics Europe 2005, (Washington DC: The World Bank), forthcoming.
Guillaumont, P. and L. Chauvet (2001), “Aid and Performance: a Reassessment”, Journal of Development Studies, 37, 66-92.
Kanbur, R. (2004), Reforming the Formula: A Modest Proposal for Introducing Development Outcomes in IDA Allocation Procedures, Paper for the 2nd AFD-EUDN Conference on “Development Aid: Why and How?” (Paris, 25 November 2004).
Kaufmann, D., A. Kraay and M. Mastruzzi (2003), Governance Matters III: Governance Indicators for 1996-2002, Policy Research Working Paper No.310 (Washington DC: The World Bank).
Little, I.M.D and J.M.Clifford (1965), International Aid (London: Allen and Unwin).
Llavador, H.G. and J.E. Roemer (2001), “An Equal-opportunity Approach to the Allocation of International Aid”, Journal of Development Economics, 64, 147-171.
McGillivray, M. (1989), “The Allocation of Aid among Developing Counties: A Multi-Donor Analysis Using a Per Capita Aid Index”, World Development, 17, 14, 561-68.
McGillivray, M. (1992), “A Reply”, World Development, 20, 11, 1699-1702.
McGillivray, M. (2003a), “Efficacité de l’aide et sélectivité : vers un concept élargi”, Revue d’Economie du Développement, 11, 4, 43-62.
McGillivray, M. (2003b), Aid Effectiveness and Selectivity : Integrating Multiple Objectives into Aid Allocations, Discussion Paper No.2003/71 (Wider United Nations University). McGillivray, M. (2004a), “Descriptive and Prescriptive Analyses of Aid Allocation: Approaches, Issues, and Consequences”, International Review of Economics and Finance, 13, 275-292.
McGillivray, M. (2004b), Aid Effectiveness and Recipient Policy Regimes: A Comment on Ravi Kanbur’s Paper “Reforming the Formula”, Paper for the 2nd AFD-EUDN Conference on “Development Aid: Why and How?” (Paris, 25 November 2004).
McGillivray, M. and H. White (1994), “Development Criteria for the Allocation of Aid and Assessment of Donor Performance”, Credit Research Paper No.94/7 (University of Nottingham).
Michaïlof, S. (2004), Reforming the Formula: A Modest View from the Trenches, Paper for the 2nd AFD-EUDN Conference on “Development Aid: Why and How?” (Paris, 25 November 2004).
Radelet, S. (2004), Aid Effectiveness and the Millenium Development Goals, Working Paper No.39 (Washington, DC: Center for Global Development).
Roodman, D. (2004), An Index of Donor Performance, Working Paper No.42 (Washington, DC: Center for Global Development).
Sambanis, N. (2000), “Partition as a Solution to Ethnic War: An Empirical Critique of the Theoretical Literature”, World Politics, 52, 437-483.
Thiele, R., P. Nunnenkamp, and A. Dreher (2006), “Sectoral Aid Priorities: Are Donors Really Doing Their Best to Achieve The Millenium Development Goals?”, Kiel Working Paper 1, Kiel Institute for World Economics.
United-Nations, (2000), Poverty Amidst Riches: The Need for Change, Report of the Committee for Development Policy on the second session (New-York: 3-7 April 2000). White, H. and M. McGillivray (1995) “How Well Aid is Allocated? Descriptive Measures of Aid Allocation : A Survey of Methodology and Results, Development and Change, 26, 1, 163-184.
World Bank, (1998), Assessing Aid: What Works, What Doesn’t and Why? (New-York: Oxford University Press).
Graphs and Tables
Graph 1
Distribution of DAC donors’ aid according to CPIA
Aid per bilateral donor country’s capita to low-income countries, average for 1999-2002 ($ per capita)
Source: GMR, 2004
Graph 2
Preferential Distribution of DAC donors’ aid to LDCs
Source: DAC and CERDI’s estimates.
Irland
Belgium
USA GreeceJapanSpain AustraliaCanada New-ZelandGermany UK Austria Switzerland Italy Portugal France Finland Sweden Netherlands Luxembourg Denmark Norway 0 0,05 0,1 0,15 0,2 0,25 0,3 0,35 0 0,1 0,2 0,3 0,4 0,5 0,6 0,7 0,8 0,9 1
Total ODA in % of GNI ODA to LDCs
Table 1
Selectivity according to elasticities estimated by an allocation model 42 bilateral and multilateral donors, 2003
Selectivity focusing Selectivity focusing Selectivity focusing Global model
on MDGs on vulnerability on governance
Difference Difference Difference Difference Rank
Rank (1) w/ Dollar Rank (1) w/ Dollar Rank (1) w/ Dollar Rank (1) w/ Dollar within the
& Levin & Levin & Levin & Levin 22 bilateral donors
22 bilateral donors Australia 34 -9 23 2 14 11 24 1 7 Austria 30 -20 37 -27 35 -25 39 -29 19 Belgium 4 9 22 -9 36 -23 23 -10 6 Canada 21 2 33 -10 26 -3 25 -2 8 Denmark 15 -13 24 -22 5 -3 16 -14 4 Finland 28 -16 34 -22 19 -7 29 -17 12 France 11 21 31 1 37 -5 30 2 13 Germany 27 -7 41 -21 27 -7 41 -21 21 Greece 41 -5 25 11 38 -2 32 4 14 Ireland 5 14 13 6 23 -4 11 8 2 Italy 22 5 30 -3 40 -13 36 -9 16 Japan 39 -17 40 -18 18 4 40 -18 20 Luxembourg 17 1 14 4 28 -10 12 6 3 Netherlands 16 -9 29 -22 11 -4 28 -21 11 New Zealand 33 -3 15 15 32 -2 20 10 5 Norway 18 -10 26 -18 15 -7 27 -19 10 Portugal 8 23 4 27 41 -10 6 25 1 Spain 31 11 42 0 39 3 42 0 22 Sweden 25 -20 27 -22 22 -17 33 -28 15 Switzerland 20 1 32 -11 21 0 26 -5 9 United Kingdom 32 -28 36 -32 12 -8 38 -34 18 United States 29 -5 38 -14 20 4 37 -13 17
Table 1 cont’d
Selectivity focusing Selectivity focusing Selectivity focusing Global model
on MDGs On vulnerability on governance
Difference Difference Difference Difference Rank
Rank (1) w/ Dollar Rank (1) w/ Dollar Rank (1) w/ Dollar Rank (1) w/ Dollar within the
& Levin & Levin & Levin & Levin 20 multilateral
donors 20 multilateral donors AfDF 1 8 1 8 4 5 1 8 1 Arab Agencies 7 10 6 11 2 15 2 15 2 AsDF 42 -8 11 23 16 18 18 16 14 CarDB 36 -10 5 21 33 -7 8 18 7 EBRD 40 -12 8 20 29 -1 10 18 9 EC 19 -3 19 -3 13 3 17 -1 13 GEF 38 -24 39 -25 25 -11 34 -20 19 IDA 3 -2 2 -1 1 0 3 -2 3 IDB Sp.Fund 37 0 18 19 42 -5 22 15 17 IFAD 13 -2 12 -1 3 8 5 6 5 Nordic Dev.Fund 26 -20 7 -1 7 -1 9 -3 8 Other UN 14 19 28 5 34 -1 31 2 18 SAF+ESAF+PRGF(IMF) 6 -3 3 0 8 -5 4 -1 4 UNDP 12 17 16 13 9 20 14 15 11 UNFPA 10 29 21 18 10 29 19 20 15 UNHCR 24 17 35 6 31 10 35 6 20 UNICEF 9 29 20 18 17 21 21 17 16 UNRWA 35 5 9 31 30 10 13 27 10 UNTA 23 12 17 18 24 11 15 20 12 WFP 2 13 10 5 6 9 7 8 6
Average of Absolute value of
difference (42 donors) = 11.7 13.4 8.6 12.7
Table 2
Summary impact of changing the measurement of aid selectivity:
Average absolute value of rank differences for 42 donors (multilateral & bilateral) and for only 22 bilateral donors or 20 multilateral donors, 2003
All 42donors Bilateral only
between Dollar-Levin (2004) indices and other elasticity estimates :
Income and other governance index (KKI) 8.7 3.8
Income and vulnerability (EVI) 13.5 7.63
Income and MDGs (HAI) 11.8 6.09
Global model 12.8 7.27
between index based on global allocation model estimates and recipient
average profile index 7.25 3.63
between unadjusted recipient average profile index and index adjusted for:
Former colonies 1.72
Same language 2.27