Version postprint
Long-term cysteine fortification impacts cysteine/glutathione homeostasis and food intake in ageing rats
Karine Vidal,1 Denis Breuillé,1 Patrick Serrant,1 Philippe Denis,2,3 Françoise Glomot,2,3 Fabienne Béchereau,2,3 Isabelle Papet2,3,*
1
Department of Nutrition and Health, Nestlé Research Center, CH-10000 Lausanne 26, Switzerland, 2 INRA, UMR 1019, UNH, CRNH Auvergne, F-63000 CLERMONT-FERRAND and 3 Clermont Université, Université d'Auvergne, Unité de Nutrition Humaine, BP 10448, F-63000 CLERMONT-FERRAND
*Corresponding author: Dr Isabelle Papet, Unité de Nutrition Humaine, INRA Theix, 63122 Saint-Genès-Champanelle, France. Telephone: +33 4 73 62 42 01. Fax: +33 4 73 62 47 55. E-mail:
Isabelle.Papet@clermont.inra.fr.
Version postprint
Abstract
1
Purpose Healthy ageing is associated with higher levels of glutathione. The study aimed to determine whether
2
long-term dietary fortification with cysteine increases cysteine and glutathione pools thus, alleviating
age-3
associated low-grade inflammation and resulting in global physiological benefits.
4
Methods The effect of a 14-wk dietary fortification with cysteine was studied in non-inflamed (NI, healthy at
5
baseline) and in spontaneously age-related low-grade inflamed (LGI, prefrail at baseline) 21-mo-old rats. 57 NI
6
rats and 14 LGI rats received cysteine-supplemented diet (4.0 g/kg of free cysteine added to the standard diet
7
containing 2.8 g/kg cysteine). 56 NI rats and 16 LGI rats received a control alanine-supplemented diet.
8
Results Cysteine fortification in NI rats increased free cysteine (P < 0.0001) and glutathione (P < 0.03) in the
9
liver and the small intestine. In LGI rats, cysteine fortification increased total non-protein cysteine (P < 0.0007)
10
and free cysteine (P < 0.03) in plasma, and free cysteine (P < 0.02) and glutathione (P < 0.01) in liver. Food
11
intake decreased over time in alanine-fed rats (r2 = 0.73, P = 0.0002), whereas it was constant in cysteine-fed rats
12
(r2 = 0.02, P = 0.68). Cysteine fortification did not affect inflammatory markers, mortality, body weight loss, or
13
tissue masses.
14
Conclusion Doubling the dietary intake of cysteine in old rats increased cysteine and glutathione pools in
15
selected tissues. Additionally, it alleviated the age-related decline in food intake. Further validation of these
16
effects in the elderly population suffering from age-related anorexia would suggest a useful therapeutic approach
17
to the problem.
18
19
Key words Ageing rats . Dietary cysteine . Frailty . Low-grade inflammation
20
21
Abbreviations
22
LBP lipopolysaccharide binding protein
23
LGI low-grade inflamed
24
NAC N-acetyl cysteine
25
NI non-inflamed
26
sTNFR-1 soluble tumor necrosis factor-alpha receptor-1
27
Version postprint
Introduction
29
30
As the number of older individuals around the world is increasing dramatically, defining optimal nutrition for
31
healthy ageing, i.e. a delay in the development of chronic disease [1], is an important challenge. Ageing per se
32
and/or age-related diseases are associated with a progressive rise in oxidative stress [2] ,which plays a role in the
33
expansion of homeosteny, notably low-grade inflammation and sarcopenia [3]. The main intra-cellular
anti-34
oxidant is glutathione and imbalances in glutathione levels per se are thought to play a role in the ageing process
35
[4]. Intra-cellular glutathione concentration decreases with age in various tissues in ageing rats [5]. Along the
36
same lines, higher levels of glutathione are associated with better physical and mental health in elderly [6, 7].
37
Thus, dietary treatment aiming at increasing anti-oxidant pools, such as glutathione levels, could promote a
38
healthy ageing.
39
Glutathione is a tripeptide composed of glutamic acid, cysteine and glycine. Intra-cellular glutathione
40
levels are regulated by a complex series of mechanisms and cysteine is the rate limiting substrate for glutathione
41
synthesis [8]. Cysteine is obtained from dietary proteins, breakdown of body proteins and glutathione. It can also
42
be endogenously synthesised from methionine and serine through the transsulfuration pathway. When the
43
endogenous disposal of cysteine is insufficient regarding its metabolic utilizations, it becomes an indispensable
44
amino acid [9]. Indeed, increasing cysteine content of the diet of septic rats allows restoration of the liver
45
glutathione pool [10] and limits body weight loss and muscle wasting [11]. In spite of the fact that interventional
46
studies with the pharmacological molecule N-acetyl-cysteine (NAC) exhibited potential beneficial targeted
47
effects for elderly [12-15], health-promoting effects of long-term dietary fortification with cysteine itself remain
48
unevaluated.
49
The primary objective of the study was to determine whether long-term cysteine fortification would
50
increase cysteine and glutathione levels in healthy (i.e. non-inflamed) old rats and consequently prevent
age-51
associated development of inflammation and other adverse outcomes (i.e. towards a prefrail/frail status). The
52
secondary objective was to investigate whether cysteine fortification is able to improve the prefrail status in
53
elderly rats with low-grade inflammation. Biochemical targets were cysteine, glutathione, and inflammatory
54
markers; physiological outcomes were mortality, food intake, and body, tissue and organ weights.
55
56
57
58
59
Version postprint
Material and methods
60
61
Animals
62
63
The experiments were conducted in accordance with the French National Research Council’s Guidelines for the
64
Care and Use of Laboratory Animals. Wistar male rats were bred in our conventional
(non-specific-pathogen-65
free) animal facility (Unité Expérimentale de Nutrition Comparée, INRA, Theix, France). They were maintained
66
in collective cages (3 to 4 per cage) under controlled conditions (temperature 21°C, relative humidity 55%, 12-h
67
dark period starting at 20:00) with free access to water and standard diet until the experiment. The standard diet
68
(A04 pellets from Scientific Animal Food and Engineering (SAFE), Villemoisson-sur-Orge, France) was
69
composed of 16% protein, 3% fat, 60% carbohydrate, 12% water, fibers, vitamins, and minerals.
70
71
Experimental design
72
73
The effect of a 14-wk dietary fortification with cysteine was studied in non-inflamed and low-grade inflamed
21-74
mo old rats (Fig. 1).
75
During the pre-experimental period, plasma concentrations of fibrinogen and 2-macroglobulin were
76
measured at the ages of 18, 19 and 20.5 mo. Rats were weighed at the beginning and at the end of the
pre-77
experimental period. Apparently ill rats and/or rats that exhibited pathological values of acute phase proteins (i.e.
78
values predictive of short-term mortality according to our previous observations [16]), were excluded.
79
At the age of 21 mo rats were distributed into 2 sets based on hierarchical clustering using Ward
80
distance on the following variables: 2-macroglobulin, fibrinogen, body weight and body weight change during
81
the pre-experimental period (XLSTAT, version 7.5 software (Addinsoft, Paris, France)). A posteriori,
non-82
inflamed (NI, i.e. healthy at baseline) rats were distinguished from low-grade inflamed (LGI, i.e. prefrail at
83
baseline) rats using an 2-macroglobulin plasma threshold of 82 mg/L, which corresponds to the mean plasma
84
level + 2 SD from adult rats [16]. At baseline, LGI rats did not exhibit any apparent pathologies or pathological
85
levels of 2-macroglobulin. They were considered as prefrail because their health status was expected to
86
deteriorate more with ageing than the NI rats. Group names (numbers of rats) were as follows: NI-Ala (n = 56)
87
and NI-Cys (n = 57) for NI rats receiving alanine-supplemented (Ala) and cysteine-supplemented (Cys) diets,
88
respectively; and LGI-Ala (n = 16) and LGI-Cys (n = 14) for LGI rats receiving Ala and Cys diets, respectively.
89
Cys and Ala diets were prepared by supplementation of the standard diet A04 with amino acids and distributed
90
as pellets. Cys diet contained 6.8 g/kg diet i.e. 2.8 g/kg from dietary proteins plus 4 g/kg as free L-cysteine
91
(Sigma). Cysteine level has been chosen taking into account the efficient level (11 g/kg diet) in septic rats [11]
92
and the fact that age-associated inflammation is much lower than in sepsis. The selected cysteine level was in the
93
same range as NAC treatment performed in rats [17]. Ala diet contained 2.8 g/kg diet of cysteine from dietary
94
proteins and 2.9 g/kg diet of free L-alanine (Jerafrance) to make it iso-nitrogenous to Cys diet. Rats were
95
maintained in collective cages (2 to 3 per cage) and received the experimental diets ad libitum for 14 wk. Food
96
intake was recorded weekly per cage, and individual daily food intake was calculated according to the number of
97
rats per cage. When a death or a moribund condition occurred in a cage, the corresponding data was eliminated.
98
Blood was sampled from the lateral tail vein following 2, 6, and 13 wk of supplementation. Plasma was isolated
99
and aliquots were stored at -80°C. After 14 wk of supplementation (24 month of age), rats were killed under
100
Version postprint
general anaesthesia induced by intra-peritoneal injection of pentobarbital (6 mg/100 g body weight, 0.1 mL/100
101
g body weight, Sanofi, Libourne, France) by exsanguinations through the abdominal aorta. Aliquots of plasma
102
were collected and stored at -80°C. Posterior leg skeletal muscles, liver, small intestine, colon, and kidneys were
103
rapidly isolated. Small intestine and colon were flushed with ice-cold NaCl (9 g/L). The isolated tissues and
104
organs were blotted dry and weighed. Liver and small intestine were frozen in liquid nitrogen and stored at
-105
80°C until cysteine and glutathione analyses.
106
107
108
Biochemical analyses109
110
Plasma acute phase proteins, such as 2-macroglobulin (CV 18%), fibrinogen (CV 2 %), albumin (CV 15%) and
111
LPS-binding protein (LBP, lower detection: 1.56 ng/ml) and serum soluble tumor necrosis factor-alpha
receptor-112
1 (sTNFR-1, lower detection: 15.6 pg/ml, CV 5%) were measured as previously described [16]. Total
113
glutathione (reduced plus oxidized) was quantified with a spectrophotometer using a standard enzymatic
114
recycling procedure and 5,5'-dithio-bis-2-nitrobenzoic acid as oxidant (CV 1%) [18]. Total non-protein cysteine
115
(cysteine plus cystine and cysteine bound to proteins through disulfide bridges) was measured with a colorimeter
116
in plasma or tissue homogenates treated with dithiothreitol before deproteinization (CV 8%) [19, 20]. Free
117
cysteine (cysteine plus cystine) was quantified with the same method but dithiothreitol treatment was performed
118
after protein precipitation. The difference between total non-protein cysteine and free cysteine provided the
119
protein bound cysteine (cys-prot) value.
120
121
Statistical analysis
122
123
Survival curves were generated up to 13 wk of dietary treatment by the Kaplan-Meyer method and compared by
124
log-rank test. Other data are given as means ± SEM. Linear regression was used to assess the relationship
125
between mean food intake and time. Since rats were housed in collective cages and NI and LGI subgroups were
126
made a posteriori, for this analysis NI and LGI subgroups were combined. The Mann-Whitney U test was used
127
to analyze effects of cysteine fortification: i) NI-Cys plus LGI-Cys vs NI-Ala plus LGI-Ala, ii) NI-Cys vs NI-Ala
128
and iii) LGI-Cys vs LGI-Ala. Differences between NI-Ala and LGI-Ala, and between NI-Cys and LGI-Cys were
129
also analyzed for studying the effect of basal low-grade inflammation using the Mann-Whitney U test. The
130
Wilcoxon’s signed rank test was used to compare paired-data obtained at different time-points within a group.
131
These non-parametric tests were used since variances were not homogenous for most of the variables. P values ≤
132
0.05 were considered significant. Statistical analyses were performed using StatView for Windows, version 5
133
software (SAS Institute, Cary, NC).
134
135
Results
136
137
Pre-experimental characteristics of the aged rats
138
139
Baseline plasma concentrations of 2-macroglobulin and fibrinogen, body weight and body weight change from
140
NI-Cys and LGI-Cys rats were not significantly different from those of respective Ala groups (Table 1).
141
Version postprint
According to the experimental design, baseline concentrations of 2-macroglobulin were significantly higher in
142
LGI rats than in NI rats, being 471 % higher in LGI-Ala rats and 436 % higher in LGI-Cys rats than in the
143
corresponding NI groups. In the same way, baseline concentrations in fibrinogen were 27 % higher in LGI-Ala
144
rats and 39 % higher in LGI-Cys rats than in the corresponding NI groups. Body weight and body weight change
145
during the pre-experimental period were not significantly different between Ala and Cys groups.
LGI-146
Ala rats were lighter than NI-Ala rats, reflecting that LGI-Ala had lost body weight during the pre-experimental
147
period.
148
149
Mortality during dietary treatments
150
151
During the experimental period, mortality rate was 12, 9, 31 and 43 % in NI-Ala, NI-Cys, LGI-Ala and LGI-Cys
152
groups, respectively. As expected, comparison of the survival curves generated by Kaplan-Meyer method (not
153
shown) indicated that mortality was higher in LGI-Ala and LGI-Cys rats (prefrail at baseline) than in the
154
corresponding NI groups (healthy at baseline) (Logrank test = 2.79, P = 0.095 and Logrank test = 4.95, P =
155
0.026, respectively). Mortality was not significantly different between NI-Ala and NI-Cys rats (Logrank test =
156
0.134, P = 0.71), neither between LGI-Cys and LGI-Ala rats (Logrank test = 0.035, P = 0.85). All the results
157
described below were obtained from survivors (i.e. NI-Ala, n = 49, NI-Cys, n = 52, Ala, n = 11 and
LGI-158
Cys, n = 8).
159
160
Food intake, body weight, and organ weights
161
162
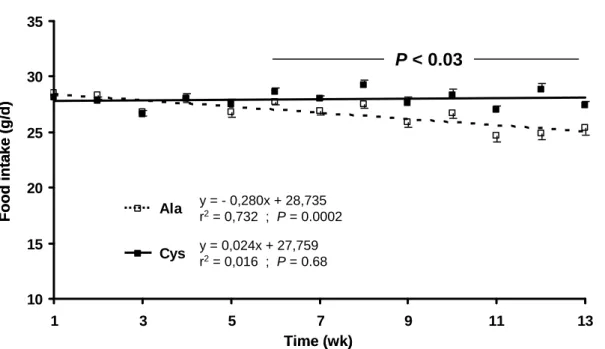
Food intake of rats fed with Ala diet (NI-Ala plus LGI-Ala rats) decreased over time (P = 0.0002), whereas it
163
was constant in rats fed with Cys diet (NI-Cys plus LGI-Cys) (Fig. 2). From wk 6 to wk 13 the food intake was 3
164
to 16 % higher in Cys-fed rats than in Ala-fed rats (P < 0.0001 to 0.03).
165
Final body weight was not significantly different between NI-Ala and NI-Cys rats (P = 0.22), neither
166
between LGI-Ala and LGI-Cys rats (P = 0.87) (Table 2). Final body weight of LGI-Ala and LGI-Cys rats
167
(prefrail at baseline) was respectively 11 and 15 % lower than in the corresponding NI groups (healthy at
168
baseline).
169
Absolute and relative weights of liver were respectively 10 and 8 % higher in Cys rats than in
NI-170
Ala rats, but were not significantly different between LGI-Ala and LGI-Cys rats (Table 2). Liver relative weight
171
in LGI-Ala and LGI-Cys rats was respectively 23 and 20 % higher in than in corresponding NI groups. Absolute
172
and relative weights of small intestine and colon were not significantly different between NI-Ala and NI-Cys
173
rats, neither between LGI-Ala and LGI-Cys rats. Relative weight of small intestine, and absolute and relative
174
weight of colon were respectively 30, 12, and 27 % higher in LGI-Ala rats than in NI-Ala rats.
175
Cysteine fortification had no significant effect on kidney or skeletal muscle weights whatever the basal
176
inflammatory status of the rats (not shown). Kidney weight in LGI-Ala and LGI-Cys rats was respectively 34
177
and 26 % higher than in the corresponding NI groups. Differences between LGI groups and the corresponding
178
NI groups were not significant for all studied skeletal muscles, excepted for EDL which was 10 % lighter in
179
LGI-Cys rats than in NI-Cys rats (P = 0.043).
180
181
Cysteine concentrations in plasma and splanchnic tissues
182
Version postprint
183
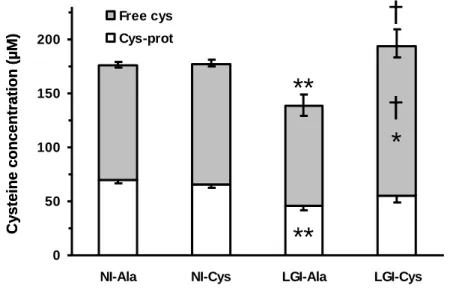
Plasma total non-protein cysteine concentration was not significantly different between NI-Ala and NI-Cys rats
184
(P = 0.47), but was 40 % higher in LGI-Cys rats than in LGI-Ala rats (Fig. 3A). This variation reveals a
185
corrective effect of dietary cysteine supplementation in rats being prefrail at baseline, since plasma total
non-186
protein cysteine concentration was 21% lower in LGI-Ala rats than in NI-Ala rats. Plasma free cysteine (i.e.
187
cysteine plus cystine) concentration in LGI-Cys rats was 50 % higher than in LGI-Ala rats and 23 % higher than
188
in NI-Cys rats. Cysteine fortification did not significantly modify the amount of cysteine bound to plasma
189
proteins through disulfide bridges (cys-prot). Nevertheless, this parameter was 34 % lower in LGI-Ala rats than
190
in NI-Ala rats.
191
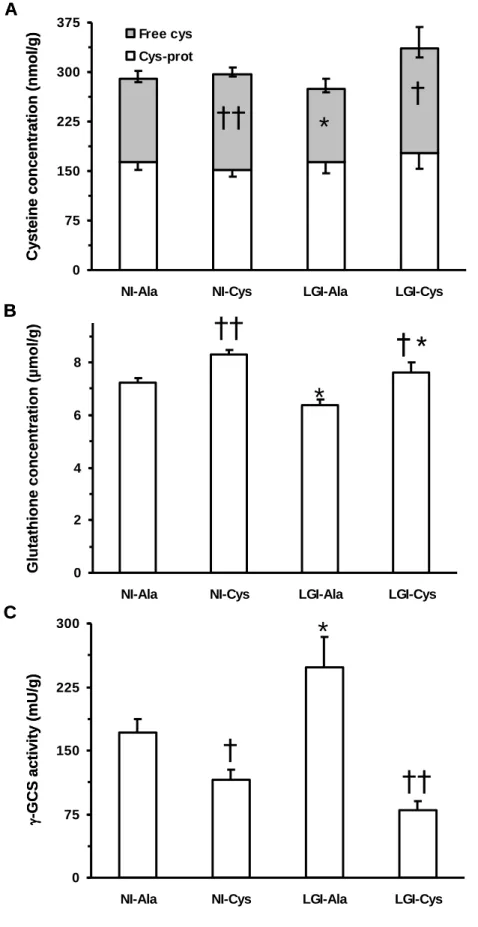
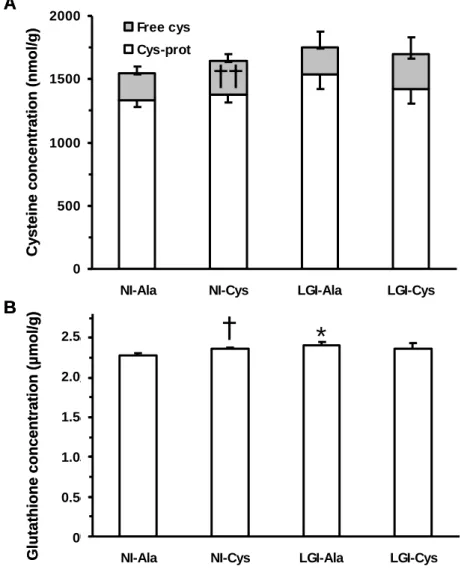
Total non-protein cysteine and cys-prot concentrations in liver and small intestine were not significantly
192
affected by cysteine fortification, neither by the basal inflammatory status (Fig. 4A and 5A). In the liver, free
193
cysteine concentration was significantly higher in the Cys-supplemented rats than in the Ala rats: 16 and 44 %
194
higher in NI-Cys and LGI-Cys rats than in the corresponding Ala groups. In addition, free cysteine concentration
195
in the liver was 16 % lower in LGI-Ala rats than in NI-Ala rats. In the small intestine, free cysteine concentration
196
was 24 % higher in NI-Cys rats than in NI-Ala rats.
197
198
Splanchnic tissues glutathione concentrations and liver -glutamylcysteine synthetase activity
199
200
Liver glutathione concentration was significantly higher in Cys-supplemented rats than in the Ala rats: 15 and
201
20 % higher in NI-Cys and LGI-Cys rats than in the corresponding Ala groups. It was lower in rats being prefrail
202
at baseline than in rats being healthy at baseline: 12 and 8 % lower in LGI-Ala and LGI-Cys rats than in the
203
corresponding NI groups (Fig. 4B). Liver -glutamylcysteine synthetase activity was significantly lower in
Cys-204
supplemented rats that in the Ala rats: 32 and 68 % lower in NI-Cys and LGI-Cys rats than in the corresponding
205
Ala groups (Fig. 4C). This enzyme activity was 45 % higher in LGI-Ala rats than in NI-Ala rats.
206
Small intestine glutathione concentration was 3 % higher in NI-Cys rats than in NI-Ala rats and 5 %
207
higher in LGI-Ala rats than in NI-Ala rats (Fig. 5).
208
209
Acute phase proteins and sTNFR-1 responses to cysteine fortification
210
211
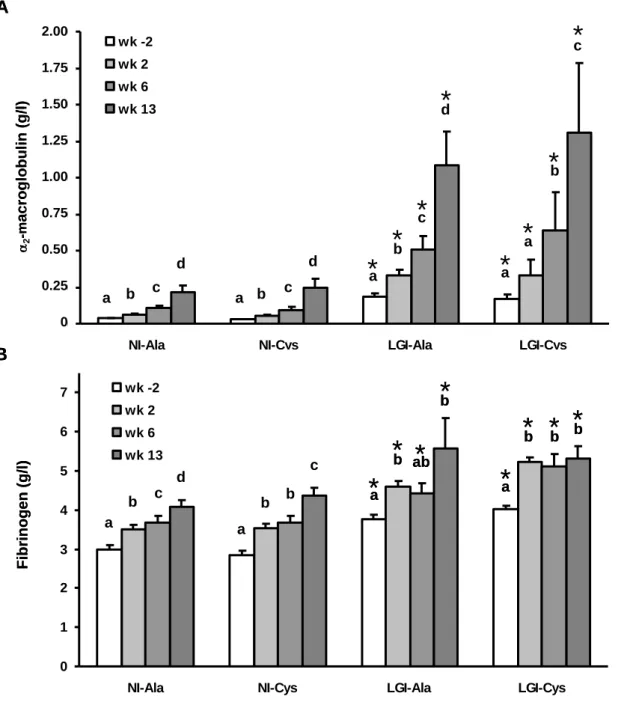
At any time points of the kinetic (wk -2, wk 2, wk 6 and wk 13), plasma 2-macroglobulin and fibrinogen
212
concentrations were not significantly different between NI-Ala and NI-Cys rats and neither between LGI-Ala
213
and LGI-Cys rats (P = 0.09 to 0.94) (Fig. 6). As expected, 2-macroglobulin and fibrinogen were significantly
214
higher in LGI-Ala and LGI-Cys rats (prefrail at baseline) than in the corresponding NI groups (healthy at
215
baseline). Time-dependent increases in 2-macroglobulin and fibrinogen concentrations were observed in all
216
groups: i) final 2-macroglobulin concentration was significantly higher than its basal value by 582, 670, 488
217
and 680 % in NI-Ala, NI-Cys, LGI-Ala and LGI-Cys rats, respectively, and ii) final fibrinogen concentration
218
was significantly higher than its basal value by 36, 53, 48 and 32 % in NI-Ala, NI-Cys, LGI-Ala and LGI-Cys
219
rats, respectively.
220
Plasma LBP and sTNFR-1 concentrations were quantified at wk -2, wk 6 and wk 13 (data not shown).
221
At any time points, no significant difference in levels of LBP or sTNFR-I were observed between NI-Ala and
222
NI-Cys rats and neither between LGI-Ala and LGI-Cys rats (P = 0.07 to 0.80). Time-dependent increases in LBP
223
Version postprint
and sTNFR-1 concentrations were observed in all groups: i) final LBP concentration was higher than its basal
224
value by 114, 59, 222 and 167 % in NI-Ala, NI-Cys, LGI-Ala and LGI-Cys rats, respectively, ii) final sTNFR-1
225
concentration was higher than its basal value by 102, 79, 153, and 191 % in NI-Ala, NI-Cys, Ala and
LGI-226
Cys rats, respectively.
227
Concentration of plasma albumin quantified at euthanasia was not significantly different between
NI-228
Ala and NI-Cys rats and neither between LGI-Ala and LGI-Cys rats (data not shown). As expected, it was lower
229
in rats being prefrail at baseline than in rats being healthy at baseline: 31 and 30 % lower in Ala and
LGI-230
Cys rats than in respective NI groups. A strong correlation was observed between plasma albumin and plasma
231
cys-prot concentrations (r2 = 0.277, P < 0.0001).232
233
Discussion234
235
To our knowledge, this is the first study to determine whether long-term (14 wk) cysteine fortification (6.8 vs.
236
2.8 g/kg) can exert beneficial effects in NI (i.e. healthy at baseline) and LGI (i.e. prefrail at baseline) old rats.
237
This is also the first study reporting that cysteine supplementation in the diet increased the spontaneous food
238
intake of old rats.
239
In NI (i.e. healthy at baseline) rats, cysteine fortification was efficient to increase free cysteine and
240
glutathione pools in liver and small intestine. In agreement with the idea that ageing is a cysteine deficient
241
syndrome [21], these increases could result from a correction of age-induced decrease in cysteine and
242
glutathione pools. One cannot rule out an accumulation above normal ranges. However, such an accumulation is
243
rather unlikely for cysteine due to the strong regulation of free cysteine pool by oxidation and degradation,
244
mainly by cysteine dioxygenase [22]. The increase of glutathione pool in liver is consistent with the fact that
245
NAC supplementation (3 g/kg diet) was efficient to reverse the age-associated decrease in liver glutathione in
246
old rats [17]. Similarly, in a elderly cohort, supplementation with NAC and glycine for 3 wk restored the
247
concentration and the rate of synthesis of blood glutathione [15]. In the present study, the observed increase in
248
liver glutathione pool could directly result from an increase in free cysteine since availability of cysteine is a rate
249
limiting factor for glutathione synthesis [23]. The finding of reduced -glutamylcysteine synthetase activity with
250
cysteine fortification further ruled out the possibility of an increase in its activity as the underlying cause for
251
increased glutathione levels. The most logical explanation for this reduction in enzyme activity is the feedback
252
inhibition exerted by glutathione itself [4]. In a previous study, heat treatment plus NAC also resulted in a
253
similar inhibition of -glutamylcysteine synthetase activity [24]. Following increased glutathione concentration
254
in the liver, a subsequent increase in the hepatic efflux rate and a more favourable uptake of glutathione by
extra-255
hepatic tissues are expected. This would result in better protection against pathological oxidative challenges in
256
aged rats, but this remains untested. Regardless of the mechanism, cysteine fortification-induced increases in free
257
cysteine and glutathione pools in liver and small intestine did not affect the kinetics of inflammatory markers in
258
rats that were healthy at baseline. This is in contrast to the reported effects of NAC in other models [12, 25, 26].
259
Further, cysteine fortification-induced effects on cysteine and glutathione pools did not affect final organ, muscle
260
or body weights (except increase in liver weight), or mortality rate in rats that were healthy at baseline. This lack
261
of an effect on body weight rejects the potential relationship between dietary cysteine and obesity [27]. The
262
absence of exercise in the experimental protocol may explain the lack of effect on the skeletal muscle weight.
263
Indeed, NAC supplementation plus physical activity have been reported to improve muscular performance,
264
Version postprint
especially in frail elderly subjects with poor plasma arginine levels [12]. Altogether, the present results support
265
that a deficiency in cysteine or glutathione is not a key player in the age-associated development of inflammation
266
in rats that are healthy at baseline. It rather reflects the development of a subclinical pathology as attested by the
267
increased levels of inflammatory markers reached at the end of the experiment. It has already been stressed that
268
the distinction between ageing per se and age-associated pathology is almost impossible [28].
269
In LGI (i.e. prefrail at baseline) rats, the major effects of cysteine fortification were similar to those
270
observed in NI rats that were healthy at baseline i.e. an increase in plasma free and total non-protein cysteine
271
pools, an increase in free cysteine and glutathione pools along with a decrease in the activity of
-272
glutamylcysteine synthetase in the liver. These effects of cysteine fortification are considered beneficial since
273
most of these parameters were altered in low-grade inflamed rats compared to healthy ones (i.e. in LGI-Ala vs.
274
NI-Ala groups). Nevertheless, cysteine fortification did not alleviate the progression of inflammation in rats that
275
showed low-grade inflammation at baseline. The mortality rate of LGI rats was higher than that for NI rats, and
276
LGI survivors exhibited a lower body weight, higher intestine and kidneys weights than the NI survivors. At the
277
end of the experiment, the inflammatory markers of LGI rats reached pathological levels [16]. These
278
observations confirm that basal low-grade inflammation is a predictive factor of frailty and increased mortality
279
[16, 29-31]. Altogether, cysteine fortification did not stop the progression from prefrailty to frailty and the basal
280
low-grade inflammation seems to be a likely consequence of nascent pathologies.
281
The most unexpected result of our experiment was that cysteine fortification alleviated the
age-282
associated decrease in food intake. Our data clearly show that the progressive age-related decrease of food intake
283
observed in ageing rats was suppressed when the animals were supplemented with cysteine. This beneficial
284
effect could be of great importance since decreased food intake has been reported as a robust factor in predicting
285
mortality in hospitalized patients, being even superior to weight loss [32]. While further validation of this effect
286
would be prudent, published data does indeed, support such an effect. In a model of LPS-induced anorexia in
287
mice, it has been shown that food intake is higher when brain glutathione is higher [33]. Brain anti-oxidative
288
defences, notably glutathione, are known to decrease with age [34]. It is possible that the increased availability
289
of cysteine in old rats receiving cysteine fortification allowed a better transport of cysteine into the brain and/or a
290
higher synthesis of glutathione in this organ. Indeed, the transport of cysteine into the brain has been shown to be
291
an important determinant of brain glutathione [35]. In addition, NAC supplementation led to an enhancement of
292
glutathione concentration in brain [14]. These data suggest that the maintenance of food intake in our
Cys-293
supplemented rats is due to by an increase in brain glutathione. Unfortunately, this hypothesis cannot be
294
confirmed since no brain sampling was performed in the present study. Other mechanisms cannot be ruled out,
295
notably those related to pro-inflammatory cytokines playing a role in anorexia [36]. Such cytokines have been
296
shown to be decreased in brain of aged rats receiving NAC along with -tocopherol and -lipoic acid [37].
297
In conclusion, long-term cysteine fortification, leading to the doubling of its dietary supply, appears to
298
be safe (mortality and organ weights unchanged) and efficient in increasing the size of cysteine and glutathione
299
pools in rats that were either healthy or prefrail at baseline. Unfortunately, it did not counteract the development
300
of inflammation in rats that were non-inflamed at baseline nor did it stop the progression of inflammation in rats
301
that showed low-grade inflammation at baseline. Age-associated inflammation seems to be rather a marker of
302
subclinical and clinical pathology than a consequence of a possible cysteine/glutathione deficiency. The novel
303
finding of the study, which needs to be confirmed, was that cysteine fortification inhibited the age-associated
304
anorexia.
305
Version postprint
306
Acknowledgments The authors would like to acknowledge Marie Perrot for help in the statistical analysis,
307
Jacques Vuichoud for determination of amino acids in the standard diet, the Staff of the Unité Expérimentale de
308
Nutrition Comparée for animal care, and Viral Vishnuprasad Brahmbhatt (Nestlé Research Center) for
309
improving the manuscript. This work was supported by Institut National de la Recherche Agronomique (INRA),
310
France and Nestlé, Switzerland.
311
312
Conflict of interest K. Vidal, D. Breuillé and P. Serrant are employees of Nestec Ltd. K. Vidal, D. Breuillé, and
313
I. Papet are co-inventors on a patent related to the present study. P. Denis, F. Glomot and F. Béchereau, no
314
conflict of interest.
315
Version postprint
References
317
318
1. Fries JF (1983) The compression of morbidity. Milbank Memorial Fund Quarterly-Health and Society
319
61:397-419
320
2. Beckman KB, Ames BN (1998) The free radical theory of aging matures. Physiol Rev 78:547-581
321
3. Meng SJ, Yu LJ (2010) Oxidative Stress, Molecular Inflammation and Sarcopenia. Int J Mol Sci
322
11:1509-1526
323
4. Ballatori N, Krance SM, Notenboom S, Shi S, Tieu K, Hammond CL (2009) Glutathione dysregulation
324
and the etiology and progression of human diseases. Biol Chem 390:191-214
325
5. Mosoni L, Breuillé D, Buffière C, Obled C, Patureau Mirand P (2004) Age-related changes in
326
glutathione availability and skeletal muscle carbonyl content in healthy rats. Exp Gerontol 39:203-210
327
6. Lang CA, Naryshkin S, Schneider DL, Mills BJ, Lindeman RD (1992) Low blood glutathione levels in
328
healthy aging adults. J Lab Clin Med 120:720-725
329
7. Julius M, Lang CA, Gleiberman L, Harburg E, DiFranceisco W, Schork A (1994) Glutathione and
330
morbidity in a community-based sample of elderly. J Clin Epidemiol 47:1021-1026
331
8. Maher P (2005) The effects of stress and aging on glutathione metabolism. Ageing Res Rev 4:288-314
332
9. Obled C, Papet I, Breuillé D (2004) Sulfur-containing amino acids and glutathione in diseases. In:
333
Cynober LA (ed) Metabolic and Therapeutic Aspects of Amino Acids in Clinical Nutrition. CRC Press,
334
p 667-687
335
10. Obled C, Papet I, Breuille D (2002) Metabolic bases of amino acid requirements in acute diseases.
336
Current Opinion in Clinical Nutrition and Metabolic Care 5:189-197
337
11. Breuillé D, Béchereau F, Buffière C, Denis P, Pouyet C, Obled C (2006) Beneficial effect of amino acid
338
supplementation, especially cysteine, on body nitrogen economy in septic rats. Clin Nutr 25:634-642
339
12. Hauer K, Hildebrandt W, Sehl Y, Edler L, Oster P, Dröge W (2003) Improvement in muscular
340
performance and decrease in tumor necrosis factor level in old age after antioxidant treatment. J Mol
341
Med 81:118-125
342
13. Arranz L, Fernández C, Rodríguez A, Ribera JM, De la Fuente M (2008) The glutathione precursor
N-343
acetylcysteine improves immune function in postmenopausal women. Free Radical Biol Med
45:1252-344
1262
345
14. Kanwar SS, Nehru B (2007) Modulatory effects of N-acetylcysteine on cerebral cortex and cerebellum
346
regions of ageing rat brain. Nutr Hosp 22:95-100
347
15. Sekhar RV, Patel SG, Guthikonda AP, Reid M, Balasubramanyam A, Taffet GE, Jahoor F (2011)
348
Deficient synthesis of glutathione underlies oxidative stress in aging and can be corrected by dietary
349
cysteine and glycine supplementation. Am J Clin Nutr 94:847-853
350
16. Mayot G, Vidal K, Martin JF, Breuillé D, Blum S, Obled C, Papet I (2007) Prognostic values of
alpha2-351
macroglobulin, fibrinogen and albumin in regards to mortality and frailty in old rats. Exp Gerontol
352
42:498-505
353
17. Grattagliano I, Portincasa P, Cocco T, Moschetta A, Di Paola M, Palmieri VO, Palasciano G (2004)
354
Effect of dietary restriction and N-acetylcysteine supplementation on intestinal mucosa and liver
355
mitochondrial redox status and function in aged rats. Exp Gerontol 39:1323-1332
356
Version postprint
18. Malmezat T, Breuillé D, Pouyet C, Patureau Mirand P, Obled C (1998) Metabolism of cysteine is
357
modified during the acute phase of sepsis in rats. J Nutr 128:97-105
358
19. Gaitonde MK (1967) A spectrophotometric method for the direct determination of cysteine in the
359
presence of other naturally occurring amino acids. Biochem J 104:627-633.
360
20. Malloy MH, Rassin DK, Gaull GE (1981) A method for measurement of free and bound plasma
361
cyst(e)ine. Anal Biochem 113:407-415
362
21. Dröge W (2005) Oxidative stress and ageing: is ageing a cysteine deficiency syndrome? Phil Trans R
363
Soc B 360:2355-2372
364
22. Stipanuk MH, Ueki I, Dominy JE, Simmons CR, Hirschberger LL (2009) Cysteine dioxygenase: a
365
robust system for regulation of cellular cysteine levels. Amino Acids 37:55-63
366
23. Griffith OW (1999) Biologic and pharmacologic regulation of mammalian glutathione synthesis. Free
367
Radical Biol Med 27:922-935
368
24. Morrison JP, Coleman MC, Aunan ES, Walsh SA, Spitz DR, Kregel KC (2005) Thiol supplementation
369
in aged animals alters antioxidant enzyme activity after heat stress. J Appl Physiol 99:2271-2277
370
25. Hack V, Breitkreutz R, Kinscherf R, Röhrer H, Bärtsch P, Taut F, Benner A, Dröge W (1998) The
371
redox state as a correlate of senescence and wasting and as a target for therapeutic intervention. Blood
372
92:59-67
373
26. Kim CJ, Kovacs-Nolan J, Yang C, Archbold T, Fan MZ, Mine Y (2009) L-cysteine supplementation
374
attenuates local inflammation and restores gut homeostasis in a porcine model of colitis. Biochim
375
Biophys Acta 1790:1161-1169
376
27. Elshorbagy AK, Smith AD, Kozich V, Refsum H (2012) Cysteine and obesity. Obesity 20:473-481
377
28. Ferrucci L (2008) The Baltimore Longitudinal Study of Aging (BLSA): A 50-Year-Long Journey and
378
Plans for the Future. Journals of Gerontology Series a-Biological Sciences and Medical Sciences
379
63:1416-1419
380
29. Cohen HJ, Harris T, Pieper CF (2003) Coagulation and activation of inflammatory pathways in the
381
development of functional decline and mortality in the elderly. Am J Med 114:180-187
382
30. Ferrucci L, Penninx BWJH, Volpato S, Harris TB, Bandeen-Roche K, Balfour J, Leveille SG, Fried LP,
383
Guralnick JM (2002) Change in muscle strength explains accelerated decline of physical function in
384
older women with high interleukin-6 serum levels. J Am Geriatr Soc 50:1947-1954
385
31. Harris TB, Ferrucci L, Tracy RP, Corti MC, Wacholder S, Ettinger WHJ, Heimovitz H, Cohen HJ,
386
Wallace R (1999) Associations of elevated interleukin-6 and C-reactive protein levels with mortality in
387
the elderly. Am J Med 106:506-512
388
32. Landi F, Laviano A, Cruz-Jentoft AJ (2010) The Anorexia of Aging: Is It a Geriatric Syndrome? J Am
389
Med Dir Assoc 11:153-156
390
33. Hernadfalvi N, Langhans W, von Meyenburg C, Onteniente B, Richard D, Arsenijevic D ( 2007) Role
391
for glutathione in the hyposensitivity of LPS-pretreated mice to LPS anorexia. Eur Cytokine Netw
392
18:86-92
393
34. Chen TS, Richie JP, Jr., Lang CA (1989) The effect of aging on glutathione and cysteine levels in
394
different regions of the mouse brain. Proc Soc Exp Biol Med 190:399-402
395
Version postprint
35. Aoyama K, Suh SW, Hamby AM, Liu J, Chan WY, Chen Y, Swanson RA (2006) Neuronal glutathione
396
deficiency and age-dependent neurodegeneration in the EAAC1 deficient mouse. Nat Neurosci
9:119-397
126
398
36. Gautron L, Layé S (2009) Neurobiology of Inflammation-Associated Anorexia. Frontiers in
399
Neuroscience 3:59
400
37. Thakurta IG, Chattopadhyay M, Ghosh A, Chakrabarti S (2012) Dietary supplementation with N-acetyl
401
cysteine, α-tocopherol and α-lipoic acid reduces the extent of oxidative stress and proinflammatory state
402
in aged rat brain. Biogerontology 13:479-488
403
404
405
Version postprint
Figure captions
406
407
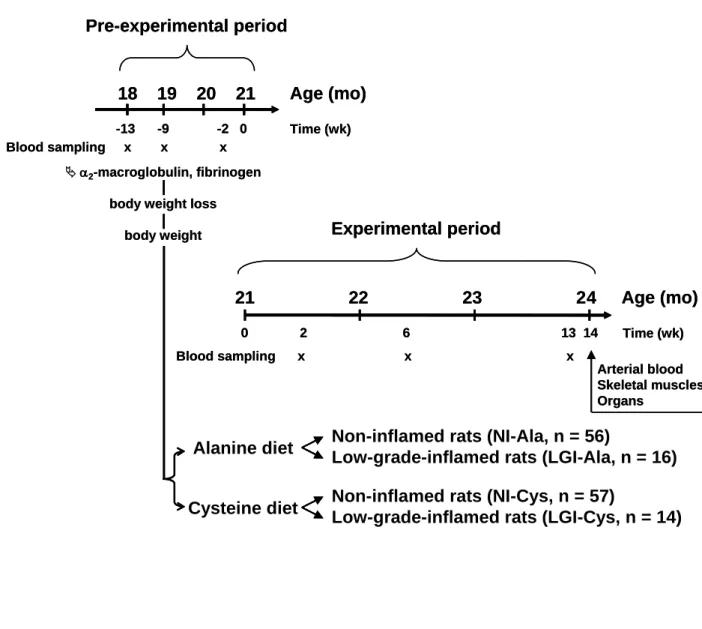
Fig.1. Experimental design.
408
409
Fig. 2. Effect of cysteine fortification on food intake in ageing rats.
410
Ala: combined NI-Ala plus LGI-Ala groups, Cys: combined NI-Cys plus LGI-Cys groups.
411
412
Fig. 3. Effect of cysteine fortification on plasma protein cysteine concentration in old rats being
non-413
inflamed or low-grade inflamed at baseline.
414
Bars are means ± SEM. Panel A, upper SEM stand for total cysteine, lower SEM for free cysteine or protein
-415
linked cysteine. Symbols on the bars illustrate significant difference for free cysteine or protein-linked cysteine,
416
symbols above the bars for total (free plus protein-linked) cysteine. *, ** different from corresponding NI group
417
P < 0.04 and P < 0.0007, respectively. † different from corresponding Ala group P < 0.006.
418
419
Fig. 4. Effect of cysteine fortification on liver non-protein cysteine and glutathione concentrations and on
-420
glutamylcysteine synthetase (-GCS) activity in old rats being non-inflamed or low-grade inflamed at baseline.
421
Bars are means ± SEM. Panel A, upper SEM stand for total cysteine, lower SEM for free cysteine or protein
-422
linked cysteine. Symbols on the bars illustrate significant difference for free cysteine. * different from
423
corresponding NI group P < 0.05. †, †† different from corresponding Ala group P < 0.02 and P < 0.0004,
424
respectively.
425
426
Fig. 5. Effect of cysteine fortification on small intestine non-protein cysteine and glutathione concentrations in
427
old rats being non-inflamed or low-grade inflamed at baseline.
428
Bars are means ± SEM. Panel A, upper SEM stand for total cysteine, lower SEM for free cysteine or protein
-429
linked cysteine. Symbols on the bars illustrate significant difference for free cysteine. * different from
430
corresponding NI group P < 0.04. †, †† different from corresponding Ala group P < 0.03 and P < 0.0001,
431
respectively.
432
433
Fig. 6. Effect of cysteine fortification on plasma acute phase protein kinetics in ageing rats being non-inflamed
434
or low-grade inflamed at baseline.
435
Bars are means ± SEM. a, b, c, d labelled bars within a group without a common letter differ, P < 0.05. * different
436
from the same time point of the corresponding NI group P < 0.03.
437
Version postprint
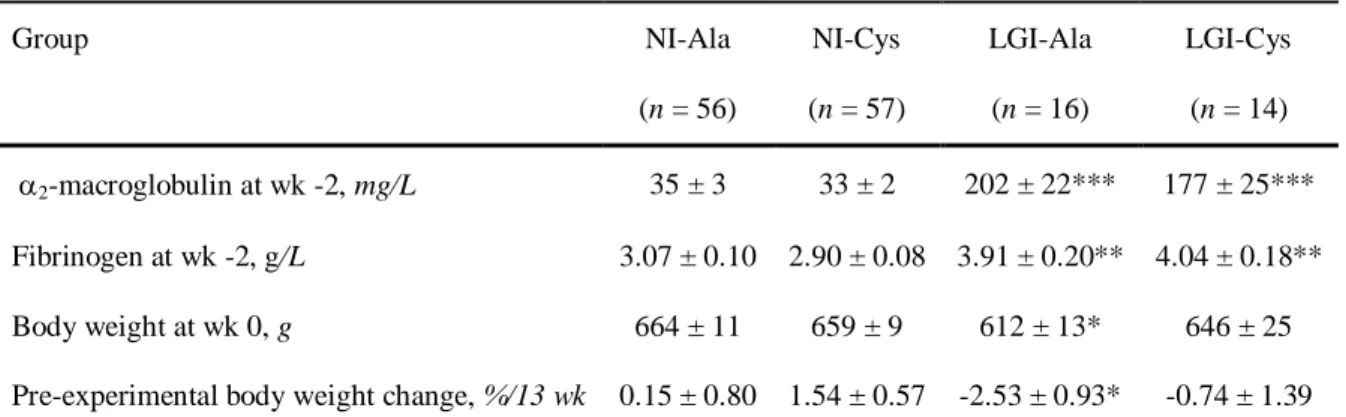
Table 1. Plasma acute phase protein concentrations, body weight and body weight change before dietary supplementation
Group NI-Ala (n = 56) NI-Cys (n = 57) LGI-Ala (n = 16) LGI-Cys (n = 14) 2-macroglobulin at wk -2, mg/L 35 ± 3 33 ± 2 202 ± 22*** 177 ± 25*** Fibrinogen at wk -2, g/L 3.07 ± 0.10 2.90 ± 0.08 3.91 ± 0.20** 4.04 ± 0.18** Body weight at wk 0, g 664 ± 11 659 ± 9 612 ± 13* 646 ± 25
Pre-experimental body weight change, %/13 wk 0.15 ± 0.80 1.54 ± 0.57 -2.53 ± 0.93* -0.74 ± 1.39 $
Version postprint
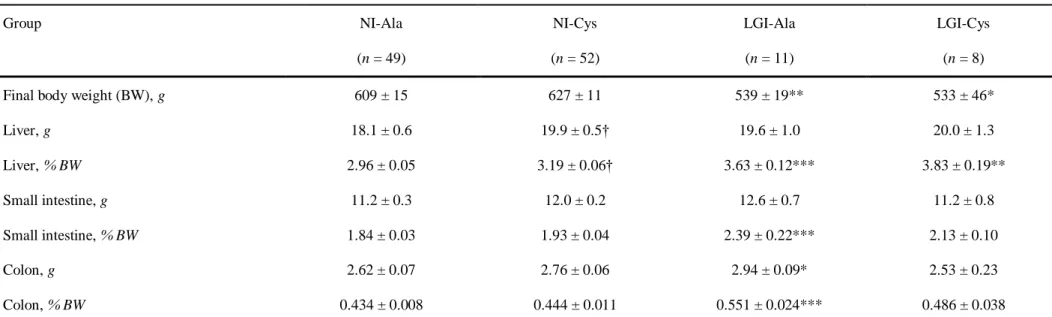
Table 2. Effects of cysteine fortification on body and organ weights in old rats being non-inflamed or low-grade inflamed at baseline
Group NI-Ala (n = 49) NI-Cys (n = 52) LGI-Ala (n = 11) LGI-Cys (n = 8)
Final body weight (BW), g 609 ± 15 627 ± 11 539 ± 19** 533 ± 46*
Liver, g 18.1 ± 0.6 19.9 ± 0.5† 19.6 ± 1.0 20.0 ± 1.3 Liver, % BW 2.96 ± 0.05 3.19 ± 0.06† 3.63 ± 0.12*** 3.83 ± 0.19** Small intestine, g 11.2 ± 0.3 12.0 ± 0.2 12.6 ± 0.7 11.2 ± 0.8 Small intestine, % BW 1.84 ± 0.03 1.93 ± 0.04 2.39 ± 0.22*** 2.13 ± 0.10 Colon, g 2.62 ± 0.07 2.76 ± 0.06 2.94 ± 0.09* 2.53 ± 0.23 Colon, % BW 0.434 ± 0.008 0.444 ± 0.011 0.551 ± 0.024*** 0.486 ± 0.038 $
Version postprint
Fig. 1. Experimental design.
18 19 20 21
Time (wk)
21 22 23 24
2-macroglobulin, fibrinogen body weight loss
body weight 0 2 6 13 14
Pre-experimental period
Experimental period
Blood sampling x x x -13 -9 -2 0Age (mo)
Time (wk)Age (mo)
Arterial blood Skeletal muscles Organs Blood sampling x x xAlanine diet
Non-inflamed rats (NI-Ala, n = 56)
Low-grade-inflamed rats (LGI-Ala, n = 16)
Non-inflamed rats (NI-Cys, n = 57)
Low-grade-inflamed rats (LGI-Cys, n = 14)
Cysteine diet
Version postprint
Fig. 2. Effect of cysteine fortification on food intake in ageing rats.
10 15 20 25 30 35 1 3 5 7 9 11 13 Ala Cys Time (wk) Food inta k e ( g/d ) y = - 0,280x + 28,735 r2= 0,732 ; P = 0.0002 y = 0,024x + 27,759 r2= 0,016 ; P = 0.68
P < 0.03
10 15 20 25 30 35 1 3 5 7 9 11 13 Ala Cys Time (wk) Food inta k e ( g/d ) y = - 0,280x + 28,735 r2= 0,732 ; P = 0.0002 y = 0,024x + 27,759 r2= 0,016 ; P = 0.68P < 0.03
Version postprint
Fig. 3. Effect of cysteine fortification on plasma protein cysteine concentration in old rats being
non-inflamed or low-grade non-inflamed at baseline.
0 50 100 150 200
NI-Ala NI-Cys LGI-Ala LGI-Cys Free cys Cys-prot C y stei n e c o nc entr at ion (µ M)
**
†
*
†
**
0 50 100 150 200NI-Ala NI-Cys LGI-Ala LGI-Cys Free cys Cys-prot C y stei n e c o nc entr at ion (µ M)
**
†
*
†
**
Bars are means ± SEM. Panel A, upper SEM stand for total cysteine, lower SEM for free cysteine or protein-linked cysteine. Symbols on the bars illustrate significant difference for free cysteine or protein-protein-linked cysteine, symbols above the bars for total (free plus protein-linked) cysteine. *, ** different from corresponding NI group P < 0.04 and P < 0.0007, respectively. † different from corresponding Ala group P < 0.006.
Version postprint
Fig. 4. Effect of cysteine fortification on liver non-protein cysteine and glutathione concentrations and on -glutamylcysteine synthetase (-GCS) activity in old rats being non-inflamed or low-grade inflamed at baseline.
0 75 150 225 300 375
NI-Ala NI-Cys LGI-Ala LGI-Cys Free cys Cys-prot 0 2 4 6 8
NI-Ala NI-Cys LGI-Ala LGI-Cys
C y stei n e c o nc entr at ion (nmo l/ g )
A
††
*
†
Glut at hion e con c e ntr at io n ( µ mol /g) -GCS a ct iv it y ( mU/g )B
C
0 75 150 225 300NI-Ala NI-Cys LGI-Ala LGI-Cys
††
† *
*
††
†
*
0 75 150 225 300 375NI-Ala NI-Cys LGI-Ala LGI-Cys Free cys Cys-prot 0 2 4 6 8
NI-Ala NI-Cys LGI-Ala LGI-Cys
C y stei n e c o nc entr at ion (nmo l/ g )
A
††
*
†
Glut at hion e con c e ntr at io n ( µ mol /g) -GCS a ct iv it y ( mU/g )B
C
0 75 150 225 300NI-Ala NI-Cys LGI-Ala LGI-Cys
††
† *
† *
*
††
†
*
Bars are means ± SEM. Panel A, upper SEM stand for total cysteine, lower SEM for free cysteine or protein-linked cysteine. Symbols on the bars illustrate significant difference for free cysteine. * different from corresponding NI group P < 0.05. †, †† different from corresponding Ala group P < 0.02 and P < 0.0004, respectively.
Version postprint
Fig. 5. Effect of cysteine fortification on small intestine non-protein cysteine and glutathione concentrations in
old rats being non-inflamed or low-grade inflamed at baseline.
0 0,5 1 1,5 2 2,5
NI-Ala NI-Cys LGI-Ala LGI-Cys 0
500 1000 1500 2000
NI-Ala NI-Cys LGI-Ala LGI-Cys Free cys Cys-prot Glut at hion e con c e ntr at io n ( µ mol /g) 2.5 2.0 1.5 1.0 0.5 0
B
C y stei n e c o nc entr at ion (nmo l/ g )A
††
†
*
0 0,5 1 1,5 2 2,5NI-Ala NI-Cys LGI-Ala LGI-Cys 0
500 1000 1500 2000
NI-Ala NI-Cys LGI-Ala LGI-Cys Free cys Cys-prot Glut at hion e con c e ntr at io n ( µ mol /g) 2.5 2.0 1.5 1.0 0.5 0
B
C y stei n e c o nc entr at ion (nmo l/ g )A
††
†
*
Bars are means ± SEM. Panel A, upper SEM stand for total cysteine, lower SEM for free cysteine or protein-linked cysteine. Symbols on the bars illustrate significant difference for free cysteine. * different from corresponding NI group P < 0.04. †, †† different from corresponding Ala group P < 0.03 and P < 0.0001, respectively.
Version postprint
Fig. 6. Effect of cysteine fortification on plasma acute phase protein kinetics in ageing rats being non-inflamed
or low-grade inflamed at baseline.
0 250 500 750 1000 1250 1500 1750 2000
NI-Ala NI-Cys LGI-Ala LGI-Cys
wk -2 wk 2 wk 6 wk 13 0 1 2 3 4 5 6 7
NI-Ala NI-Cys LGI-Ala LGI-Cys
wk -2 wk 2 wk 6 wk 13 Fibri nog en ( g/l ) 2.00 1.75 1.50 1.25 1.00 0.75 0.50 0.25 0 2 -m a c roglo buli n ( g/l )
A
B
a a a a b c d b c d b c d a b c*
*
*
*
*
*
*
*
a a b c d b b c a*
b*
ab*
b*
a*
b*
*
b*
b 0 250 500 750 1000 1250 1500 1750 2000NI-Ala NI-Cys LGI-Ala LGI-Cys
wk -2 wk 2 wk 6 wk 13 0 1 2 3 4 5 6 7
NI-Ala NI-Cys LGI-Ala LGI-Cys
wk -2 wk 2 wk 6 wk 13 Fibri nog en ( g/l ) 2.00 1.75 1.50 1.25 1.00 0.75 0.50 0.25 0 2 -m a c roglo buli n ( g/l )
A
B
a a a a b c d b c d b c d a b c*
*
*
*
*
*
*
*
a a b c d b b c a*
a*
b*
b*
abab*
*
b*
b*
a*
a*
b*
b*
*
*
bb*
*
bbBars are means ± SEM. a, b, c, d labelled bars within a group without a common letter differ, P < 0.05. * different from the same time point of the corresponding NI group P < 0.03.