HAL Id: inserm-00623261
https://www.hal.inserm.fr/inserm-00623261
Submitted on 13 Sep 2011
HAL is a multi-disciplinary open access archive for the deposit and dissemination of sci-entific research documents, whether they are pub-lished or not. The documents may come from teaching and research institutions in France or abroad, or from public or private research centers.
L’archive ouverte pluridisciplinaire HAL, est destinée au dépôt et à la diffusion de documents scientifiques de niveau recherche, publiés ou non, émanant des établissements d’enseignement et de recherche français ou étrangers, des laboratoires publics ou privés.
Bouvier-Alias, Isabelle Rosa, Dominique Roulot, Vincent Leroy, Ariane
Mallat, Jean-Michel Pawlotsky
To cite this version:
Christophe Hézode, Laurent Castéra, Françoise Roudot-Thoraval, Magali Bouvier-Alias, Isabelle Rosa, et al.. Liver stiffness diminishes with antiviral response in chronic hepatitis C.: Liver Stiffness Kinetics on HCV Therapy. Alimentary Pharmacology and Therapeutics, Wiley, 2011, 34 (6), pp.656-663. �10.1111/j.1365-2036.2011.04765.x�. �inserm-00623261�
For Peer Review
Liver Stiffness Diminishes with Antiviral Response in Chronic Hepatitis C
Journal: Alimentary Pharmacology & Therapeutics Manuscript ID: APT-0306-2011.R2
Wiley - Manuscript type: Original Scientific Paper Date Submitted by the
Author: n/a
Complete List of Authors: Hezode, Christophe Castéra, Laurent
Roudot-Thoraval, Françoise Bouvier-Alias, Magali Rosa, Isabelle
ROULOT, Dominique; Hopital jean verdier, Liver unit Leroy, Vincent
Mallat, Ariane
Pawlotsky, Jean-Michel; Hopital Henri Mondor - Université Paris XII, Virology
Keywords: Hepatology, Hepatitis C < Hepatology, Liver fibrosis < Hepatology, Viral hepatitis < Hepatology
For Peer Review
Liver Stiffness Diminishes with Antiviral
Response in Chronic Hepatitis C
Christophe Hézode,1,2* Laurent Castéra,3* Françoise Roudot-Thoraval,2,4Magali Bouvier-Alias,2,5 Isabelle Rosa,6 Dominique Roulot,7 Vincent Leroy,8Ariane Mallat,1,2
and Jean-Michel Pawlotsky2,5
1
Department of Hepatology and Gastroenterology, Hôpital Henri Mondor, Université Paris-Est, Créteil, France; 2INSERM U955, Créteil, France; 3Department of Hepatology and Gastroenterology; Hôpital Haut-Lévêque et Hôpital Saint-André, Université Victor Segalen Bordeaux II, Bordeaux, France; 4Department of
Public Health, Hôpital Henri Mondor, Université Paris-Est, Créteil; 5National Reference Center for Viral Hepatitis B, C and Delta, Department of Virology, Hôpital Henri Mondor, Université Paris-Est, Créteil, France; 6Department of Hepatology and Gastroenterology, Centre HospitalierIntercommunal, Créteil, France; 7Department of Hepatology and Gastroenterology, HôpitalAvicenne, Université Paris 13, Bobigny,
France; 8Department of Hepatology and Gastroenterology, Hôpital de la Tronche, University of Grenoble, Grenoble, France
*These 2 authors equally contributed to the work
RUNNING HEAD: Liver Stiffness Kinetics on HCV Therapy
Corresponding author: Prof. Jean-Michel Pawlotsky, MD, PhD, Department of Virology, Hôpital Henri Mondor, 51 avenue du Maréchal de Lattre de Tassigny, 94010 Créteil, France. Tel: +33-1-4981-2827; Fax: +33-1-4981-4831. E-mail: jean-michel.pawlotsky@hmn.aphp.fr 3 4 5 6 7 8 9 10 11 12 13 14 15 16 17 18 19 20 21 22 23 24 25 26 27 28 29 30 31 32 33 34 35 36 37 38 39 40 41 42 43 44 45 46 47 48 49 50 51 52 53 54 55 56 57 58 59
For Peer Review
ABSTRACT
Background: Transient elastography measures liver stiffness, which correlates with the hepatic fibrosis stage and has excellent accuracy for the diagnosis of cirrhosis in patients with chronic hepatitis C.
Aim: To prospectively assess the kinetics of liver stiffness in treated patients with chronic hepatitis C and compare them with the viral kinetics on treatment and with the final outcome of therapy.
Methods: 91 patients with chronic hepatitis C with significant fibrosis (>7.0 kPa) at baseline were included. They received therapy with pegylated interferon-α and
ribavirin. The kinetics of liver stiffness were characterized during therapy and thereafter by means of Fibroscan®, and compared with the virological responses at weeks 4, 12, 24, end of treatment and 12 and 24 weeks after.
Results: A significant liver stiffness decrease was observed during therapy, which continued after treatment only in patients who achieved a sustained virological response. In this group, the median intra-patient decrease relative to baseline at the end of follow-up was -3.4 kPa, vs -1.8 kPa in the patients who did not achieve an SVR. Similar dynamics were observed in cirrhotic and non-cirrhotic patients. In multivariate analysis, only the SVR was associated with long-term improvement of liver stiffness (odds ratio: 3.10; 95% confidence interval: 1.20-8.02, p=0.019).
Conclusions:In patients with advanced fibrosis at the start of therapy, liver stiffness is significantly reduced during treatment, but improvement continues off treatment only in patients who achieve a sustained virological response. Liver stiffness
3 4 5 6 7 8 9 10 11 12 13 14 15 16 17 18 19 20 21 22 23 24 25 26 27 28 29 30 31 32 33 34 35 36 37 38 39 40 41 42 43 44 45 46 47 48 49 50 51 52 53 54 55 56 57 58 59
For Peer Review
assessment earlier than 6 months after the end of therapy does not appear to be clinically meaningful. 3 4 5 6 7 8 9 10 11 12 13 14 15 16 17 18 19 20 21 22 23 24 25 26 27 28 29 30 31 32 33 34 35 36 37 38 39 40 41 42 43 44 45 46 47 48 49 50 51 52 53 54 55 56 57 58 59
For Peer Review
Chronic infection with hepatitis C virus (HCV) is the leading cause of chronic liver disease in Europe and the United States. Chronic hepatitis C is responsible for substantial morbidity and mortality related to liver cirrhosis and its complications, including hepatocellular carcinoma.1 Nowadays, HCV is becoming the first cause of primary liver cancer and is the main indication for liver transplantation in industrialized countries.1 The current standard treatment of chronic hepatitis C is a combination of pegylated interferon (IFN)-α and ribavirin.2 With this treatment, a sustained virological response, defined as an undetectable HCV RNA 24 weeks after the end of therapy, is achieved in approximately 40%-50% of patients infected with HCV genotype 1 and in 80% of those infected with genotypes 2 and 3.3-5
The hepatic fibrosis stage is the principal predictor of liver disease progression and drives treatment indications.2 Liver biopsy examination has traditionally been considered the reference method for staging liver fibrosis. It is recommended in recent Clinical Practice Guidelines for treatment decision in patients with chronic hepatitis C.2 However, the accuracy of liver biopsy has been questioned, as sampling errors and intra- and inter-observer variability may lead to under- or over-staging.6-9 In addition, liver biopsy is an invasive procedure with rare, but potentially life-threatening, complications.10-13 These limitations have stimulated the search for noninvasive approaches for liver disease severity assessment, including serological markers and methods based on ultrasonography, such as transient elastography.14-17
Transient elastography by means of the Fibroscan® (Echosens, Paris, France) measures liver stiffness. It can be performed at the bedside with immediate results and
3 4 5 6 7 8 9 10 11 12 13 14 15 16 17 18 19 20 21 22 23 24 25 26 27 28 29 30 31 32 33 34 35 36 37 38 39 40 41 42 43 44 45 46 47 48 49 50 51 52 53 54 55 56 57 58 59
For Peer Review
has been reported to be rapid, user-friendly and reproducible.18 Liver stiffness has been shown to correlate with the hepatic fibrosis stage and to have excellent accuracy for the diagnosis of cirrhosis in patients with chronic hepatitis C.19-22 Thus far, transient elastography has been used and validated essentially in cross-sectional studies, whereas the kinetics of liver stiffness in patients with chronic hepatitis C receiving antiviral therapy have not been characterized in prospective longitudinal studies.
The goal of this study was to prospectively assess the kinetics of liver stiffness in
patients with chronic hepatitis C treated with pegylated IFN-α and ribavirin and to compare them with the HCV RNA level kinetics on treatment and with the final outcome of therapy.
PATIENTS AND METHODS Patients
This multicentre, prospective study was conducted in 5 French hospitals between January 2005 and March 2007. One hundred and five patients with chronic hepatitis C, i.e. patients with chronically elevated serum alanineaminotransferase (ALT) levels and detectable serum anti-HCV antibodies and HCV RNA, were included. All of them were treatment-naïve and the main inclusion criterion was significant fibrosis, defined as liver stiffness >7.0 kilopascals (kPa) with the Fibroscan® at baseline.20 The exclusion criteria were: a coinfection with hepatitis B virus or human immunodeficiency virus, a daily alcohol intake >30 g, decompensated liver disease or hepatocellular carcinoma, liver transplantation, and a failed or unreliable liver stiffness measurement.23
3 4 5 6 7 8 9 10 11 12 13 14 15 16 17 18 19 20 21 22 23 24 25 26 27 28 29 30 31 32 33 34 35 36 37 38 39 40 41 42 43 44 45 46 47 48 49 50 51 52 53 54 55 56 57 58 59
For Peer Review
The study protocol conformed to the ethical guidelines of the 1975 Helsinski declaration and the French regulations on clinical trials, and was approved by the Institutional Review Board (Comité de Protection des Personnesd’Ile-de-France IX). The patients were enrolled after giving their written informed consent.
Antiviral therapy
The 105 patients received standard-of-care therapy with either pegylated IFN-α2a
(Pegasys®, Hoffman-La Roche, Basel, Switzerland), 180 µg once weekly, or pegylated IFN-α2b (PegIntron®, Schering-Plough, Kenilworth, New Jersey), 1.5 µg/kg once weekly, and ribavirin, 1.0-1.2 g/day according to body weight below or above 75 kg, respectively, in patients infected with genotypes 1 and 4, or 0.8 g/day in patients infected with HCV genotypes 2 and 3. Treatment duration was 48 weeks in patients infected with HCV genotypes 1 and 4 (with a stopping rule at week 12 if the HCV RNA decline was less than 2 Log10 international units (IU)/mL), and 24 weeks in patients infected with HCV
genotypes 2 and 3.
Monitoring schedule and definition of virological responses
ALT levels, HCV RNA levels and liver stiffness were evaluated at baseline, at weeks 4, 12, and 24 of therapy in all patients, at week 48 of therapy in patients infected with HCV genotypes 1 and 4, and 12 and 24 weeks after treatment withdrawal in all patients. On treatment, virological responses were defined as follows: rapid virological response (RVR): undetectable HCV RNA at week 4; early virological response (EVR): undetectable HCV RNA at week 12; end-of-treatment response (EOTR): undetectable
3 4 5 6 7 8 9 10 11 12 13 14 15 16 17 18 19 20 21 22 23 24 25 26 27 28 29 30 31 32 33 34 35 36 37 38 39 40 41 42 43 44 45 46 47 48 49 50 51 52 53 54 55 56 57 58 59
For Peer Review
HCV RNA at the end of treatment, i.e. week 24 or 48 in patients infected with HCV genotypes 2-3 and 1-4, respectively. The sustained virological response (SVR) was defined as an undetectable HCV RNA 24 weeks after the end of therapy.
HCV RNA level measurement
HCV RNA levels were measured centrally by means of the m2000SP/m2000RT
real-time PCR platform (Abbott Molecular, Des Plaines, Illinois), according to the manufacturer’s instructions. The assay has been shown to accurately quantify HCV RNA levels regardless of the HCV genotype.24 Its lower limit of detection is 12 IU/mL. Undetectable HCV RNA at the different time points was thus defined as an HCV RNA level <12 IU/mL.
Liver stiffness measurement
Liver stiffness measurements were performed with the FibroScan® device, as previously described.14 Ten validated measurements were performed for each patient. The success rate was calculated as the number of validated measurements divided by the total number of measurements. The results were expressed in kilopascals. The median value was considered representative of the elastic modulus of the liver. Only procedures with at least ten successful acquisitions, a success rate of at least 60% and an interquartile range (IQR) of less than 30% of the median value were considered reliable.18 Patients with baseline liver stiffness values above 13 kPa were considered to have cirrhosis.21Long-term improvement of liver stiffness was defined as a decrease of at least 30% of median values 6 months after treatment withdrawal relative to baseline, as the manufacturer allows fluctuations of 30% of the IQR relative to the median value.18
3 4 5 6 7 8 9 10 11 12 13 14 15 16 17 18 19 20 21 22 23 24 25 26 27 28 29 30 31 32 33 34 35 36 37 38 39 40 41 42 43 44 45 46 47 48 49 50 51 52 53 54 55 56 57 58 59
For Peer Review
Statistical analysis
Results are expressed as the mean ± 1 standard deviation for normally distributed variables (age, body mass index [BMI]) and as the median with IQR (1st and 3rd quartiles) for variables with asymmetric distribution (ALT, HCV RNA level and liver stiffness). Intra-group comparisons were made using Wilcoxon’s test for paired data. Categorical data were expressed as numbers and percentages, and compared by means of the Chi-square test or Fisher’s exact test where appropriate. The relationship between quantitative data was tested by linear regression analysis.
The factors associated with long-term improvement of liver stiffness were tested by univariate analysis (chi-square test, Mann and Whitney test). Variables with a p value
≤0.10 were then tested in a logistic regression model by a forward step-by-step procedure. Odds ratios (OR) and their 95 % confidence intervals (CI) were inferred from the model. A p value ≤0.05 was considered significant.
RESULTS
Patient characteristics and disposition
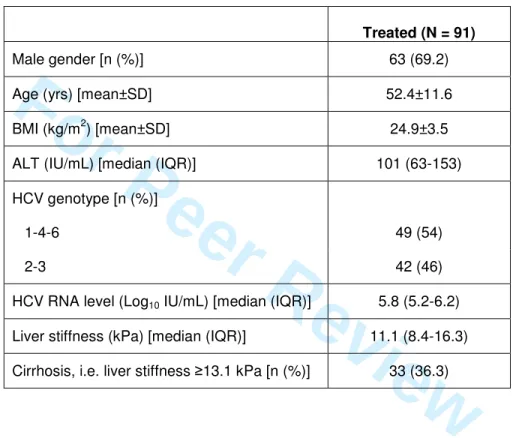
Among the 105 patients prospectively included in the study, 8 were lost to follow-up and an additional 6 patients did not complete follow-follow-up (more than 2 missing time points) and were excluded from the analysis. These 14 patients did not differ from the other treated patients for age, gender, BMI, frequency of cirrhosis, HCV genotype, and baseline HCV RNA level, ALT level, and liver stiffness.
3 4 5 6 7 8 9 10 11 12 13 14 15 16 17 18 19 20 21 22 23 24 25 26 27 28 29 30 31 32 33 34 35 36 37 38 39 40 41 42 43 44 45 46 47 48 49 50 51 52 53 54 55 56 57 58 59
For Peer Review
Overall, 91 treated patients were analyzed. There were 63 men and 28 women, and their mean age was 52.4±11.6 years. Their characteristics are shown in Table 1. Among the 91 patients, 2 were treated for 12 weeks only (one patient who did not achieve a 2-Log10 HCV RNA drop at week 12 and one who achieved an RVR and
stopped therapy at week 12); 47 patients infected with genotype 2 or 3 were treated for 24 weeks; and 42 patients infected with genotype 1, 4 or 6 were treated for 48 weeks. An RVR and an EVR were observed in 31 patients (34.1%) and 25 patients (27.5%), respectively. An SVR was observed in 59 patients (64.8%).
Median liver stiffness changes according to the virological response
Table 2 shows the median intra-patient changes in liver stiffness relative to baseline in the patients who achieved or did not achieve an SVR. No significant relationship was found between liver stiffness changes and the RVR, EVR or EOTR (data not shown). A significant liver stiffness decrease was observed during pegylated IFN-α and ribavirin administration in the patients who achieved an SVR, as well as in
non-sustained virological responders (median changes at the end of treatment relative to baseline: -2.0 kPa, p<0.001, and -2.9 kPa, p=0.02, respectively) (Figures 1A and 1B, Table 2). After treatment, liver stiffness continued to significantly decrease relative to end-of-treatment in the patients who achieved an SVR (median change: -0.7 kPa, p=0.008), resulting in a median intra-patient decrease relative to baseline at the end of follow-up of -3.4 kPa (p<0.001) (Figure 1B and Table 2). In contrast, in patients who did not achieve an SVR, liver stiffness increased after the end of treatment (median change: +0.8 kPa, p=0.59), resulting in a median intra-patient decrease of liver stiffness relative
3 4 5 6 7 8 9 10 11 12 13 14 15 16 17 18 19 20 21 22 23 24 25 26 27 28 29 30 31 32 33 34 35 36 37 38 39 40 41 42 43 44 45 46 47 48 49 50 51 52 53 54 55 56 57 58 59
For Peer Review
to baseline of -1.8 kPa (p=0.03) (Figure 1A and Table 2). However, as shown in Figure 2, in spite of the global trends, there were important differences in liver stiffness kinetics between individual patients.
Liver stiffness changes according to the virological response in cirrhotic patients
When cirrhotic and non-cirrhotic patients were considered separately, liver stiffness values were always significantly higher in the former than in the latter, but the same dynamics as in the global analysis were seen. They are presented in Table 3.
Liver stiffness changes according to ALT changes
No relationship was observed between liver stiffness and ALT changes during and after therapy, regardless of the virological outcome of treatment (data not shown).
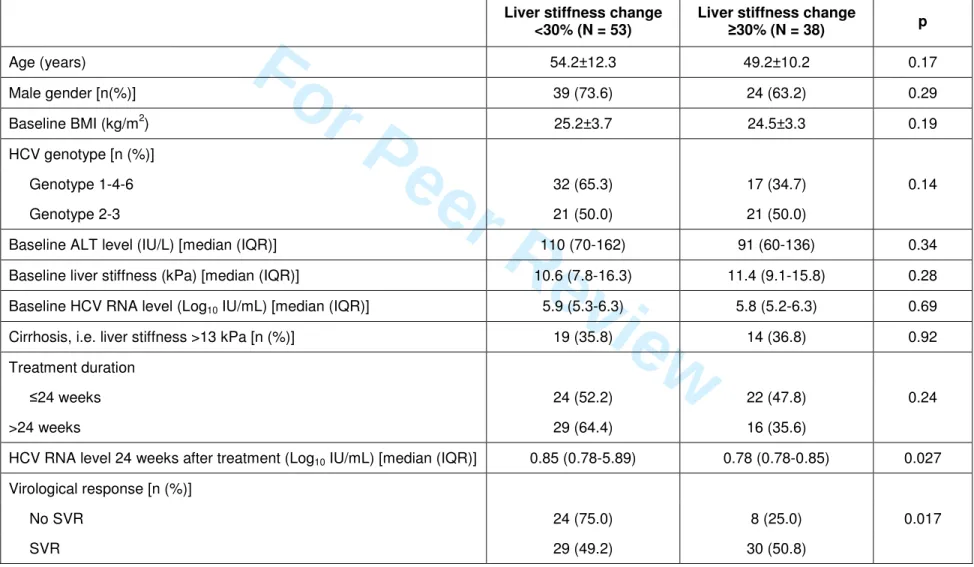
Variables associated with long-term improvement of liver stiffness
Long-term improvement of liver stiffness was defined as a decrease of median liver stiffness between baseline and end of follow-up of 30% or more. Long-term liver stiffness improvement was observed in 38 patients. Table 4 shows the factors that predicted liver stiffness improvement in univariate analysis. In multivariate analysis, only the SVR was associated with long-term improvement of liver stiffness, with an odds ratio of 3.10 (95% confidence interval: 1.20-8.02, p=0.019). DISCUSSION 3 4 5 6 7 8 9 10 11 12 13 14 15 16 17 18 19 20 21 22 23 24 25 26 27 28 29 30 31 32 33 34 35 36 37 38 39 40 41 42 43 44 45 46 47 48 49 50 51 52 53 54 55 56 57 58 59
For Peer Review
Successful therapy with IFN-α or pegylated IFN-α with or without ribavirinhas
been shown to be associated with significant histological improvements in studies in which patients underwent paired liver biopsies.25-29 However, follow-up liver biopsy is not part of the routine management of patients with chronic HCV infection receiving antiviral therapy.2 Therefore, non-invasive methods appear to be better suited to the monitoring of liver disease outcomes during and after therapy. Given its simplicity, high acceptability by patients and intrinsic performance.19-21, 30, 31 transient elastography is an appropriate tool for the longitudinal follow-up of fibrosis changes in treated HCV-infected patients, as shown in the present study.
In this multicentre study conducted in expert centres for transient elastography and HCV virology, we characterized the dynamics of liver stiffness in patients with significant fibrosis at baseline (defined as liver stiffness >7.0 kPa with the Fibroscan®) treated with pegylated IFN-α and ribavirin. Liver stiffness and HCV RNA kinetics were
assessed at multiple time points during and after therapy and compared. We observed that liver stiffness significantly decreased on treatment both in patients who did and did not achieve an SVR. However, liver stiffness continued to significantly decrease after the end of treatment only in patients who achieved an SVR. On treatment, no relationship was found with RVR, EVR or EOTR. Overall, both patients who achieved and those who did not achieve an SVR experienced a significant decrease of liver stiffness at the end of follow-up relative to baseline, but this decrease was greater in the sustained virological responders (p=0.11). These results are in keeping with a previous observation in patients who were assessed at the end of treatment and thereafter.32 The use of mean values for a non-normally distributed variable such as liver stiffness was however
3 4 5 6 7 8 9 10 11 12 13 14 15 16 17 18 19 20 21 22 23 24 25 26 27 28 29 30 31 32 33 34 35 36 37 38 39 40 41 42 43 44 45 46 47 48 49 50 51 52 53 54 55 56 57 58 59
For Peer Review
questionable in this study, as median values better reflect the distribution and extreme values. In another study,33 a significant liver stiffness decrease was reported at the end of follow-up in patients treated with pegylated IFN-α and ribavirin, regardless of the final virological outcome of therapy (SVR or non-SVR). No on-treatment monitoring was available, and liver stiffness at baseline significantly differed among the study groups. However, the latter was also the case in our study, with median values of 12 kPa (interquartile range, IQR: 9.6-24.7) in non-SVR vs 10 kPa (8.2-14.1) in SVR patients.
Overall, our prospectively generated data suggest that the cure of HCV infection is associated with a significant reduction of liver stiffness, as measured by transient elastography. This result may appear surprising as transient elastography is claimed to assess essentially the fibrotic component of liver lesions, while treatment has been mostly associated with reduction of the inflammatory reaction in the liver. Two non-mutually exclusive hypotheses can be raised to explain this result: (i) liver stiffness is also influenced by the local inflammatory reaction; (ii) fibrosis significantly regresses on treatment and thereafter in patients who achieve an SVR. The first hypothesis may appear unlikely as no relationship was observed between liver stiffness changes and ALT kinetics; however, ALT elevations do not always accurately reflect liver inflammation. On the other hand, SVR was the sole predictor of long-term liver stiffness improvement; nevertheless, SVR is also associated with an improvement of liver inflammation. Therefore, this hypothesis cannot be definitively ruled out. Indeed, others have reported an overestimation of liver stiffness in patients with liver inflammation reflected by high ALT levels.15, 34-37 In addition, a significant decrease of liver stiffness was observed during therapy, followed by an increase after treatment withdrawal, in the
3 4 5 6 7 8 9 10 11 12 13 14 15 16 17 18 19 20 21 22 23 24 25 26 27 28 29 30 31 32 33 34 35 36 37 38 39 40 41 42 43 44 45 46 47 48 49 50 51 52 53 54 55 56 57 58 59
For Peer Review
patients from this study who did not clear HCV infection. Histological data might have helped resolve this question. However, liver biopsy can no longer be performed during or after antiviral treatment for ethical reasons. Therefore, this question will remain unanswered.
Our hypothesis concerning liver stiffness changes in patients who achieved an SVR witnessing fibrosis regression is in keeping with the reported improvement of histological fibrosis in a similar population who underwent paired liver biopsies.25-29 It is also in keeping with the lower incidence of clinical outcomes, including liver failure, variceal bleeding or hepatocellular carcinoma, in patients with cirrhosis who achieved an SVR.38-41 However, although patients with cirrhosis who achieved an SVR experienced a significant improvement of their liver stiffness 6 months after the end of treatment in our study, their median liver stiffness values remained significantly higher than in patients without cirrhosis who achieved an SVR. In this context, the fact that the risk of developing HCC remains substantial in cirrhotic patients who achieved an SVR.26, 38, 40 is not surprising.
In conclusion, the results of this prospective, multicentre study show that transient elastography can be used to monitor liver stiffness changes during and after antiviral therapy in patients with chronic hepatitis C. On average, in patients with advanced fibrosis at the start of therapy (>7.0 kPa), liver stiffness is significantly reduced during pegylated IFN-α and ribavirin administration. The significant reduction of liver stiffness
continues off treatment only in patients who achieve an SVR. This probably denotes fibrosis regression, although it cannot be ruled out that improvements in the inflammatory reaction in these patients may also influence liver stiffness changes. These
3 4 5 6 7 8 9 10 11 12 13 14 15 16 17 18 19 20 21 22 23 24 25 26 27 28 29 30 31 32 33 34 35 36 37 38 39 40 41 42 43 44 45 46 47 48 49 50 51 52 53 54 55 56 57 58 59
For Peer Review
findings suggest that assessing liver stiffness by means of transient elastography at baseline and 6 months after treatment in patients who achieve an SVR is useful to assess the global response to antiviral therapy, establish a prognosis and serve as a basis for subsequent follow-up in patients with advanced fibrosis, especially those with cirrhosis. In the latter, post-treatment liver stiffness assessments should not be substituted to the recommended periodic surveillance of hepatocellular carcinoma
occurrence based on ultrasound examination and α-fetoprotein level measurement.42 Our data also suggest that liver stiffness assessment earlier than 6 months after the end of therapy is not clinically meaningful.
3 4 5 6 7 8 9 10 11 12 13 14 15 16 17 18 19 20 21 22 23 24 25 26 27 28 29 30 31 32 33 34 35 36 37 38 39 40 41 42 43 44 45 46 47 48 49 50 51 52 53 54 55 56 57 58 59
For Peer Review
REFERENCES
1. Thomas DL, Seeff LB. Natural history of hepatitis C. Clin Liver Dis 2005;9:383-98. 2. Ghany MG, Strader DB, Thomas DL, Seeff LB. Diagnosis, management, and
treatment of hepatitis C: an update. Hepatology 2009;49:1335-74.
3. Fried MW, Shiffman ML, Reddy KR, et al. Peginterferon alfa-2a plus ribavirin for chronic hepatitis C virus infection. N Engl J Med 2002;347:975-82.
4. Hadziyannis SJ, Sette H, Jr., Morgan TR, et al. Peginterferon-alpha2a and ribavirin combination therapy in chronic hepatitis C: a randomized study of treatment duration and ribavirin dose. Ann Intern Med 2004;140:346-55.
5. Manns MP, McHutchison JG, Gordon SC, et al. Peginterferon alfa-2b plus ribavirin compared with interferon alfa-2b plus ribavirin for initial treatment of chronic hepatitis C: a randomised trial. Lancet 2001;358:958-65.
6. Bedossa P, Dargère D, Paradis V. Sampling variability of liver fibrosis in chronic hepatitis C. Hepatology 2003;38:1449-57.
7. Maharaj B, Maharaj RJ, Leary WP, et al. Sampling variability and its influence on the diagnostic yield of percutaneous needle biopsy of the liver. Lancet 1986;i:523-5.
8. Regev A, Berho M, Jeffers LJ, et al. Sampling error and intraobserver variation in liver biopsy in patients with chronic HCV infection. Am J Gastroenterol 2002;97:2614-8.
9. Rousselet MC, Michalak S, Dupre F, et al. Sources of variability in histological scoring of chronic viral hepatitis. Hepatology 2005;41:257-64.
3 4 5 6 7 8 9 10 11 12 13 14 15 16 17 18 19 20 21 22 23 24 25 26 27 28 29 30 31 32 33 34 35 36 37 38 39 40 41 42 43 44 45 46 47 48 49 50 51 52 53 54 55 56 57 58 59
For Peer Review
10. Castera L, Negre I, Samii K, Buffet C. Pain experienced during percutaneous liver biopsy. Hepatology 1999;30:1529-30.
11. Cadranel JF, Rufat P, Degos F. Practices of liver biopsy in France: results of a prospective nationwide survey. Hepatology 2000;32:477-81.
12. Castera L, Negre I, Samii K, Buffet C. Patient-administered nitrous oxide/oxygen inhalation provides safe and effective analgesia for percutaneous liver biopsy: a randomized placebo-controlled trial. Am J Gastroenterol 2001;96:1553-7.
13. Bravo AA, Sheth SG, Chopra S. Liver biopsy. N Engl J Med 2001;344:495-500. 14. Sandrin L, Fourquet B, Hasquenoph JM, et al. Transient elastography: a new
noninvasive method for assessment of hepatic fibrosis. Ultrasound Med Biol 2003;29:1705-13.
15. Pinzani M, Vizzutti F, Arena U, Marra F. Technology Insight: noninvasive assessment of liver fibrosis by biochemical scores and elastography. Nat Clin Pract Gastroenterol Hepatol 2008;5:95-106.
16. Castera L. Transient elastography and other noninvasive tests to assess hepatic fibrosis in patients with viral hepatitis. J Viral Hepat 2009;16:300-314.
17. Castera L, Pinzani M. Non-invasive assessment of liver fibrosis: are we ready? Lancet 2010;375:1419-20.
18. Castera L, Forns X, Alberti A. Non-invasive evaluation of liver fibrosis using transient elastography. J Hepatol 2008;48:835-47.
19. Ziol M, Handra-Luca A, Kettaneh A, et al. Noninvasive assessment of liver fibrosis by measurement of stiffness in patients with chronic hepatitis C. Hepatology 2005;41:48-54. 3 4 5 6 7 8 9 10 11 12 13 14 15 16 17 18 19 20 21 22 23 24 25 26 27 28 29 30 31 32 33 34 35 36 37 38 39 40 41 42 43 44 45 46 47 48 49 50 51 52 53 54 55 56 57 58 59
For Peer Review
20. Castera L, Vergniol J, Foucher J, et al. Prospective comparison of transient elastography, Fibrotest, APRI, and liver biopsy for the assessment of fibrosis in chronic hepatitis C. Gastroenterology 2005;128:343-50.
21. Friedrich-Rust M, Ong MF, Martens S, et al. Performance of transient elastography for the staging of liver fibrosis: a meta-analysis. Gastroenterology 2008;134:960-74.
22. Castera L, Le Bail B, Roudot-Thoraval F, et al. Early detection in routine clinical practice of cirrhosis and oesophageal varices in chronic hepatitis C: comparison of transient elastography (FibroScan) with standard laboratory tests and non-invasive scores. J Hepatol 2009;50:59-68.
23. Castera L, Foucher J, Bernard PH, et al. Pitfalls of liver stiffness measurement: a 5-year prospective study of 13,369 examinations. Hepatology 2010;51:828-835. 24. Chevaliez S, Bouvier-Alias M, Pawlotsky JM. Performance of the Abbott real-time
PCR assay using m2000sp and m2000rt for hepatitis C virus RNA quantification. J Clin Microbiol 2009;47:1726-32.
25. Marcellin P, Boyer N, Gervais A, et al. Long-term histologic improvement and loss of detectable intrahepatic HCV RNA in patients with chronic hepatitis C and sustained response to interferon-alpha therapy. Ann Intern Med 1997;127:875-81. 26. Shiratori Y, Imazeki F, Moriyama M, et al. Histologic improvement of fibrosis in
patients with hepatitis C who have sustained response to interferon therapy. Ann Intern Med 2000;132:517-24.
27. Poynard T, McHutchison J, Manns M, et al. Impact of pegylated interferon alfa-2b and ribavirin on liver fibrosis in patients with chronic hepatitis C. Gastroenterology 2002;122:1303-13. 3 4 5 6 7 8 9 10 11 12 13 14 15 16 17 18 19 20 21 22 23 24 25 26 27 28 29 30 31 32 33 34 35 36 37 38 39 40 41 42 43 44 45 46 47 48 49 50 51 52 53 54 55 56 57 58 59
For Peer Review
28. Camma C, Di Bona D, Schepis F, et al. Effect of peginterferon alfa-2a on liver histology in chronic hepatitis C: a meta-analysis of individual patient data. Hepatology 2004;39:333-42.
29. Everson GT, Balart L, Lee SS, et al. Histological benefits of virological response to peginterferon alfa-2a monotherapy in patients with hepatitis C and advanced fibrosis or compensated cirrhosis. Aliment Pharmacol Ther 2008;27:542-51.
30. Fraquelli M, Rigamonti C, Casazza G, et al. Reproducibility of transient elastography in the evaluation of liver fibrosis in patients with chronic liver disease. Gut 2007;56:968-73.
31. Boursier J, Konate A, Gorea G, et al. Reproducibility of liver stiffness measurement by ultrasonographic elastometry. Clin Gastroenterol Hepatol 2008;6:1263-9.
32. Ogawa E, Furusyo N, Toyoda K, Takeoka H, Maeda S, Hayashi J. The longitudinal quantitative assessment by transient elastography of chronic hepatitis C patients treated with pegylated interferon alpha-2b and ribavirin. Antiviral Res 2009;83:127-34.
33. Vergniol J, Foucher J, Castera L, et al. Changes of non-invasive markers and FibroScan values during HCV treatment. J Viral Hepat 2009;16:132-40.
34. Coco B, Oliveri F, Maina AM, et al. Transient elastography: a new surrogate marker of liver fibrosis influenced by major changes of transaminases. J Viral Hepat 2007;14:360-9.
35. Arena U, Vizzutti F, Corti G, et al. Acute viral hepatitis increases liver stiffness values measured by transient elastography. Hepatology 2008;47:380-4.
3 4 5 6 7 8 9 10 11 12 13 14 15 16 17 18 19 20 21 22 23 24 25 26 27 28 29 30 31 32 33 34 35 36 37 38 39 40 41 42 43 44 45 46 47 48 49 50 51 52 53 54 55 56 57 58 59
For Peer Review
36. Oliveri F, Coco B, Ciccorossi P, et al. Liver stiffness in the hepatitis B virus carrier: a non-invasive marker of liver disease influenced by the pattern of transaminases. World J Gastroenterol 2008;14:6154-62.
37. Vizzutti F, Arena U, Romanelli RG, et al. Liver stiffness measurement predicts severe portal hypertension in patients with HCV-related cirrhosis. Hepatology 2007;45:1290-7.
38. Bruno S, Crosignani A, Facciotto C, et al. Sustained virologic response prevents the development of esophageal varices in compensated, Child-Pugh class A hepatitis C virus-induced cirrhosis. A 12-year prospective follow-up study. Hepatology 2010;51:2069-76.
39. Bruno S, Stroffolini T, Colombo M, et al. Sustained virological response to interferon-alpha is associated with improved outcome in HCV-related cirrhosis: a retrospective study. Hepatology 2007;45:579-87.
40. Mallet V, Gilgenkrantz H, Serpaggi J, et al. Brief communication: the relationship of regression of cirrhosis to outcome in chronic hepatitis C. Ann Intern Med 2008;149:399-403.
41. Veldt BJ, Heathcote EJ, Wedemeyer H, et al. Sustained virologic response and clinical outcomes in patients with chronic hepatitis C and advanced fibrosis. Ann Intern Med 2007;147:677-84.
42. Bruix J, Sherman M. Management of hepatocellular carcinoma. Hepatology 2005;42:1208-36. 3 4 5 6 7 8 9 10 11 12 13 14 15 16 17 18 19 20 21 22 23 24 25 26 27 28 29 30 31 32 33 34 35 36 37 38 39 40 41 42 43 44 45 46 47 48 49 50 51 52 53 54 55 56 57 58 59
For Peer Review
FIGURE LEGENDS
Figure 1. Median (IQR) intra-patient liver stiffness changes relative to baseline at different time points on treatment and after the end of therapy. (A) Patients who did not achieve an SVR. (B) Patients who achieved an SVR.
Figure 2. Individual liver stiffness changes during and after treatment in patients who did not achieve an SVR and in patients who achieved an SVR. EOT: end of treatment; EOF: end of follow-up. 3 4 5 6 7 8 9 10 11 12 13 14 15 16 17 18 19 20 21 22 23 24 25 26 27 28 29 30 31 32 33 34 35 36 37 38 39 40 41 42 43 44 45 46 47 48 49 50 51 52 53 54 55 56 57 58 59
For Peer Review
Table 1.Baseline characteristics of the 91 patients.
Treated (N = 91)
Male gender [n (%)] 63 (69.2) Age (yrs) [mean±SD] 52.4±11.6 BMI (kg/m2) [mean±SD] 24.9±3.5 ALT (IU/mL) [median (IQR)] 101 (63-153) HCV genotype [n (%)]
1-4-6 49 (54) 2-3 42 (46) HCV RNA level (Log10 IU/mL) [median (IQR)] 5.8 (5.2-6.2)
Liver stiffness (kPa) [median (IQR)] 11.1 (8.4-16.3) Cirrhosis, i.e. liver stiffness ≥13.1 kPa [n (%)] 33 (36.3)
3 4 5 6 7 8 9 10 11 12 13 14 15 16 17 18 19 20 21 22 23 24 25 26 27 28 29 30 31 32 33 34 35 36 37 38 39 40 41 42 43 44 45 46 47 48 49 50 51 52 53 54 55 56 57 58 59
For Peer Review
Table 2. Median (IQR) intra-patient liver stiffness changes relative to baseline on treatment and thereafter in patients who
did and did not achieve an SVR. Treatment duration was 24 weeks in patients infected with HCV genotype 2 or 3, 48
weeks in patients infected with HCV genotype 1, 4 or 6. P values are for intra-patient liver stiffness changes relative to
baseline. SVR (N = 59) No SVR (N = 32) Time point Liver stiffness change p Liver stiffness change p Week 4 -1.0 (-3.4 - +0.3) 0.001 -1.3 (-5.1 - +0.4) 0.01 Week 12 -2.2 (-4.0 - +0.2) <0.001 -1.1 (-3.8 - +0.2) 0.05 On treatment End of treatment -2.0 (-3.6 - +0.5) <0.001 -2.9 (-5.0 - -0.5) 0.02 Follow-up week 12 -2.4 (-4.2 - +1.0) <0.001 -1.4 (-3.6 - +1.1) 0.08 Post-treatment Follow-up week 24 -3.4 (-4.7 - -1.1) <0.001 -1.8 (-4.3 - +0.6) 0.03 3 4 5 6 7 8 9 10 11 12 13 14 15 16 17 18 19 20 21 22 23 24 25 26 27 28 29 30 31 32 33 34 35 36 37 38 39 40 41 42 43 44 45 46 47 48 49 50 51 52 53 54 55 56 57 58 59
For Peer Review
Table 3. Median (IQR) intra-patient liver stiffness changes relative to baseline in patients with or without cirrhosis who did
or did not achieve an SVR. Treatment duration was 24 weeks in patients infected with HCV genotype 2 or 3, 48 weeks in
patients infected with HCV genotype 1, 4 or 6. P values are for intra-patient liver stiffness changes relative to baseline.
Cirrhosis No cirrhosis Time point SVR (n=19) p No SVR (n=14) p SVR (n=40) p No SVR (n=18) p Week 4 -4.1 (-8.6 - 0) 0.019 -4.7 (-16.9 - -0.5) 0.01 -0.7 (-2.1 - +0.4) 0.024 -1.0 (-2.3- +1.4) 0.41 Week 12 -4.0 (-5.9 - +0.7) 0.025 -1.7 (-12.0 - +0.1) 0.035 -1.9 (-3.0 - -0.8) 0.001 -0.6 (-2.6- +1.9) 0.51 On treatment End of treatmenta -4.0 (-7.6 - +1.3) 0.059 -4.1 (-10.0 - -0.2) 0.07 -1.6 (-3.0 - +0.5) 0.001 -2.6 (-4.5- -0.8) 0.13 Follow-up week 12 -3.3 (-13.4 - +2.5) 0.20 -2.3 (-9.7 - +1.6) 0.25 -2.3 (-3.8 - -0.8) <0.001 -0.8 (-2.3- +1.2) 0.32 Post-treatment Follow-up week 24 -6.4 (-8.5 - -1.6) 0.001 -2.5 (-9.8 - +1.4) 0.14 -2.7 (-3.9 - -0.7) <0.001 -1.2 (-3.2- +0.7) 0.11 3 4 5 6 7 8 9 10 11 12 13 14 15 16 17 18 19 20 21 22 23 24 25 26 27 28 29 30 31 32 33 34 35 36 37 38 39 40 41 42 43 44 45 46 47 48 49 50 51 52 53 54 55 56 57 58 59
For Peer Review
Table 4.Univariate analysis of variables associated with long-term liver stiffness improvement, defined as a liver stiffness
decrease ≥30% relative to baseline 24 weeks after the end of therapy.
Liver stiffness change <30% (N = 53)
Liver stiffness change
≥30% (N = 38) p Age (years) 54.2±12.3 49.2±10.2 0.17 Male gender [n(%)] 39 (73.6) 24 (63.2) 0.29 Baseline BMI (kg/m2) 25.2±3.7 24.5±3.3 0.19 HCV genotype [n (%)] Genotype 1-4-6 32 (65.3) 17 (34.7) 0.14 Genotype 2-3 21 (50.0) 21 (50.0)
Baseline ALT level (IU/L) [median (IQR)] 110 (70-162) 91 (60-136) 0.34 Baseline liver stiffness (kPa) [median (IQR)] 10.6 (7.8-16.3) 11.4 (9.1-15.8) 0.28 Baseline HCV RNA level (Log10 IU/mL) [median (IQR)] 5.9 (5.3-6.3) 5.8 (5.2-6.3) 0.69
Cirrhosis, i.e. liver stiffness >13 kPa [n (%)] 19 (35.8) 14 (36.8) 0.92 Treatment duration
≤24 weeks 24 (52.2) 22 (47.8) 0.24 >24 weeks 29 (64.4) 16 (35.6)
HCV RNA level 24 weeks after treatment (Log10 IU/mL) [median (IQR)] 0.85 (0.78-5.89) 0.78 (0.78-0.85) 0.027
Virological response [n (%)] No SVR 24 (75.0) 8 (25.0) 0.017 SVR 29 (49.2) 30 (50.8) 3 4 5 6 7 8 9 10 11 12 13 14 15 16 17 18 19 20 21 22 23 24 25 26 27 28 29 30 31 32 33 34 35 36 37 38 39 40 41 42 43 44 45 46 47 48 49 50 51 52 53 54 55 56 57 58 59