HAL Id: hal-01576190
https://hal.archives-ouvertes.fr/hal-01576190
Submitted on 22 Aug 2017
HAL is a multi-disciplinary open access
archive for the deposit and dissemination of
sci-entific research documents, whether they are
pub-lished or not. The documents may come from
teaching and research institutions in France or
abroad, or from public or private research centers.
L’archive ouverte pluridisciplinaire HAL, est
destinée au dépôt et à la diffusion de documents
scientifiques de niveau recherche, publiés ou non,
émanant des établissements d’enseignement et de
recherche français ou étrangers, des laboratoires
publics ou privés.
INVESTIGATION ON THE PERFORMANCE AND
DURABILITY OF TREATED HEMP CONCRETE
WITH LINSEED OIL
C Sentenac, M Sonebi, S Amziane
To cite this version:
C Sentenac, M Sonebi, S Amziane. INVESTIGATION ON THE PERFORMANCE AND
DURA-BILITY OF TREATED HEMP CONCRETE WITH LINSEED OIL. 2nd International Conference
On Bio-Based Building Materials (ICBBM 2017), Sofiane AMZIANE And Mohammed SONEBI, Jun
2017, Clermont Ferrand, France. �hal-01576190�
EcoGRAFI
Second International Conference on Bio-based Building Materials
June 21nd - 23th 2017 Clermont-Ferrand, France
INVESTIGATION ON THE PERFORMANCE AND DURABILITY OF
TREATED HEMP CONCRETE WITH LINSEED OIL
C. Sentenac1,2, M. Sonebi1*, S. Amziane2
1 Queen’s University Belfast, School of Natural and Built Environment., Belfast, BT7 1NN, UK 2
Université Blaise Pascal, Institut Pascal, Polytech Clermont-Ferrand, 63174, Aubière, France *Corresponding author; e-mail: m.sonebi@qub.ac.uk
Abstract
Given the low mechanical strength, hemp concrete cannot therefore be used as a load bearing material. Hemp concrete principal weakness point is the strength but the lack of information concerning the durability performance of this material can also be an explanation for the professional’s reluctance to use bio-based concrete.
This study focused on the effects of aggregate treatments, linseed oil and two different binders. The mechanicals performance such as the compressive strength at 7, 14 and 28 days were done. The results shows that with higher density treated samples get a higher strength in compression.. Then hydraulic performance was tested with the capillarity test and highlighted the great decrease of sorption coefficient on treated samples. Finally the durability performance tests included the full water immersion test, and the carbonation test in accelerated chamber. Weathering results are better for treated sample compared to none-treated, which are less absorbent and less destructive for specimens. Treated samples carbonated quicker than no treated ones.
Keywords:
Aggregates treatment, Hemp shiv, Durability, Linseed Oil, Mechanical performances, Water absorption
1 INTRODUCTION
Hemp concrete principal weakness point is the strength in compression but the lack of information concerning the durability performance of this material can also be an explanation for the professional’s reluctance to use bio-based concrete [Amziane 2016]. These ten last years have conducted several studies on hemp concrete to improve its properties this included the binders effect on mechanical strength [Lawrence 2007], [Pavia 2014] [Amziane 2016] but also the compaction effects [Nguyen 2009] [Sonebi 2013]. Matrix additions and aggregates treatments were also conducted to improve hemp concrete performances [Magniont 2010], [Nozahic 2012]. The durability and cure conditions stay the less studying properties [Chabannes 2015], {Sonebi 2015], [Castel 2016], [Amziane 2016] but this lack of information can be an explanation for the professional’s reluctance to use bio-based concrete.
The selected factors considered in our study to be investigated were the effects of aggregates treatment: linseed oil (LO). Few studies have already been conducted on this treatment [Khazma 2011], [Nozahic 2012] but in our case hemp concrete has been made
with two different binders: Cement Vicat (V) and a composite binder based on calcic lime (C). The mix composition for this study was similar for all mixes and each treated aggregates type was compared to a normal hemp (NH) concrete sample for every performance. In total, four mixes were investigated:
- LOV : Vicat binder with linseed oil treatment on hemp shiv
- NHV : Vicat binder with normal hemp shiv - LOC : Calcic lime binder and additions with linseed oil treatment on hemp shiv
- NHC : Calcic lime binder and additions with normal hemp shiv
2 MATERIALS, MIX PROPORTIONS AND
METHODS
2.1. Raw materials Natural particles
Hemp shiv was used for this work. Hemp shiv used in the experimental program was Yorkshire hemp in UK. It is a hemp aggregate made from the inner woody core of the hemp plant’s stem. Hemp is chopped,
ICBBM & ECOGRAFI 2017
graded and de-dusted to give a natural, sound and breathable product. This type of boon is compatible with lime-based binders and is marketed for individual housing construction in hemp concrete.
Mineral binders
This investigation used two different binders:
The first binder used in this study was Vicat Cement which had an NF: P15-314 (natural prompt cement) and NF P15-317 (offshore work).
This binder has been chosen for its great properties of setting and hardening, this cement showed a highly hydraulic binder, contrary to ordinary cement.
The chemical composition is the originality of Vicat Cement even if it is very close to the Portland Clinker composition. Clay proportion is about 22% to 35%.The second binder is a hydraulic lime (75%) mixed with fly ash (15%) and cement Portland (10%). This composite binder was chosen to be compare to Vicat cement, calcic lime is very crumbly by is one so fly ash and cement Portland can improve the hardening.
Treatment
Linseed oil is used in this study to cover particles and disable water absorption. Linseed oil is yellow oil obtained from the dried, ripened seeds of the flax plant. Linseed oil is a drying oil; meaning it can polymerize into a solid form. Because of polymerisation it takes time to dry, therefore after mixing it with aggregates we will plan to wait 20 days of dry.
2.2. Test methods
2.2. 1 Mix design
According to the French professional rules for hemp concrete structures, Construire en Chanvre [Construire 2012], and also Amziane and Arnaud dosages based on experience [Amazine 2013] shuttered wall mix composition was tested in this investigation.
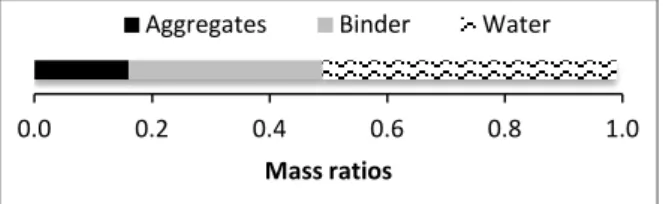
The proposed mix proportions are based on the ratios presented in Fig. 1. These ratios are used for each mixture presented previously: LOV, NHV, LOC and NHC.
Fig. 1 : Ratios used in mixtures
2.2. 2 Particle size distribution
There are two ways to carry out the particle size distribution:
Mechanical sieving
A horizontal circular motion has been used and a vertical motion is created by a tapping impulse. The vibration process needs more time for vegetal particles than minerals aggregates because of their elongated shape
The minimum time of vibration should then be 30 minutes, however the vibration frequency does not influence the results. According to the literature, hemp shiv obtained by mechanical sieving method was not exact because there were many hemp particles
passing through a given sieve that had length much larger that the sieve aperture. This is caused by particles form much longer than larger [Kashtanjeva 2015].
Image analysis
This method consisted to scan the particles of hemp shiv and use the picture in software Images Analysis in order to calculate different parameters (diameter, area etc.) [Amziane 2017]. This method was very accurate but it took a long time to carry out the experiments.
2.2.3 Water absorption of particles
Water absorption test is particularly interested in our case to compare treatments effects on particles water absorption.
According to working group RILEM TC 236 “Bio aggregates based buildings materials” experimental protocol for measuring the water absorption of vegetable aggregates tests have to be done three times on each specimen.
2.2.4 Bulk density
The bulk density of hemp shiv is linked to the porosity of the particles and to the inter-particular porosity. The results are close to each other and give a bulk density value of 112kg/m3 (6.7kg/m3 deviation).
The bulk density of hemp shiv was the mean value of the measurements made on three different samples. The RILEM technical committee protocol involves measuring the weight and volume of a sample of bulk bio-aggregates to deduce the density.
2.2.5 Linseed oil treatment process
According to different studies reported by Nozahic, Amziane [Nozahic 2012], the linseed oil (LO) quantity was evaluated by 0.5 mass ratios with aggregates. The process used is summarized as follow:
1) Weight 100g of dry hemp shiv
2) Put the sample in the mixer bowl and add 50g of linseed oil
3) Mix the mix until all particles colour change, that means linseed oil is widespread on all particles 4) Keep the mix in a tray and wait 20 days for
complete drying, do not forget to mix the sample every days if it is possible to ensure the homogenous of drying process
Repeat the stage 1 to 3 until the particle quantity is obtained [Nozahic 2012].
2.3. Mix procedure, casting and curing conditions
In the total, four mixes were prepared in the laboratory using a mixer. The materials of mixing include hemp shiv, binders, and water. The mixing procedure is listed below:
1) Firstly, wipe the mixing bowl with wet tissue to moist the surface prior to mixing.
2) Then introduce the hemp shiv in the recipient and add progressively ¾ of the water quantity during the mixing (2min30s)
3) After the binder is added and mix during 30sec with the hemp wet
4) Finally the rest of water is added and mix during 2min to get hemp concrete.
5) The samples were mixed in total of 5 minutes. 0.0 0.2 0.4 0.6 0.8 1.0
Mass ratios
6) The mix can be put in the different moulds, it have to be done carefully in three layers and each layers is compacted with 25 strokes distribute homogenously on the layer.
7) In order to prevent from excessive loss of water due to evaporation, the specimens in the mould was covered with plastic cling. Lastly, once the casting is done the specimens are stored in the control room of 2 2 C and its relative humidity is about 55 to 65%. Demoulding is carried out after 3 days of casting.
The concrete was poured in the different moulds (50 x 50 x 50 mm, 50 x 50 x 200 mm or 100 x 100 x 100 mm) and compacted in three layers by using a steel manual device (Fig. 2). The height of a single layer is equal to one-third of the total height of the concrete specimen (50 or 100 mm). The first and second layers have been scratched to obtain a good grip surface for the next layer. Specimens were demoulded after 48 h and stored in a climate-controlled room at 20°C and 60%RH.
Fig. 2: Compaction process [Page 2015]. 2.4. Test procedures
2.4.1. Compressive strength testing
The compressive strength was determined by crushing three cubes of 50 mm size, by using an electromechanical testing machine (Zwick). Displacement control tests were conducted with a loading rate of 3 mm/min.
2.4.2. Capillarity absorption test
Capillary absorption is used as an indicator of the degradation of building material. It is defined as residual spaces occupied by original kneading water and capillary coefficient in cementitious and depends upon the water/binder ratio. In our case this ratio is the same so this test will enable us to compare the real effects of treatments on aggregates.
The test method consists in expose only one face of the sample to the water to determine the rate of absorption of water by the hemp concrete.
Capillary absorption is made on 100*100*100mm cube specimens, which are tested at 14, 28 and 60 days after manufacture. During this curing time samples are placed in a control room at 20°C of temperature and e relative humidity of 55%.
The protocol of capillarity test is presented as follow: 1) Samples are prepared by applying one
waterproof tape around the circumference of the future expose face it enables water to be absorb only by one face of the sample.
2) Two steel bars with the same diameter are placed in a plastic tray, then the sample is put on these bar with the face exposed to water downwards. It also enables water to be absorbed by this unique face.
3) Then the tray is filled with water until cubes are immersed in a constant level of water: 8mm.
4) After that cubes are weight at different timing 1min, 2min, 3min, 5min, 15 min, 30 min, 1h, 2h, 3h and 5h. The mass allowed determining the quantity of water absorbed throughout the test.
2.4.3. Weathering test
Basically, this test is used to measure the volume and weight change of the hemp concrete under several drying and wetting cycles. It enables to simulate the weather conditions, at the end of all the cycles the influence of these cycles on the strength in compression is measured.
Full immersion test
Samples used in this case are 100mm cubes, four samples for each mixed are needed: two in the air and two for weathering cycles. The protocol used is describes as follow:
1) After 3 days of casting, the specimens are removed from the mould and cured in the control temperature room for 28 days.
2) Firstly, the test procedure was to place the weathering cubes in ventilated oven to dry at 40°C for 48 hours, the others samples stay in the air.
3) Then, the mass was measured after 48 hours (drying state) and the specimens were placed in water bath for another 48 hours. The specimens are fully immersed in a room temperature of 20°C.
4) Basically, the drying and wetting masses of specimen are measured after 48 hours of the one cycle.
2.4.4. Carbonation
Carbonation is a progressive reaction beginning at the surface of the concrete and penetrating deeper into it with time due to carbon dioxide diffusing into the concrete. The carbonation front within the concrete can be defined as one, which advances with time.
In our case the difference between samples with accelerated carbonation and sample in the air is investigated.
Twenty days after removing samples out of the mould and curing in a temperature of 20°C and relative humidity of 55%, they are weight and the half is put in the oven. Two size of sample is used, 50mm cubes and 100mm cubes. The carbonation process consist in measured the carbonation stage of each sample after different times.
For 50mm cubes carbonation propagation has been measured after 3, 6 and 9 weeks using 4 samples of each mix at each time. For 100mm cubes the phenolphthalein test has been done after 6weeks in the chamber.
The chamber used had a controllable internal environment in terms of temperature, relative humidity and carbon dioxide concentration. The environment was set to a temperate of 20°C (±1°C), relative humidity of 65% (±1°C) and a concentration of CO2 of
5% (±0.5°C).
After completion of carbonation period each specimen was split and the fractured face sprayed with a 1% phenolphthalein in methylated spirit from Davidson & Hardy.
As traditionally the spraying identification is used on a freshly fractured concrete surface with phenolphthalein indicator dissolved in alcohol. It results in a colour change at a pH of approximately 9 (±0.5). The
ICBBM & ECOGRAFI 2017
phenolphthalein halfway stage occurs for a pH about 9 (±0.5). The region appears unstained when pH is under 9 (±0.5) whereas it is stained in pink when pH is beyond 9 (±0.5).
3 RESULTS AND DISCUSSION
3. 1 Characterization
3.1.1. Water absorption of particles
In this part the water absorption was measured on normal hemp shiv (NH) and treated hemp shiv with linseed oil (LO). Fig. 3 presents the the variation of water absorption.
Fig. 3 : Water absorption of particles in function of time
After 1 min of immersion the LO treatment is effective with 133% of water absorption compare to NH aggregates with 204%. After 48 hours the result is the same LO is less absorbent than NH with respectively 255% and 410%.
Water absorption of bio-aggregates is a recurrent problem. The water absorbed by the particles is not available for the binder hydration this is the reason why this investigation is based on aggregates treatments. LO treatment is not just a coating, the treatment enter with polymerisation into the particle and, with this mass addition it blocks particles pore, which avoid water to enter inside the particle.
3.1.2. Bulk density
The bulk density on treated hemp shiv and normal hemp shiv were measured to compare the weight added or not on our samples. Following the process described on previous chapter we have measured the bulk density of three samples for each type of hemp. An average can enable us at the end to obtain the bulk density.
The bulk density obtained for normal hemp was around 100.9 kg/m3, with a standard deviation of 4.1 kg/m3. Our results are lower than literature results, the usual value is around 110kg/m3, these results can be explain by the important quantity of fibres contained in the hemp shiv of this study as we saw previously in the particles size analysis.
As for the LO treatment results are significant, the bulk density obtained is almost the double of the normal hemp shiv one with 186.4 kg/m3. The standard deviation in this case is 9.1 kg/m3.
Results reveal the mass added on aggregates with LO treatment, this property has been significant for all the following results obtained. The density of specimens has been link to hemp shiv properties on every stage of the project.
3. 2 Treatment effects
3.2.1. Compression test
Density
Before every test all the samples are weight and the density is measured. Fig. 4 shows the density value for each mix at each test time, respectively 7 days (7d), 14 days (14d) and 28 days (28d). In every mix of each binder the density has been reduced with time. This loss of mass is important for the rest of the results and might affect compressive strength. The less consequential reduction is observed on NHC mix with: 374kg/m3 at 7d and 335kg/m3 at 28d (namely 39 kg/m3 of loss).
Fig. 4 follow highlights the fact that all mixes with Vicat have a largest density than mix with calcic lime. For example at 28d the difference in percentage represents 9% for NH and 13% for LO between Calcic mix and Vicat mix.
LO mixes have the higher density at each time compare to NH mixes, which are quite similar. All these observations have to be taken into account for compression strength comparison.
Fig. 4 : Samples density before compressive test
Compression strength at 5% of deformation
Fig 5 shows the strength in compression of every mix at three different times: 7 days (7d), 14 days (14d) and 28 days (28d). In every graph curves of samples with mixed lime are represented in dotted line and Vicat ones with continue line. The first one represents the compression strength at 5% of deformation (2.5mm in case of 50mm cubes) with one curve per mix and the second graph is a columns representation of the same results. Compressive solicitation on hemp concrete can increase as infinity way but the mechanical solicitation range is between 0% and 5% of deformation, it represents the limit of service [Nozahic 2 012].
Fig. 5 : Compressive strength at 5% of deformation
At 7 days, the young age, LO mixes have the higher strength in compression. At 28 days it is NHV mix which get the highest strength in compression about
-800 -600 -400 -200 0 200 400 600 800 7d 14d 28d 7d 14d 28d Sp e ci fi c m as s γ( kg /m 3 ) NHV NHC LOV LOC 0 0,05 0,1 0,15 0,2 0,25 NHC NHV LOC LOV fc '( 5 % ) (M P a) 7d 14d 28d
0.210 MPa the LOV and LOC mixes are just after with respectively 0.165 MPa and 0.200 MPa. Then NHC follows with 0.140 MPa.
The graph highlights the fact that at 5% of deformation NHV have the highest strength in compression following by LO mixes. WR mixes are the lowest values with NHC. On the other hand LO treatment enables hemp concrete to be stronger in case of mixed lime but for Vicat cement LOV is 5% lower than NHV. This is not the 30%-70% difference expected according to Nozahic results [Nozahic 2012] on aggregates treatment with aerial lime as binder. This Figure shows also that the strength at fourteen days is not very necessary at 5% of deformation because it is close to 28d results.
Development of compressive strength
If the strength at 28d is considerate as 100% in our case, the graph as follow highlights the percentage at 7d and 14d. At 7d the strength for Vicat mix is around 40% and for Calcic lime it is more about 50%. In the same case at 14d for every mix the strength is between 80% and 90% except for NHC mix (75%). This part concluded on the fact that the compression strength at 14 days is not essential, the most important values stay at 7d and 28d.
Fig. 6 : Variation of compressive strength with ages
3.2.2. Capillary absorption
After the water absorption test on particles, capillarity of samples has been measured at 28 days. Like in every test every mix was tested to see the effect of treatment on this property and compare with a non-treated sample. The process used has been presented previously.
Results have been presented in two ways. Firstly the evolution with time of water absorption in mass percentage has been plotted (Fig. 7). Secondly as the test enable the water to enter only by on face, the water absorption in kilograms per square meter has been calculated. Then it is plotted in function of square time and the trend curves can be traced (Fig. 8). The sorption coefficient has been obtained after 5 hours of immersion thanks to this last graph.
Fig. 7 : Water absorption during capillarity test at 28 d
The water absorption increase directly after the first immersion and the value is about 16.8% for NHV while NHC stay stable with 11.46%. After 28 days the two treatments have been effective. The rate for LO mixes is 10 times lower than NH mixes with 1.93% for LOC and 1.37% for LOV (Fig. 7).
After 5 hours, at the end of the test the rate keep increase for NH mixes with 27.28% for NHC and 31.68% for NHV. It stays quite stable for treated ones between 3% and 8%. The more effective treatment is the LO with Calcic lime as binder, LOC get 3.70% it is still ten times lower than NH mixes. Other mixes gets also a good rate, LOV is around 5.92%.
The curves obtained highlights the sorption coefficient. Values have been plot with the water absorption in kilograms per square meter in function of square time (Fig. 8). Therefore, the sorption coefficient has been calculated with the trend curves.
NH mixes sorption coefficient varied between 3.62 for NHV to 3.70 for NHC, it is still almost the double compare to treated samples which varied between 0.54 and 1.75. The LO treatment is divided in function of binder with 1.75 for LOV and 0.54 for LOC, but even if it is less effective LOV is two times less absorbent than NH.
Fig. 8 : Variation of water absorbed per square meter in function of square time
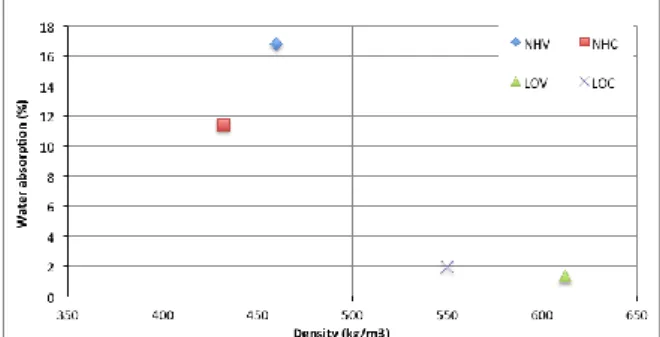
With the water absorption capacity in percentage plotted in function of samples density the results observed are quite the same as previously in 14d (Fig. 9). This time NHV is the more absorbent mix with 16.8%, the NHC with a density also around 450kg/m3 is less absorbent with a rate of 11.46%. These results according to the literature are not expected, normally when the density increase the water absorb decrease, because the porosity is supposed to decrease. The density of LO samples is the highest one 550 kg/m3 for LOC and 612 kg/m3 for LOV, the water absorption rate is the lower one, around 2%.
Fig. 9 : Water absorption percentage in function of samples density 7 d 7 d 7d 7d 1 4 d 14d 14 d 1 4 d 2 8 d 2 8 d 2 8 d 2 8 d 0 10 20 30 40 50 60 70 80 90 100 NHC NHV LOC LOV C o m p re ss iv e st re n gt h (% )
ICBBM & ECOGRAFI 2017
3.2.3 Weathering test
Weathering tests have been conducted with 48 hours cycles of wetting and drying in the oven but sometimes cycles has lasted 72 hours because of the laboratory availability (on weekend).
3.2.3.1 Full immersion test
The full immersion test is the result of 12 to 15 cycles depending on mixes. The following graph (Fig. 10) shows that, NHC is the more absorbent mix all along the test and in the opposite LOC is the less absorbent mix over the test duration. NH mixes mixed lime binder is more absorbent than Vicat cement. LO stayed the less absorbent mixes on average LO mixes are two times less absorbent than NH mixes
Fig. 10 : Mass evolution during drying/wetting cycles of weathering test with full immersion
The graphs in Fig. 11 highlight the fact that the mass variation was quite stable after 4 cycles during the test.
Fig. 11 : Mass evolution during wetting cycles of weathering test with full immersion
Fig. 12 enable to compare the percentages of water absorption after 12 cycles of wetting/drying. It highlights the fact that NHC is the more absorbent mix with 121% following by NHV with 107%. In another part LO mixes are the less absorbent mixes with 59% for LOV and LOC get just 47%.
Fig. 12 : Water absorption rate after 12 cycles
It can also be noticed that the rate obtained after 12 cycle for the NHV is quite the same as the one obtained by Castel et al. with the same mix (Mix A’) around 110% [Castel 2016].
3.2.3.2. Compression strength of weathering and no-weathering samples
As the two different immersions have not been conducted in the same time, the duration is not the same at the end and the results for the compressive strength cannot be compared. So the following parts will present in the first time the compression strength for full immersion. On each part weathering samples have been compared to no weathering samples.
Full immersion test in compression after 12 and 15 cycles
Compressive strength in this part has been conducted after 12 cycles for LO mixes and 15 cycles for NH mixes. The following graphs on Figs. 13 and 14 present the difference of compressive strength between NW and FW samples. As expected FW samples get a lower strength than NW ones, the first graph presents compressive strength results and the second represents the difference in percentage between NW and FW samples.
Fig. 13 : Compressive strength evolution of NW and FW samples in every condition at 5% of deformation
Fig. 14 : Compressive strength percentage comparison between NW and FW samples at 5% of deformation
The higher difference is for the NH mixes with 70%, indeed NHV-NW samples get the highest strength in compression but also the highest difference between the two conditions. In this case it can be considered as the most fragile sample or the most affected by weathering test as it has been seen in the previous part NHV mix is also one of the most absorbent mix. LO is more about 45% but it has to be notice that the compressive strength of LO mixes is the highest one for weathering samples. It is certainly link to the fact that LO mixes have received 3 cycles less than NH.
Following Castel et al. research [Castel 2016] the strength in compression for NHV mix (Mix A’ in his case) the compressive strength for NW is around 0.22MPa and 0.12MPa for FW. In our case we get a slightly higher compressive strength for NW samples with 0.26MPa and in the opposite we get a smaller value for FW samples with 0.083 MPa. This 20-30% is not negligible, therefore even if we have close results for water absorption rate the comparison can change in function of the test conducted.
As the compressive test was conducted after 8 weeks of duration no comparison can be made with full immersion one on the compressive strength. All the same, it can be observed that more a mix is absorbent more important the difference is between weathering and no weathering sample in case of compressive strength
3.2.4. Carbonation test
Phenolphthalein spraying
Before spraying samples with phenolphthalein lotion, samples were previously cut in the middle.
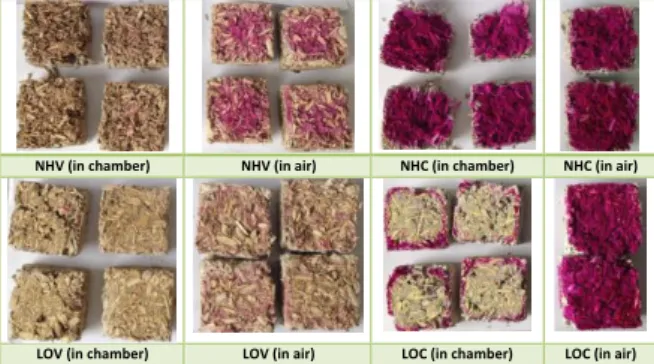
Phenolphthalein test has been done after six and nine weeks of carbonation cure, results are presented in the Figs. 25 and 26. The thickness of carbonation stage cannot be measured in this case, just visual observation can be made.
All mixes with Vicat, which have stayed in the carbonation chamber look totally carbonated. The difference can be observed for mixes, which stay in the air, they are not totally carbonated apart LOV mix. This observation highlights the fact that chamber cure has increased the carbonation phenomenon.
On the other hand for mixed lime the section is almost entirely pink, in case of NH mixes, therefore mixed lime has not been carbonated at this stage. Otherwise LOC mix appears also carbonated for the samples, which have stayed in the chamber, in this case the porosity is important to take into account. Even if the edges of LOC samples, which have stayed in the air look not totally carbonated it is because of the cutting process. The circular saw might have caused this observation some particles or binder powder of no carbonated samples might have been exchange during the cutting. Actually, LO mixes are less porous than others mixes this is one of the reason why mixed lime in these mixes is more carbonated than in NH mixes. The low porosity enable also for LOV mix to be totally carbonated in the two different environments after 6 weeks.
Fig. 15 : 50mm cubes samples after phenolphthalein spray at 6 weeks of curing
Fig. 16 : 50mm cubes samples after phenolphthalein spray at 9 weeks of curing
These tests at two different times highlight the fact that carbonation phenomenon is very slow. Even after nine weeks of cure some samples stay totally uncarbonated. The carbonation chamber enables the binder to carbonate faster but it still slow for NHC mix. This mix is very porous and very crumbly compare to LO mix. As the aggregates have absorb a large quantity of water there is not enough water at the end to react with binder. Therefore a powder appears when the samples are cut.
Results can also be compared to Chabannes study [Chabannes 2015], in his study hemp concrete with lime are not carbonated at all for the samples, which stayed in the air even after 10 months. It has to be noticed that Chabannes has chosen to mix 50% hydraulic lime and 50% aerial lime. The samples which have stayed in the accelerated chamber are partially carbonated in his case. In our study the fact that calcic lime was mixed with cement and fly ash enables samples to be carbonated more efficiently, notably for LOC one
These tests highlight also the fact that 50mm cubes are not the best size to measure carbonation on samples because the depth cannot be measured. Samples are totally carbonated or not carbonated at all there is no middle stage of reaction or at least it is not visible with naked eye.
Therefore another phenolphthalein test at 6 weeks has been done on 100mm cubes pictures after reaction are resumed on Fig. 17.
Fig. 17 : 100mm cubes samples after phenolphthalein spray at 6 weeks of curing
As expected and noted previously, chamber environment enable the acceleration of carbonation phenomenon. Otherwise NHC look opposite of this conclusion indeed, the depth of NHC samples which have stayed in the air is higher than the depth of samples which have stayed in the chamber. This
NHV (in chamber) NHV (in air) NHC (in chamber) NHC (in air)
LOV (in chamber) LOV (in air) LOC (in chamber) LOC (in air)
NHV (in chamber) NHV (in air) NHC (in chamber) NHC (in air)
LOV (in chamber) LOV (in air) LOC (in chamber) LOC (in air)
NHV (in chamber) NHV (in air) NHC (in chamber) NHC (in air)
Depth : 0 mm Depth : 17 mm Depth : 5.5 mm Depth : 9.8 mm
LOV (in chamber) LOV (in air) LOC (in chamber) LOC (in air)
ICBBM & ECOGRAFI 2017
difference has to be verify with TGA test but it might be because of the samples density. NHC sample which have stayed in the air looks denser than the one who stay in the chamber.
These results confirm observations made previously, on others samples the difference between air and chamber environment is visible. It can be notice that Vicat mixes are more carbonated than mixed lime mixes.
LO treatment has enabled the acceleration of carbonation phenomenon certainly because of the samples density.
Compressive strength after 9 weeks
Two representations resume the results of compressive test at 5 % of deformation for 9 weeks samples. Apart for NHC mix, the carbonation chamber environment has increased the strength of samples as it can be seen on Fig. 18.
The second graph represents the relation between air and chamber samples (Fig. 19). For LO the chamber multiplies per two the strength in compression, for NHV it is more about 1.5.
NHC get the lowest strength in compression but according to the previous part they have also got the lowest carbonation stage. More a sample is carbonated more it is strong. NHV obtained a slightly higher strength, which is link to the carbonation stage also because these two mixes are a little bit more carbonated than the previous two.
Finally the higher strength is obtained with LO mixes, which are the more carbonated one but also the denser ones
Fig. 18: Compressive strength comparison between samples stayed in the air and in the chamber after 5%
of deformation
Fig. 19: Coefficient of the relation between air and chamber samples after compressive test at 9 weeks
4 CONCLUSION
Different kinds of test have been carried out during this investigation on four mixes composed of two binders and linseed oil (LO) treatment. These experiences have enable us to better understand the effects of aggregates treatment on different properties.
Firstly the characterisation of hemp shiv particles have highlighted the fact that the LO treatment doubled the density of the aggregates. LO demonstrated a significant decrease of the water absorption of particles (reduce by twice).
Subsequently, the compressive strength of hemp concrete made with LO has been improved compared to the no-treated concrete.
In general, the sorption coefficient of hemp concrete has been divided by two with the both treatments.
The weathering has been carried out in full immersion in water. Full immersion has shown that treatments significantly decreased the water absorption during cycles. Treatments led to a smaller difference in compressive strength between weathering and no weathering samples.
Finally the carbonation test was conducted on small (50mm cubes) and large specimens (100mm cubes). Phenolphthalein results after 6 and 9 weeks show that Vicat binder was totally carbonated compared to mixed lime. To remain, the fact that calcic lime was mixed (with fly ash and Portland cement) has definitely increased the phenomenon compared to what was reported in literature [Chabannes 2015].
5 REFERENCES
[Amziane 2016] Amziane, S., Sonebi, M., Overview
on Biobased Building Material made with plant Aggregate, RILEM Technical Letters, 1, 2016,
31-38.
[Amziane 2015] Amziane, S., Sonebi, M., Proceedings of the First International Conference on “Bio-Based Building Materials”, ICBBM-2-15, Proceedings PRO 99, Ed. Amziane, S., Sonebi, M., 2015, RILEM Publications s.a.r.l., 746p.
[Amziane 2017] Amziane S., Collet F., Round Robin Test for hemp shiv characterisation: Part 2, bulk density and particle size distribution, Springer Edition, Edited by S. Amziane, 2017.
[Amziane 2003] Amziane, S., Arnaud L,
Bio-aggregate-based Building Materials – Applications to Hemp Concretes. - Ed. Wiley, 2013, 314 p.
[Castel 2016] Castel, Y., Amziane, S., Sonebi, M
Durabilité du béton de chanvre : résistance aux cycles d’immersion hydrique et séchage - 1ère
conference EuroMaghrébine des Biocomposites, Marrakech, 2016, 7 p.
[Chabannes 2015] Chabannes M., E. Garcia-Diaz E., Clerc L., Bénézet J.-C., Studying the hardening and mechanical performances of rice husk and hemp-based building materials cured under natural and accelerated carbonation, Constr. Build. Mater. 94 (2015) 105–115
[Cizer 2012] Cizer O., Real-time investigation of
reaction rate and mineral phase modifications of lime carbonation - Construction and Buildings
[Construire 2012] Construire en Chanvre, Règles professionnelles d’exécution d’ouvrages en bétons et mortiers de chanvre, SEBTP, Paris, France, 2012.
[Kashtanjeva 2015] Kashtanjeva, A., Sonebi, M.,
Amziane, S., Investigation of the Mechanical Performance and Drying Shrinkage of Hemp Concrete, Proceedings of the First International Conference on Bio-Based Building Materials, Ed. Amziane, S., Sonebi, M., 21-24 June 2015, RILEM Publications s.a.r.l., pp. 309-315
[Khazma 2011] Khazma M., et al. Optimisation of
flax shiv-cementitious composites : Impact of different aggregate treatments using linseed oil -
Construction and Buildings Materials (61), 2014, p. 442-452.
[Lawrence 2007] Lawrence et al. Effects of
carbonation on the pore structure of non-hydraulic lime mortars, Cement and Concrete Research, 37,
2007, p. 1059-1069.
[Magniont 2010] Magniont, C., Contribution à la
formulation et à la characterisation d’un écomatériau de construction à base d’agroressourses - PhD Thesis, 2010, pages 107
to 111, 343 p.
[Nozahic 2012] Nozahic, V.; Amziane, S.; Torrent, G.; Saïdi, K. et al.; Design of green concrete made of plant-derived aggregates and a pumice–lime binder. Cement & Concrete Composites, February 2012, Volume 34, Issue 2, p. 231-241, ISSN 0958-9465.
[Nozahic 2012] Nozahic V., Amziane, S. Influence of sunflower aggregates surface treatments on
physical properties and adhesion with a mineral binder, Composites Part A, 2012, 43: 1837-1849. [Nguyen 2010] Nguyen, T.T.; Picandet, V.; Amziane, S.; Baley, C.; Influence of compactness and hemp hurd characteristics on the mechanical properties of lime and hemp concrete. European Journal of Environmental and Civil Engineering, November 2009, Volume 13, Issue 9, p. 1039-1050, ISSN 1964-8189.
[Page 2015] Page, J., Sonebi, M., Amziane, S.
Experimental Investigation on the Performance of Hybrid Hemp-Flax Composite Materials,
Proceedings of the First International Conference on Bio-Based Building Materials, 2015, RILEM Publications s.a.r.l., p. 243-250.
[Sonebi 2013] Sonebi M., Robinson, A., Amziane, S., Influence of Presaturation Regime, Percentage of Lime and Compaction on the Performance of Hemp Concrete, Proceedings of First Int. Conference on Rheology and Processing of Construction Materials and 7th Int. RILEM Conf. on SCC, 2013, CD 8p.
[Sonebi 2015] Sonebi, M., Wana, M., Amziane, S. Investigation of the Mechanical Performance and Weathering of Hemp Concrete, Proceedings of the First International Conference on Bio-Based Building Materials, 2015, RILEM Publications s.a.r.l pp. 416-421.
[Walker 2014] Walker R., Pavia S., Mitchell R., Mechanical properties and durability of hemp-lime concretes, Constr. Build. Mater. 61 (2014) 340– 348.