HAL Id: hal-02049226
https://hal.sorbonne-universite.fr/hal-02049226
Submitted on 26 Feb 2019
HAL is a multi-disciplinary open access
archive for the deposit and dissemination of
sci-entific research documents, whether they are
pub-lished or not. The documents may come from
teaching and research institutions in France or
abroad, or from public or private research centers.
L’archive ouverte pluridisciplinaire HAL, est
destinée au dépôt et à la diffusion de documents
scientifiques de niveau recherche, publiés ou non,
émanant des établissements d’enseignement et de
recherche français ou étrangers, des laboratoires
publics ou privés.
department: a multi-centre derivation and validation
study
Kordo Saeed, Darius Cameron Wilson, Frank Bloos, Philipp Schuetz, Yuri van
der Does, Olle Melander, Pierre Hausfater, Jacopo Legramante, Yann-Erick
Claessens, Deveendra Amin, et al.
To cite this version:
Kordo Saeed, Darius Cameron Wilson, Frank Bloos, Philipp Schuetz, Yuri van der Does, et al..
The early identification of disease progression in patients with suspected infection presenting to the
emergency department: a multi-centre derivation and validation study. Critical Care, BioMed Central,
2019, 23, pp.40. �10.1186/s13054-019-2329-5�. �hal-02049226�
R E S E A R C H
Open Access
The early identification of disease
progression in patients with suspected
infection presenting to the emergency
department: a multi-centre derivation and
validation study
Kordo Saeed
1,2*, Darius Cameron Wilson
3, Frank Bloos
4,5, Philipp Schuetz
6,7, Yuri van der Does
8, Olle Melander
9,10,
Pierre Hausfater
11, Jacopo M. Legramante
12,13, Yann-Erick Claessens
14, Deveendra Amin
15, Mari Rosenqvist
10,16,
Graham White
17, Beat Mueller
6,7, Maarten Limper
18, Carlota Clemente Callejo
19, Antonella Brandi
12,
Marc-Alexis Macchi
14, Nicholas Cortes
1,2,20, Alexander Kutz
6, Peter Patka
8, María Cecilia Yañez
19, Sergio Bernardini
21,22,
Nathalie Beau
14, Matthew Dryden
1,2,23, Eric C. M. van Gorp
24,25, Marilena Minieri
21, Louisa Chan
26,
Pleunie P. M. Rood
8and Juan Gonzalez del Castillo
27Abstract
Background: There is a lack of validated tools to assess potential disease progression and hospitalisation decisions in patients presenting to the emergency department (ED) with a suspected infection. This study aimed to identify suitable blood biomarkers (MR-proADM, PCT, lactate and CRP) or clinical scores (SIRS, SOFA, qSOFA, NEWS and CRB-65) to fulfil this unmet clinical need.
Methods: An observational derivation patient cohort validated by an independent secondary analysis across nine EDs. Logistic and Cox regression, area under the receiver operating characteristic (AUROC) and Kaplan-Meier curves were used to assess performance. Disease progression was identified using a composite endpoint of 28-day mortality, ICU admission and hospitalisation > 10 days.
Results: One thousand one hundred seventy-five derivation and 896 validation patients were analysed with respective 28-day mortality rates of 7.1% and 5.0%, and hospitalisation rates of 77.9% and 76.2%. MR-proADM showed greatest accuracy in predicting 28-day mortality and hospitalisation requirement across both cohorts. Patient subgroups with high MR-proADM concentrations (≥ 1.54 nmol/L) and low biomarker (PCT < 0.25 ng/mL, lactate < 2.0 mmol/L or CRP < 67 mg/ L) or clinical score (SOFA < 2 points, qSOFA < 2 points, NEWS < 4 points or CRB-65 < 2 points) values were characterised by a significantly longer length of hospitalisation (p < 0.001), rate of ICU admission (p < 0.001), elevated mortality risk (e.g. SOFA, qSOFA and NEWS HR [95%CI], 45.5 [10.0–207.6], 23.4 [11.1–49.3] and 32.6 [9.4–113.6], respectively) and a greater number of disease progression events (p < 0.001), compared to similar subgroups with low MR-proADM concentrations (< 1.54 nmol/L). Increased out-patient treatment across both cohorts could be facilitated using a derivation-derived MR-proADM cut-off of < 0.87 nmol/L (15.0% and 16.6%), with decreased readmission rates and no mortalities.
(Continued on next page)
* Correspondence:kordosaeed@nhs.net
1Department of Microbiology, Hampshire Hospitals NHS Foundation Trust,
Winchester and Basingstoke, UK
2University of Southampton, School of Medicine, Southampton, UK
Full list of author information is available at the end of the article
© The Author(s). 2019 Open Access This article is distributed under the terms of the Creative Commons Attribution 4.0 International License (http://creativecommons.org/licenses/by/4.0/), which permits unrestricted use, distribution, and reproduction in any medium, provided you give appropriate credit to the original author(s) and the source, provide a link to the Creative Commons license, and indicate if changes were made. The Creative Commons Public Domain Dedication waiver (http://creativecommons.org/publicdomain/zero/1.0/) applies to the data made available in this article, unless otherwise stated.
(Continued from previous page)
Conclusions: In patients presenting to the ED with a suspected infection, the blood biomarker MR-proADM could most accurately identify the likelihood of further disease progression. Incorporation into an early sepsis management protocol may therefore aid rapid decision-making in order to either initiate, escalate or intensify early treatment strategies, or identify patients suitable for safe out-patient treatment.
Keywords: MR-proADM, Sepsis, SOFA, qSOFA, Disease progression, Emergency department
Background
All infections have the potential to manifest into life-threatening conditions, depending on the virulence of the infecting organism and the subsequent pathophysiological host response [1]. An early diagnosis and assessment of infection severity is therefore crucial in order to initiate appropriate therapeutic strategies.
Recent changes to the definition and diagnostic criteria used to identify sepsis have resulted in an emphasis on the identification of a dysregulated host response and the presence of life-threatening organ dysfunction [2,3]. The use of the Sequential Organ Failure Assessment (SOFA) score as part of the clinical criteria to identify and characterise sepsis [2], rather than an emphasis on the non-specific systemic inflammatory response syn-drome (SIRS) [4], has proven controversial due to the complex nature of the score. The alternative quick SOFA (qSOFA) score to screen infected patients likely to have a poor outcome has also been reported to have signifi-cant sensitivity and kinetical limitations [1,5–8]. In both cases, a focus on the identification of high severity pa-tients may lead to either a delayed therapeutic response or inappropriate discharge decisions in those with ini-tially low severities but a high potential for disease pro-gression [9,10]. Such patients at risk of this transitional status have previously been described as “pre-septic” [10]. Conversely, the unnecessary hospitalisation of pa-tients with uncomplicated infections who are at no fur-ther risk of disease progression can lead to an additional increase in clinical workload and financial burden. Thus, a more accurate assessment of the pathophysiological host response to infection, and the potential for further disease development, is essential [11,12].
The use of biological markers which have a high sensi-tivity for assessing disease severity and are significantly increased during the initial stages of sepsis development may therefore be of significant clinical interest in facili-tating early therapeutic decisions [13]. Biomarkers such as procalcitonin (PCT) and C-reactive protein (CRP) are already well established in the field of infectiology [14,
15], whilst elevated lactate levels can reflect significant infection-related cellular dysfunction despite being in-creased due to other pathophysiological abnormalities [2]. Conversely, the clinical utility of novel biomarkers
such as mid-regional proadrenomedullin (MR-proADM) remains less clear. Recent studies have shown MR-proADM concentrations to be rapidly induced in response to LPS stimulation [16] and invasive fungal in-fections [17], as well as in the initial stages of sepsis de-velopment [18] and progression towards sepsis-related multiple organ failure [19,20]. Thus, MR-proADM may be of significant clinical relevance in settings such as the ED where an early assessment of the potential for fur-ther disease progression is vital.
This study therefore aimed to investigate the performance of each biomarker (MR-proADM, PCT, lactate and CRP) and clinical score (SIRS, SOFA, qSOFA, NEWS and CRB-65) in patients presenting to the emergency department with a suspected infection in order to identify (i) those with an increased risk of further disease progression and mortal-ity, and (ii) patients with uncomplicated infections where out-patient treatment may be most appropriate.
Methods
Study design and ethical approval
This study analysed and compared results from two pa-tient cohorts. The derivation cohort consisted of papa-tients prospectively enrolled after presenting to the EDs of five hospitals in England, France, Italy, Sweden and Spain be-tween August 2016 and July 2017, with further patients added from a subgroup of a previously published cohort from the Netherlands [21]. The validation cohort con-sisted of a retrospective subgroup analysis of patients presenting to the EDs of three hospitals in France, Switzerland and the USA [22]. Both cohorts were en-rolled in accordance with the Helsinki Declaration. Eth-ical approval was granted from the relevant boards or governance bodies of each participating hospital, where appropriate, and informed consent obtained from all pa-tients or next of kin. The manuscript was drafted ac-cording to the Standards for the Reporting of Diagnostic accuracy studies STARD criteria [23].
Inclusion and exclusion criteria
Adult patients (≥ 18 years) were enrolled based on a clin-ical suspicion of infection which could be made accord-ing to main presentaccord-ing symptoms, vital signs, blood
culture request or laboratory findings obtained during ED assessment. Exclusion criteria included non-adult pa-tients, pregnancy or refusal to participate. Inclusion and exclusion criteria were similar between the derivation and validation cohorts. An initial blood draw was pro-spectively taken as part of the routine ED assessment across all sites, and surplus samples stored at− 80 °C for subsequent biomarker measurements.
Study endpoints and analytical aims
Study endpoints and analytical aims were defined as follows: 28-day mortality: all-cause mortality within 28 days following enrolment. Hospitalisation: hospital admission with a subsequent stay of > 24 h. Out-pa-tients: patients presenting to and discharged from the ED on the same day. Intensive Care Unit (ICU) ad-mission: all-cause ICU admission within 28 days fol-lowing enrolment. Uncomplicated infections: composite end-point comprising of an absence of 28-day mortality and ICU admission, and a total hos-pitalisation of ≤ 10 days. Disease progression: compos-ite end-point comprising of 28-day mortality, ICU admission and a total hospitalisation of > 10 days, similar to the criteria outlined in a previous investiga-tion [24].
Data collection and biomarker measurements
Existing comorbidities, demographics and concomitant medications were noted on arrival, and results from subsequent routine laboratory and microbiology tests recorded. CRP and lactate measurements were con-ducted at each respective site. Surplus blood samples were retrospectively batch tested for PCT and MR-proADM using a commercially available double sandwich immunoassay (KRYPTOR™, Thermo Fisher Scientific, Germany), with results made unavailable throughout patient enrolment and hospitalisation. Clinical scores including SIRS, SOFA, qSOFA, NEWS and CRB-65 were retrospectively calculated whenever possible. For the purposes of this analysis, the SOFA score was used as the reference standard due to its role in clinically characterising infected patients within the Third International Consensus Definitions for Sepsis and Septic Shock [2], whilst MR-proADM was taken as the index test. Sepsis was classified ac-cording to both previous and current definitions, with no differentiation made between sepsis, severe sepsis or septic shock subgroups (Sepsis-2) [4], or sepsis and septic shock subgroups (Sepsis-3) [2].
Statistical analysis
Data were reported using mean (standard deviation) for the symmetrically distributed variable of age, and
median [first quartile–third quartile] for the duration of total hospitalisation, biomarker and clinical score variables, which showed a skewed distribution. Differ-ences in demographic and clinical characteristics with regard to 28-day mortality were assessed using the chi-square (χ2) test for categorical variables, Student’s t test for age, and the Mann-Whitney U test for all other continuous variables. Statistical procedures con-ducted for each analytical aim were as follows: 28-day mortality prediction: Receiver operating characteristic (ROC) curves and areas under the curve (AUC) de-termined the parameter with the greatest predictive value, with 95% confidence intervals [95% CI] com-pared to determine significance. Youden’s criterion was used to establish optimal cut-off values, with sen-sitivity, specificity, negative and positive predictive values (NPV, PPV), negative and positive likelihood ratios (LR-, LR+) and diagnostic odds ratios (DOR) also reported. Kaplan-Meier curves identified patient subgroups using optimised or pre-determined cut-offs, with hazard ratios (HR) calculated between subgroups. Univariate and multivariate Cox regression models were performed to assess the association with survival time. Potential confounding variables were selected based on a univariate analysis (p value < 0.005 after applying a Bonferroni correction), and subsequently included in the multivariate analysis as adjusting vari-ables. Survival time was censored at 28 days following ED presentation. Results were presented as the hazard ratio (HR) per 1 interquartile-range increase, with corresponding 95% CI. Enrichment for uncomplicated infections and patients showing disease progression: Patients were initially categorised into two groups based on cut-offs for each biomarker and score with respect to 28-day mortality. The parameter with the highest 28-day mortality predictive value was subse-quently selected and patient populations further cate-gorised to identify subgroups enriched for uncomplicated infections or patients showing disease progression. 28-day mortality and ICU admission rates, overall hospitalisation duration and the compos-ite endpoints for uncomplicated infection and disease progression were compared between subgroups using the long-rank test for mortality, the chi-square (χ2
) test for the composite scores and ICU admission, and the Mann-Whitney U test for the overall length of hospitalisation. Hospitalisation and out-patient treat-ment decisions: ROC and AUC were calculated for each parameter. Univariate and multivariate logistic regression assessed the association with hospitalisation decisions, with results presented as the odds ratio (OR) per 1 interquartile-range increase. Derivation and validation cohorts were subsequently pooled to derive improved 28-day mortality and hospitalisation
cut-off values. A diagnostic meta-analysis was per-formed to calculate either the pooled hazard ratio for 28-day mortality or odds ratio for hospitalisation deci-sions for the biomarker or score with the highest der-ivation and validation cohort values. The presence of statistical heterogeneity between cohorts was assessed by the I2test [25], with values of 25%, 50% or 75% regarded as indicative of low, moderate or high statistical hetero-geneity, respectively. Post-test probabilities based on vari-ous pre-test probabilities (5% or 20% risk for 28-day mortality and hospitalisation) were illustrated using a Fagan nomogram [26]. A Bonferroni correction addressed the issue of multiple testing where appropriate. Optimised cut-offs for the biomarker or score with the highest pre-dictive 28-day mortality and hospitalisation values were used to allocate patients to either virtual hospitalisation or out-patient treatment groups. Out-patients who later re-presented to the ED and were hospitalised were counted as readmissions. Both virtual and observed hospi-talisation, out-patient treatment, readmission and 28-day mortality rates were subsequently calculated and
compared. A p value < 0.05 was considered statistically significant. All data were analysed using the statistics soft-ware R (version 3.1.2), unless otherwise stated. Due to the exploratory nature of the derivation cohort, no a priori sample size calculation was performed.
Results
Patient characteristics
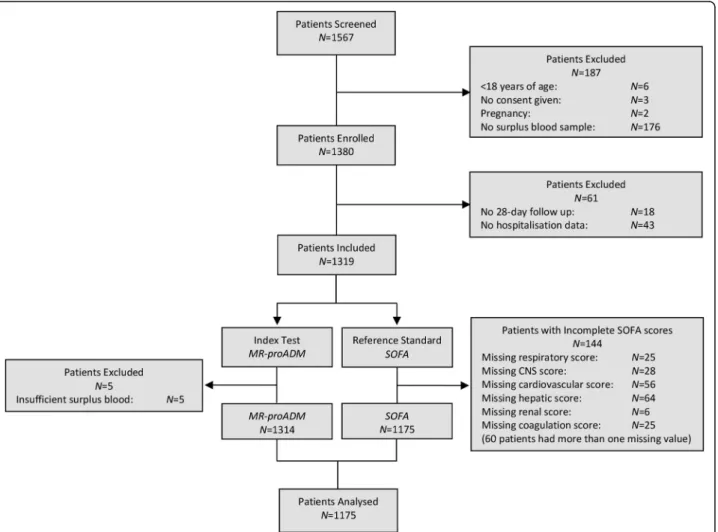
A total of 1567 derivation patients were screened at baseline, with the exclusion of 392 patients predomin-antly due to missing information or insufficient surplus blood (Fig. 1). Thus, 1175 derivation patients were in-cluded in the final analysis, compared to 896 validation patients. The derivation cohort comprised of signifi-cantly older patients with a longer length of hospitalisa-tion and a higher prevalence of suspected respiratory infection (all p < 0.001; Table1), and is further described in Additional file1: Table S1. Comparison of biomarker concentrations between cohorts found no differences be-tween MR-proADM or PCT concentrations, whilst CRP
Fig. 1 Flow chart describing the enrolment of patients. CNS central nervous system, MR-proADM mid-regional proadrenomedullin, N number, SOFA Sequential Organ Failure Assessment
values were significantly higher in the validation cohort (p < 0.001).
28-day mortality prediction
There were no significant differences in the all-cause 28-day mortality rate between the derivation (N = 84; 7.1%) and validation (N = 45; 5.0%) cohorts. Patient demographics and clinical characteristics according to survival are reported in Table2 (derivation cohort) and Additional file 1: Table S2 (validation cohort), with pa-tients further classified according to Sepsis-2 and Sepsis-3 definitions (Additional file1: Table S3). All bio-markers and scores were significantly increased in the non-surviving patients of both cohorts (p < 0.001).
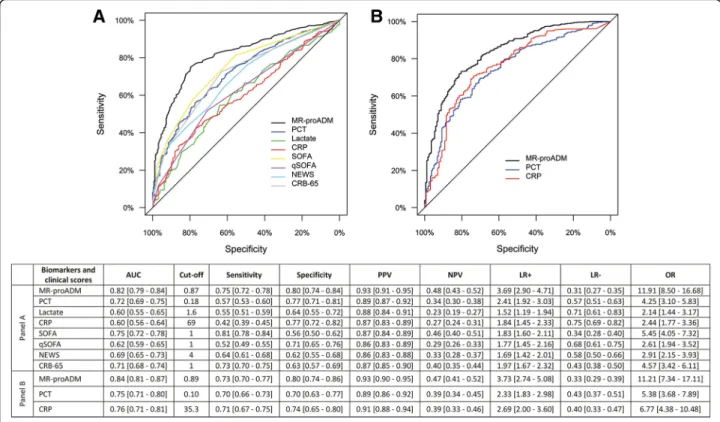
Univariate Cox regression analysis found that MR-proADM had the strongest association in predicting 28-day mortality in the derivation and validation cohorts (Table 3). In a multivariate analysis, the derivation cohort model was adjusted for the influence of age and existing cardiovascular, neurological, renal and malig-nancy comorbidities, with similar results found when the model was applied to the validation cohort (Table4). AUC analysis across both cohorts found that MR-proADM had a significantly greater accuracy com-pared to other biomarkers and scores (Fig. 2). Applica-tion of the optimised derivaApplica-tion cut-off in the validaApplica-tion cohort is reported in Additional file1: Table S4. Results were similar to those obtained in the derivation and val-idation cohorts using their respective optimised cut-offs.
Table 1 Patient characteristics between derivation and validation cohorts
Patient characteristics Derivation cohort (N = 1175) Validation cohort (N = 896) p value Demographics
Age (years) (mean, SD) 63.3 (20.9) 58.8 (21.0) < 0.001 Male Sex (N, %) 592 (50.4%) 473 (52.8%) 0.266 Disposition
Hospital admission (N, %) 915 (77.9%) 567 (76.2%) 0.397 Hospital length of stay (days) (median, Q1–Q3) 4 [1–9] 2 [0–6] < 0.001 ICU admission (N, %) 32 (2.7%) 49 (5.5%) 0.001 28-day mortality (N, %) 84 (7.1%) 45 (5.0%) 0.098 Hospital mortality (N, %) 108 (9.2%) 38 (4.2%) < 0.001 Comorbidities Cardiovascular disease (N, %) 363 (30.9%) 354 (39.5%) 0.003 Diabetes (N, %) 216 (18.4%) 142 (15.8%) 0.131 Malignancy (N, %) 228 (19.4%) 186 (20.8%) 0.445 Neurological disorders (N, %) 135 (11.5%) 67 (7.5%) 0.002 Respiratory disease (N, %) 378 (32.2%) 52 (5.8%) < 0.001 Renal disease (N, %) 82 (7.0%) 169 (18.9%) < 0.001 Suspected source of infection
Fever of unknown origin (N, %) 98 (8.3%) 139 (18.4%) < 0.001 Intra-abdominal (N, %) 158 (13.4%) 79 (10.5%) 0.051 Respiratory (N, %) 498 (42.4%) 258 (34.2%) < 0.001 Skin and soft tissue (N, %) 96 (8.2%) 61 (8.1%) 0.943 Urogenital (N, %) 278 (23.7%) 164 (21.7%) 0.323 Other (N, %) 47 (4.0%) 53 (7.0%) 0.010 Biomarkers
MR-proADM (nmol/L) (median, Q1–Q3) 1.09 [0.69–1.71] 1.03 [0.68–1.78] 0.888 PCT (ng/mL) (median, Q1–Q3) 0.17 [0.07–0.77] 0.14 [0.08–0.48] 0.244 CRP (mg/L) (median, Q1–Q3) 32 [10–120] 56 [15–142] < 0.001
Values expressed in percentages (%) indicate the proportion of patients within each cohort for each variable. Data are presented as mean (standard deviation, SD) or median [first quartile (Q1)–third quartile (Q3)] where specified. The chi-square (χ2
) test was used to determine significance between the cohorts for categorical variables, Student’s t test for the variable of age and Mann-Whitney U test for hospitalisation duration and biomarker concentrations. CRP C-reactive protein, ICU intensive care unit,MR-proADM mid-regional proadrenomedullin, N number, PCT procalcitonin
Table 2 Derivation cohort characteristics with regards to 28-day mortality
Patient characteristics Total patient cohort (N = 1175) Survivors (N = 1091) Non-survivors (N = 84) p value Demographics
Age (years) (mean, SD) 63.3 (20.9) 62.0 (20.9) 79.7 (11.6) < 0.001 Male gender (N, %) 592 (50.4%) 543 (49.8%) 49 (58.3%) 0.130 Disposition
Hospital admission (N, %) 915 (77.9%) 831 (76.2%) 84 (100.0%) < 0.001 Hospital length of stay (days) (median, Q1–Q3) 4 [1–9] 4 [1–9] 11 [5–17] < 0.001 ICU admission (N, %) 32 (2.7%) 18 (1.6%) 14 (16.7%) < 0.001 Comorbidities Cardiovascular disease (N, %) 363 (30.9%) 316 (29.0%) 47 (56.0%) < 0.001 Diabetes (N, %) 216 (18.4%) 196 (18.0%) 20 (23.8%) 0.183 Immunodeficiency (N, %) 64 (5.4%) 56 (5.1%) 8 (9.5%) 0.088 Liver disease (N, %) 31 (2.6%) 28 (2.6%) 3 (3.6%) 0.580 Malignancy (N, %) 228 (19.4%) 198 (18.1%) 30 (35.7%) < 0.001 Neurological disorders (N, %) 135 (11.5%) 116 (10.6%) 19 (22.6%) < 0.001 Respiratory disease (N, %) 378 (32.2%) 344 (31.5%) 34 (40.5%) 0.091 Renal disease (N, %) 82 (7.0%) 68 (6.2%) 14 (16.7%) < 0.001 Infectious source
Bone and Joint (N, %) 13 (1.1%) 13 (1.2%) 0 (0.0%) 0.315 Cardiac (N, %) 6 (0.5%) 5 (0.5%) 1 (1.2%) 0.364 Central nervous system (N, %) 13 (1.1%) 10 (0.9%) 3 (3.6%) 0.025 Fever of unknown origin (N, %) 98 (8.3%) 87 (8.0%) 11 (13.1%) 0.100 Foreign object (N, %) 5 (0.4%) 4 (0.4%) 1 (1.2%) 0.264 Intra-abdominal (N, %) 158 (13.4%) 153 (14.0%) 5 (6.0%) 0.007 Respiratory—lower (N, %) 413 (35.1%) 369 (33.8%) 44 (52.4%) < 0.001 Respiratory—upper (N, %) 85 (7.2%) 85 (7.8%) 0 (0.0%) 0.008 Skin and soft tissue (N, %) 96 (8.2%) 89 (8.2%) 7 (8.3%) 0.901 Surgical-related (N, %) 10 (0.9%) 10 (0.9%) 0 (0.0%) 0.379 Urogenital (N, %) 278 (23.7%) 266 (24.4%) 12 (14.3%) 0.041 Microbiological findings
Blood cultures taken (N, %) 888 (75.6%) 823 (75.4%) 65 (77.4%) 0.689 Positive blood cultures (N, %) 227 (19.3%) 205 (18.8%) 22 (26.2%) 0.099 Gram-positive bacteria (N, %) 120 (10.2%) 108 (9.9%) 12 (14.3%) 0.201 Gram-negative bacteria (N, %) 179 (15.2%) 166 (15.2%) 13 (15.5%) 0.949 Fungal cultures (N, %) 9 (0.8%) 8 (0.7%) 1 (1.2%) 0.643 Viral PCR (N, %) 40 (3.4%) 39 (3.6%) 1 (1.2%) 0.246 Other (N, %) 9 (0.8%) 8 (0.7%) 1 (1.2%) 0.830 Biomarkers and clinical scores
MR-proADM (nmol/L) (median, Q1–Q3) 1.09 [0.69–1.71] 1.02 [0.67–1.59] 2.65 [1.81–4.67] < 0.001 PCT (ng/mL) (median, Q1–Q3) 0.17 [0.07–0.77] 0.16 [0.07–0.61] 0.94 [0.23–3.12] < 0.001 Lactate (mmol/L) (median, Q1–Q3) 1.60 [1.14–2.30] 1.55 [1.10–2.23] 2.40 [1.50–3.50] < 0.001 CRP (mg/L) (median, Q1–Q3) 32 [10–120] 30 [10–112] 102 [28–178] < 0.001 SIRS (points) (median, Q1–Q3) 2 [1–3] 2 [1–3] 3 [2–3] < 0.001 SOFA (points) (median, Q1–Q3) 2 [0–3] 1 [0–3] 4 [2–6] < 0.001 qSOFA (points) (median, Q1–Q3) 0 [0–1] 0 [0–1] 1 [1–2] < 0.001
Pooling of the combined 2071 derivation and validation patients resulted in an identical cut-off to that of the derivation cohort (Additional file 1: Table S5), with meta-analysis reporting similar overall hazard ratios and a moderate degree of heterogeneity between cohorts (Additional file1: Figure S1). Varying the pre-test preva-lence of 28-day mortality (low mortality risk: 5%, or high mortality risk: 20%) resulted in high positive and low negative post-test probabilities for MR-proADM in each case (Additional file1: Figure S2).
Kaplan-Meier curves using the optimised
MR-proADM derivation cut-off could identify similar low and high disease severity subgroups within the derivation (low vs. high severity: N = 810 vs. 365; 0.9% vs. 21.1% mortality; p < 0.001; Fig. 3a) and valid-ation (low vs. high severity: N = 612 vs. 284; 0.7% vs. 14.4% mortality; p < 0.001) cohorts, with comparable Cox regression analysis results (Additional file 1: Table S6). Identification of disease severity using other bio-markers and scores resulted in a lower discrimination and
hazard ratio between subgroups (Fig.3b–f; Additional file1: Table S6).
Enrichment for uncomplicated infections
Based on its high predictive value for 28-day mortality, MR-proADM was subsequently selected to further strat-ify patients following initial classification with other bio-markers and scores. The presence of low biomarker (PCT < 0.25 ng/mL, lactate < 2.0 mmol/L or CRP < 67 mg/L) or clinical score (SOFA < 2 points, qSOFA < 2 points, NEWS < 4 points or CRB-65 < 2 points) values resulted in a high number of uncomplicated infections (Additional file 1: Table S7), which could be further enriched using MR-proADM concentrations < 1.54 nmol/L, resulting in the identification of large patient populations with low mortality rates, low ICU admission rates, low lengths of hospitalisation and a higher number of uncomplicated in-fections according to the composite endpoint (Fig. 4; Additional file1: Figure S3–8 and Table S8).
Table 2 Derivation cohort characteristics with regards to 28-day mortality (Continued)
Patient characteristics Total patient cohort (N = 1175) Survivors (N = 1091) Non-survivors (N = 84) p value NEWS (points) (median, Q1–Q3) 4 [2–7] 4 [2–7] 8 [5–10] < 0.001 CRB-65 (points) (median, Q1–Q3) 1 [0–2] 1 [0–1] 2 [1–2] < 0.001
Values expressed in percentages (%) indicate either the proportion of the total patient cohort, surviving or non-surviving patients at 28 days for each variable, where applicable. Data are presented as mean (standard deviation, SD) or median [first quartile (Q1)–third quartile (Q3)] where appropriate. The chi-square (χ2
) test was used to determine significance between surviving and non-surviving patients for categorical variables, Student’s t test for the variable of age, and Mann-WhitneyU test for hospitalisation duration, biomarker and clinical score variables. CRB-65 Severity score for community-acquired pneumonia, CRP C-reactive protein,ICU intensive care unit, MR-proADM mid-regional proadrenomedullin, N number, NEWS National Early Warning Score, PCR polymerase chain reaction, PCT procalcitonin,qSOFA quick Sequential Organ Failure Assessment, SIRS systemic inflammatory response syndrome, SOFA Sequential Organ Failure Assessment
Table 3 Univariate Cox regression for the prediction of 28-day mortality in the derivation and validation cohorts
Biomarker or clinical score Patients (N) Mortality (N) LRχ2 DF p value C-index HR IQR [95% CI] Derivation cohort MR-proADM 1175 84 166.4 1 < 0.001 0.869 5.4 [4.2–6.9] PCT 1166 84 42.4 1 < 0.001 0.713 2.1 [1.7–2.6] Lactate 746 59 25.3 1 < 0.001 0.678 2.2 [1.6–2.9] CRP 1170 83 19.7 1 < 0.001 0.649 2.5 [1.6–3.8] SIRS 965 84 12.2 1 < 0.001 0.640 1.9 [1.3–2.8] SOFA 1175 84 83.5 1 < 0.001 0.827 2.6 [2.2–3.1] qSOFA 1175 84 73.4 1 < 0.001 0.836 3.2 [2.5–4.0] NEWS 1058 81 53.0 1 < 0.001 0.734 3.1 [2.3–4.2] CRB-65 1175 84 75.8 1 < 0.001 0.838 2.6 [2.1–3.2] Validation cohort MR-proADM 896 45 84.2 1 < 0.001 0.881 3.8 [2.9–5.0] PCT 884 45 32.4 1 < 0.001 0.770 2.0 [1.6–2.5] CRP 780 42 19.4 1 < 0.001 0.703 3.1 [1.7–5.6]
CI confidence interval, CRB-65 severity score for community-acquired pneumonia, CRP C-reactive protein, DF degrees of freedom, HR hazard ratio, IQR interquartile range,LR likelihood ratio, MR-proADM mid-regional proadrenomedullin, N number, NEWS National Early Warning Score, PCT procalcitonin, qSOFA quick Sequential Organ Failure Assessment,SIRS systemic inflammatory response syndrome, SOFA Sequential Organ Failure Assessment
Table 4 Multivariate Cox regression for the prediction of 28-day mortality in the derivation and validation cohorts
Biomarker or clinical score Patients (N) Mortality (N) LRχ2 DF p value C-index HR IQR [95% CI] Derivation cohort MR-proADM 1175 84 196.6 6 < 0.001 0.883 5.2 [3.9–6.9] PCT 1166 84 112.0 6 < 0.001 0.813 2.0 [1.6–2.5] Lactate 746 59 59.2 6 < 0.001 0.771 2.2 [1.6–3.0] CRP 1170 83 97.3 6 < 0.001 0.787 2.6 [1.7–4.0] SIRS 965 84 91.6 6 < 0.001 0.779 2.1 [1.4–3.0] SOFA 1175 84 143.3 6 < 0.001 0.840 2.9 [2.4–3.7] qSOFA 1175 84 117.7 6 < 0.001 0.825 2.5 [1.9–3.2] NEWS 1058 81 105.2 6 < 0.001 0.803 2.5 [1.8–3.4] CRB-65 1175 84 99.3 6 < 0.001 0.793 2.0 [1.5–2.5] Validation cohort MR-proADM 896 45 114.6 6 < 0.001 0.899 3.7 [2.6–5.2] PCT 884 45 80.7 6 < 0.001 0.847 1.6 [1.3–2.1] CRP 780 42 75.2 6 < 0.001 0.837 2.4 [1.2–4.6]
Age, cardiovascular, neurological, renal and malignancy comorbidities were used as adjusting variables within the multivariate derivation cohort model, and subsequently applied to the validation cohort.CI confidence interval, CRB-65 severity score for community-acquired pneumonia, CRP C-reactive protein, DF degrees of freedom, HR hazard ratio,IQR interquartile range, LR likelihood ratio, MR-proADM mid-regional proadrenomedullin, N number, NEWS National Early Warning Score, PCT procalcitonin, qSOFA quick Sequential Organ Failure Assessment, SIRS systemic inflammatory response syndrome, SOFA Sequential Organ Failure Assessment
Fig. 2 ROC curve and AUC analysis for 28-day mortality prediction within the derivation (a) and validation (b) cohorts following presentation to the emergency department. AUC area under the curve, CRB-65 severity score for community-acquired pneumonia, CRP C-reactive protein, LR- negative likelihood ratio, LR+ positive likelihood ratio, MR-proADM mid-regional proadrenomedullin, NEWS National Early Warning Score, OR diagnostic odds ratio, NPV negative predictive value, PCT procalcitonin, PPV positive predictive value, qSOFA quick Sequential Organ Failure Assessment, ROC receiver operating characteristic, SIRS systemic inflammatory response syndrome, SOFA Sequential Organ Failure Assessment
Enrichment for patients at risk of disease progression
Conversely, the presence of low biomarker or score values with MR-proADM concentrations≥ 1.54 nmol/L resulted in smaller patient populations, but with a significantly higher mortality and ICU admission rate, significantly lon-ger length of hospitalisation, and a significantly higher number of disease progression events than found within
the subgroups for low biomarker or score values and MR-proADM concentrations < 1.54 nmol/L (Fig. 4; Add-itional file1: Table S9–10).
Even in patients where both SOFA and qSOFA values were < 2 points, MR-proADM concentrations were signifi-cantly higher in the non-surviving (N = 11; 2.02 [1.64–3.68] nmol/L) as opposed to surviving (N = 564; 0.76 [0.57–1.12]
Fig. 3 Kaplan-Meier analysis to identify disease severity subgroups using biomarkers and clinical scores within the derivation patient population according to MR-proADM (a), lactate (b), SOFA (c), qSOFA (d), NEWS (e) and CRB-65 (f) cut-offs. CRB-65 severity score for community-acquired pneumonia, MR-proADM mid-regional proadrenomedullin, NEWS National Early Warning Score, qSOFA quick Sequential Organ Failure Assessment, SOFA Sequential Organ Failure Assessment
nmol/L; p < 0.001) patient population. The average time of death was 11 [9–16.5] days with no significant differences found in other standard laboratory parameters.
Hospitalisation and out-patient treatment decisions
No significant differences in hospitalisation or out-patient treatment rates were found between the derivation
(N = 915; 77.9% and N = 260; 22.1%) and validation (N = 567; 76.2% and N = 177; 23.8%) cohorts following ED presentation, with patients selected for out-patient treatment having similar 14-day rehospitalisation (derivation: N = 10; 5.3% vs. validation: N = 9; 5.1%) and 28-day mortality (derivation: N = 0; 0.0% vs. valid-ation: N = 1; 0.6%) rates.
Fig. 4 Kaplan-Meier analysis to identify patient populations enriched for either uncomplicated infections or further disease progression within the derivation cohort. Patients were stratified according to a combination of MR-proADM and lactate (a), PCT (b), SOFA (c), qSOFA (d), NEWS (e) and CRB-65 (f) cut-offs. CRB-65 severity score for community-acquired pneumonia, MR-proADM mid-regional proadrenomedullin, NEWS National Early Warning Score, PCT procalcitonin, qSOFA quick Sequential Organ Failure Assessment, SOFA Sequential Organ Failure Assessment
Univariate logistic regression found that MR-proADM had the strongest association with hospitalisation deci-sions across both cohorts (Additional file 1: Table S11). In a multivariate analysis, the derivation cohort was ad-justed for the same confounding variables as within the 28-day mortality model, yielding similar results for both cohorts (Additional file1: Table S12). Comparable accur-acies were obtained for derivation and validation AUC analyses (Fig. 5), with results using the optimised derivation cut-off in the validation cohort reported in Additional file 1: Tables S13–14. Pooling of the
com-bined 2071 derivation and validation patients resulted in an identical cut-off to that of the validation cohort (Additional file1: Table S15), with meta-analysis reporting similar overall odds ratios and a high degree of heterogen-eity between cohorts (Additional file1: Figure S9). Varying the pre-test prevalence for patient hospitalisation (low hospitalisation risk: 5%, or high hospitalisation risk: 20%) resulted in both high positive and low negative post-test probabilities for MR-proADM in each case (Additional file 1: Figure S10).
A total of 436 (37.1%) derivation and 362 (40.4%) validation patients had MR-proADM values below the
optimised hospitalisation derivation cut-off (< 0.87 nmol/L), representing a potential increase in the der-ivation and validation out-patient populations of 15.0% and 16.6%, respectively. In addition, both sub-groups had lower 14-day readmission rates compared to the actual out-patient population and no mortal-ities up to 28 days (Additional file 1: Figure S11–12).
Conversely, application of the optimised derivation MR-proADM cut-off would have resulted in the hos-pitalisation of 53 (20.4%) derivation and 44 (24.9%) validation patients initially deemed suitable for out-patient treatment, including 7 (70.0%) derivation and 4 (44.4%) validation out-patients who presented to the emergency department an average of 1 day later and were subsequently hospitalised.
Discussion
In this derivation and validation analysis of 2071 sus-pected infection patients presenting to 9 emergency de-partments across Europe and the USA, MR-proADM measurement at presentation could accurately assess dis-ease severity and identify specific patient populations based on the likelihood of subsequent disease
Fig. 5 ROC curve and AUC analysis for hospitalisation decisions within the derivation (a) and validation (b) cohorts following presentation to the Emergency Department. AUC area under the curve, CRB-65 severity score for community-acquired pneumonia, CRP C-reactive protein, LR-negative likelihood ratio, LR+ positive likelihood ratio, MR-proADM mid-regional proadrenomedullin, NEWS National Early Warning Score, NPV negative predictive value, OR diagnostic odds ratio, PCT procalcitonin, PPV positive predictive value, ROC receiver operating characteristic, qSOFA quick Sequential Organ Failure Assessment, SOFA Sequential Organ Failure Assessment
progression. This is of particular importance in patients with few pathophysiological signs and symptoms, as in-dicated by low SOFA, qSOFA or NEWS scores, where initial treatment may either be withheld, delayed or in-sufficient. Our study therefore, for the first time, high-lights the use of MR-proADM in potentially identifying this patient population in order to initiate appropriate treatment strategies at the earliest opportunity.
An early and accurate identification of this key patient demographic, however, may be complicated by the lack of pathognomonic symptoms and the highly complex, het-erogeneous and multifaceted host response to infection [27]. An early diagnosis of developing sepsis therefore in-variably requires a complex clinical investigation incorpor-ating numerous factors such as presenting symptoms, physician judgement, and standard laboratory and bio-marker tests. Accordingly, earlier indicators of deteriorat-ing host response are essential in order to provide relevant information at the earliest opportunity possible [19]. In this respect, MR-proADM is an interesting biomarker candidate, with previous studies showing increased con-centrations in response to deteriorating microcirculatory integrity and resulting capillary leak, thus reflecting the early stages of developing organ dysfunction [28–31]. An early assessment of microcirculatory function may there-fore contribute significant information as part of an initial multi-modal clinical examination, and provide a more ac-curate method of assessing disease progression and the effi-cacy of therapeutic interventions compared to the use of conventional biomarkers or scoring systems [30].
Based on the results of this study, two clinically import-ant uses for MR-proADM can be proposed: (i) an early es-calation of treatment in patients with MR-proADM concentrations ≥ 1.5 nmol/L, thus identifying an already high level of disease severity or a high potential for further development and progression, and (ii) a decreased number of hospital admissions allowing a safe increase in out-patient treatment in patients with MR-proADM con-centrations < 0.9 nmol/L.
First, an early identification of further disease develop-ment and progression in patients with uncomplicated in-fections and minimal organ dysfunction is crucial in order to initiate, escalate or intensify treatment at the earliest opportunity. Our results identified a large patient popula-tion with few clinical or laboratory signs which would prompt an immediate and urgent therapeutic response. The presence of elevated MR-proADM concentrations in a subset of these patients, however, resulted in long lengths of hospitalisation, a high likelihood of mortality, increased ICU admission rates, and a high number of pa-tients satisfying the composite endpoint for disease progression, compared to those with low MR-proADM levels. Such findings may facilitate specific interventions such as the rapid administration of antibiotics and fluids,
the use of adjunctive sepsis therapies, or additional diagnostic testing in order to prevent potential cases of under-treatment or inappropriate discharge. In addition, a more personalised and tailored therapeutic approach may be most beneficial in patients with the highest MR-proADM concentrations (e.g. > 2.75 nmol/L [19]), with the early admission onto a high dependency or inten-sive care unit to initiate aggresinten-sive therapeutic strategies, such as those targeting extravascular fluid accumulation, potentially decreasing further organ dysfunction or pro-gression towards multiple organ failure [20,32]. Interest-ingly, MR-proADM concentrations > 2.75 nmol/L in our study (N = 126; 10.7%) resulted in a 28-day mortality rate of 30.2%, similar to the 32.5% found in the intensive care study of Elke et al. [19] in patients with corresponding concentrations (N = 759; 73.7%).
Few studies have reported similar findings to ours. In-deed, numerous investigations have focussed on mortal-ity and adverse event prediction in patients with community-acquired pneumonia (CAP), comparing MR-proADM performance to clinical scores such as CURB-65 and the Pneumonia Severity Index (PSI), with a moderate to good discriminatory performance found for both endpoints and similar cut-offs compared to our analysis [33–38]. Similar results were also reported for mortality prediction outside the intensive care setting using SOFA and qSOFA scores in the recent sepsis-3 definitions [2], thus partially confirming and validating results from our analysis.
Findings observed in our study may, in part, be ex-plained by the rapidly induced kinetical profile of MR-proADM in response to LPS addition, compared to other parameters such as procalcitonin and C-reactive protein [16]. Initial microcirculatory dysfunction due to in-fection is likely to drive the expected physiological devel-opment towards organ dysfunction and ultimate multiple organ failure [39]. Hence, measurement of MR-proADM values upon ED presentation may provide an early indica-tion concerning potential disease progression [30]. Similar findings have also been observed in an intensive care set-ting in patients with high MR-proADM concentrations and initially low or moderate levels of organ dysfunction that progressed towards sepsis-related multiple organ fail-ure [19,20,40]. Indeed, continuously elevated concentra-tions, despite decreasing PCT levels over the first 24 h of treatment, indicated a high likelihood of subsequent treat-ment failure and disease progression, thus providing an early and independent prompt with which to change or modify treatment [19]. The use of MR-proADM to identify the likelihood of infection-related disease progression may therefore be of significant clinical value irrespective of clin-ical setting or initial disease severity.
Second, a more accurate identification of uncomplicated infections with a low risk of further progression may
improve initial hospitalisation and out-patient treatment decision-making. Our results found a similar performance of MR-proADM within both the derivation and validation cohorts, with comparable increases in outpatient num-bers, a lack of subsequent mortality and decreased rehos-pitalisation rates.
Surprisingly, only few studies with relatively small pa-tient populations have previously investigated the accuracy of hospitalisation and out-patient treatment decisions in infected patients using MR-proADM. Of these, Travaglino et al. [41] observed a poor performance in 128 patients with high fever and mixed infections, as opposed to the high discriminatory performance found by Starre et al. [42] in 321 urinary tract infection (UTI) patients. A recent secondary analysis of 313 UTI patients by Stalenhoef et al. [24] found similar results to our analysis using a compar-able cut-off, with increased out-patient treatment, no mor-tality and fewer cases of subsequent rehospitalisation. Conversely, Albrich et al. [43] tested a novel algorithm combining CURB-65 and MR-proADM values in an inter-ventional setting of 313 lower respiratory tract infection (LRTI) patients [44], resulting in significantly increased out-patient numbers and decreased overruling and re-admission rates compared to a control group triaged using CURB-65 alone [45]. Results from our study are therefore derived from the largest sample size of patients with a sus-pected infection presenting to the ED with initial hospital-isation and out-patient treatment decision data to date. The high performance of MR-proADM as a stand-alone parameter as opposed to in combination with a clinical score may facilitate easier use in high patient settings such as the ED, although further observational and interven-tional studies with similarly large patient populations are required to confirm and validate our findings. The gener-ation of corresponding health economic data would also be beneficial in highlighting potential cost savings from in-creased out-patient treatment.
Our study has several limitations. Firstly, the absence of subsequent biomarker and clinical score measurements after hospital admission only allow assumptions to be made concerning disease progression and sepsis develop-ment, according to current definitions [2]. Similar studies investigating MR-proADM kinetics in LRTI patients over 72 h have previously shown a decreased survival probabil-ity in patients with increasing or continuously elevated concentrations [46]. Nevertheless, future studies should be designed considering additional variables such as SOFA score kinetics between admission and either 48 or 72 h to investigate developing organ dysfunction and sepsis pro-gression as relevant endpoints. In addition, the inclusion of hospitalisation duration as a variable in the composite endpoint for identifying uncomplicated infections and dis-ease progression may not take numerous time-dependent internal and external clinical factors into account, and
could result in different findings if an alternative discrim-inatory value is used. Secondly, clinical scores in the valid-ation cohort could not be calculated due to the absence of key clinical data, thus, a direct comparison between co-horts was not possible. Finally, mortality and hospitalisa-tion prevalence in other hospitals and clinical settings may significantly differ with one another, leading to the calcula-tion of different negative and positive predictive values, and resulting in study results which are not directly transferrable.
We note several strengths. Firstly, the comparative use of two large, independent, multicentre patient populations en-sured a high degree of internal validity, with similar patient demographics between cohorts. Nevertheless, future studies would greatly benefit from the inclusion of further EDs from alternative geographies, different income-settings and hospitals with significantly different triage procedures, in order to rule-out any significant influence on results and in-crease the reproducibility of the findings. Secondly, the use of optimised derivation MR-proADM cut-offs resulted in similar findings across both cohorts with regard to the identification of disease severity and out-patient treatment, strengthening its potential use in both areas.
Conclusions
MR-proADM measurement upon ED presentation may allow for an early identification of patients with suspected infection who may suffer from subsequent disease pro-gression. Conversely, a more accurate identification of those with uncomplicated infections and the rule-out of further disease progression may facilitate an increased rate of out-patient treatment with a low number of subsequent readmissions. Incorporation of MR-proADM into an early sepsis management protocol may therefore aid rapid clin-ical decision making and subsequent treatment decisions in the emergency department, thus improving persona-lised sepsis strategies.
Additional files
Additional file 1:Table S1. Initial clinical diagnoses and infectious source (derivation cohort). Table S2. 28-day mortality validation cohort characteristics. Table S3. Sepsis-2 and sepsis-3 classification (derivation cohort). Table S4. Application of the 28-day mortality derivation MR-proADM cut-off (validation cohort). Table S5. Pooled derivation and validation cohorts for 28-day mortality prediction. Table S6. Cox regression between high and low severity populations (derivation and validation cohorts). Table S7. Uncomplicated infection and disease progression events in the low 28-day mortality biomarker/score value subgroups. Table S8. Subgroups with low MR-proADM and low biomarker/score values showing enrichment for uncomplicated infections. Table S9. Subgroups with high MR-proADM and low biomarker/score values showing enrichment for disease progression events. Table S10. Significance between uncomplicated infection or disease progression subgroups for hospitalisation duration, 28-day mortality and ICU admission rates. Table S11. Univariate logistic regression for hospitalisation decisions. Table S12. Multivariate logistic
regression for hospitalisation decisions. Table S13. Application of the optimised derivation MR-proADM cut-off for hospitalisation (derivation and validation cohort). Table S14. Derivation and validation logistic regression for hospitalisation using optimised derivation cut-offs. Table S15. Combined derivation and validation cohort meta-analysis for hospitalisation decisions. Figure S1. Meta-analysis assessing derivation and validation heterogeneity for 28-day mortality. Figure S2. Fagan nomogram calculating post-test probabilities for 28-day mortality. Figure S3. Kaplan-Meier using the optimised derivation lactate cut-off. Figure S4. Kaplan-Meier using the optimised derivation PCT cut-off. Figure S5. Kaplan-Meier using the optimised derivation qSOFA cut-off. Figure S6. Kaplan-Meier using the optimised derivation SOFA cut-off. Figure S7. Kaplan-Meier using the optimised derivation SIRS cut-off. Figure S8. Kaplan-Meier using the optimised derivation NEWS cut-off. Figure S9. Meta-analysis assessing derivation and validation heterogeneity for hospitalisation decisions. Figure S10. Fagan nomogram calculating post-test probabilities for hospitalisation decisions. Figure S11. Conventional and virtual MR-proADM guided-triage (derivation cohort). Figure S12. Conventional and virtual MR-proADM guided-triage (validation cohort). (DOCX 1318 kb)
Abbreviations
AUC:Area under the curve; CAP: Community-acquired pneumonia; CI: Confidence interval; CRB-65 and CURB-65: Severity scores for community-acquired pneumonia; CRP: C-reactive protein; ED: Emergency department; HR: Hazard ratio; IQR: Interquartile range; LPS: Lipopolysaccharide; LRTI: Lower respiratory tract infection; MR-proADM: Mid-regional proadrenomedullin; N: Number; NEWS: National Early Warning Score; OR: Odds ratio; PCT: Procalcitonin; PSI: Pneumonia Severity Index; qSOFA: Quick Sequential Organ Failure Assessment; ROC: Receiver operating characteristic; SIRS: Systemic Inflammatory Response Syndrome; SOFA: Sequential Organ Failure Assessment; UTI: Urinary tract infection
Acknowledgements
The authors are grateful to the staff at all participating hospitals for their continued vigilance in identifying patients presenting with infections, and for enrolling patients into this study. KS would like to thank staff in the biochemistry and governance department at the Hampshire Hospitals NHS Foundation Trust, Dr. Alexander Suebsaeng for his support with the project, and Dr. Almuth Marx for her invaluable statistical support. JL would like to acknowledge Loreta D’Amico, Patrizia Alleonato and Silvia Zito for their continued support in processing samples and patients. OL and MR would like to acknowledge the work of the research nurses Lena Tegnér, Maria Bengtsson-Toni and Marjaneh Peyman.
Funding
The study was funded by a restricted grant from Thermo Fisher (Germany). However, the funding organisation did not have any role in the collection, management, analysis, or interpretation of the data; preparation, review, or approval of the manuscript, or decision to submit the manuscript for publication. Availability of data and materials
The datasets used and/or analysed during the present study are available from the corresponding author upon reasonable request.
Authors’ contributions
KS and JGC conceived and designed the study. KS was the primary author, editor of the manuscript and the lead clinical investigator. All authors apart from DCW contributed to the enrolment of patients and sample collection. KS provided statistical advice and analysed the data. KS takes responsibility for the paper as a whole. All authors critically reviewed and approved the final manuscript.
Ethics approval and consent to participate
The study protocol was approved by the ethics board of each hospital where necessary, and written informed consent was obtained from all patients or their legal representatives where appropriate.
Consent for publication
No individual participant data is reported that would require consent to publish from the participant (or legal parent or guardian for children).
Competing interests
All authors have provided information on potential conflicts of interests directly or indirectly related to the work submitted in the journal’s disclosure forms. KS received research grant paid to the insitituion from Thermofisher, as well as educational grants and support to attend meetings. PS and BM received research support paid to the Institution from bioMerieux and Thermofisher. AK received support from BRAHMS to attend meetings and fulfilled speaking engagements. PH received Lecture honorarium (ThermoFisher Scientific, Beckman Coulter), Educational support honorarium (bioMérieux) Clinical research grants (ThermoFisher Scientific, bioMérieux). DCW is an employee of BRAHMS GmbH, which holds patent rights on the procalcitonin and mid-regional proadrenomedullin assay. All other authors reported no conflicts of interest.
Publisher’s Note
Springer Nature remains neutral with regard to jurisdictional claims in published maps and institutional affiliations.
Author details
1Department of Microbiology, Hampshire Hospitals NHS Foundation Trust,
Winchester and Basingstoke, UK.2University of Southampton, School of
Medicine, Southampton, UK.3B·R·A·H·M·S GmbH, Hennigsdorf, Germany.
4Department of Anesthesiology and Intensive Care Medicine, Jena University
Hospital, Jena, Germany.5Center for Sepsis Control & Care (CSCC), Jena
University Hospital, Jena, Germany.6Division of General and Emergency
Medicine, University Department of Medicine, Kantonsspital Aarau, Switzerland.7Medical Faculty of the University of Basel, Basel, Switzerland. 8Department of Emergency Medicine, Erasmus University Medical Center,
Rotterdam, Netherlands.9Department of Internal Medicine, Skåne University
Hospital, Malmö, Sweden.10Department of Clinical Sciences Malmö, Lund University, Lund, Sweden.11Emergency Department hôpital Pitié-Salpêtrière,
Assistance Publique - Hôpitaux de Paris and Sorbonne Universités GRC-14 BIOSFAST and INSERM UMR-S 1166, Paris, France.12Emergency Department,
Policlinico Tor Vergata, Rome, Italy.13Department of Medical Systems, Universita di Tor Vergata, Rome, Italy.14Department of Emergency Medicine,
Monaco Princess Grace Hospital, Monaco, France.15Department of Critical
Care, Morton Plant Hospital, 300 Pinellas Street, Clearwater, FL 33756, USA.
16
Infectious Disease Unit, Skåne University Hospital, Malmö, Sweden.
17Department of Blood Sciences, Hampshire Hospitals NHS Foundation Trust,
Winchester and Basingstoke, UK.18Department of Rheumatology and Clinical
Immunology, University Medical Center, Utrecht University, Utrecht, Netherlands.19Emergency Department, Hospital Clínico San Carlos, Madrid, Spain.20Gibraltar Health Authority, St Bernard’s Hospital, Gibraltar, Spain. 21Department of Laboratory Medicine, Policlinico Tor Vergata, Rome, Italy. 22Department of Experimental Medicine, University of Rome Tor Vergata,
Rome, Italy.23Rare and Imported Pathogen Laboratories, Public Health England, Porton Down, UK.24Department of Internal Medicine, Erasmus
University Medical Center, Rotterdam, Netherlands.25Department of
Viroscience, Erasmus University Medical Center, Rotterdam, Netherlands.
26
Department of accident and emergency, Hampshire Hospitals NHS Foundation Trust, Winchester and Basingstoke, UK.27Emergency Department,
Instituto de Investigación Sanitaria (IdISSC), Hospital Clínico San Carlos, Madrid, Spain.
Received: 20 July 2018 Accepted: 18 January 2019
References
1. Simpson SQ. SIRS in the time of Sepsis-3. Chest. 2018;153(1):34-8. 2. Singer M, Deutschman CS, Seymour CW, Shankar-Hari M, Annane D, Bauer
M, et al. The third international consensus definitions for sepsis and septic shock (Sepsis-3). JAMA. 2016;315(8):801–10.
3. Seymour CW, Liu VX, Iwashyna TJ, Brunkhorst FM, Rea TD, Scherag A, et al. Assessment of clinical criteria for sepsis: for the third international consensus definitions for Sepsis and septic shock (Sepsis-3). JAMA. 2016;315(8):762–74.
4. Levy MM, Fink MP, Marshall JC, Abraham E, Angus D, Cook D, et al. SCCM/ ESICM/ACCP/ATS/SIS International Sepsis Definitions Conference. Crit Care Med. 2003. 2001;31(4):1250–6.
5. Simpson SQ. New sepsis criteria: a change we should not make. Chest. 2016;149(5):1117–8.
6. Churpek MM, Snyder A, Han X, Sokol S, Pettit N, Howell MD, et al. Quick sepsis-related organ failure assessment, systemic inflammatory response syndrome, and early warning scores for detecting clinical deterioration in infected patients outside the intensive care unit. Am J Respir Crit Care Med. 2017;195(7):906–11.
7. Williams JM, Greenslade JH, McKenzie JV, Chu K, Brown AF, Lipman J. Systemic inflammatory response syndrome, quick sequential organ function assessment, and organ dysfunction: insights from a prospective database of ED patients with infection. Chest. 2017;151(3):586–96.
8. Simpson SQ. Diagnosing sepsis: a step forward, and possibly a step back. Ann Transl Med. 2017;5(3):55.
9. Yebenes JC. Early detection of sepsis: to adapt or to die. Med Clin (Barc). 2017;149(5):209–10.
10. Bermejo-Martin JF, Martin-Fernandez M, Almansa R. Pre-sepsis: a necessary concept to complete the SEPSIS-3 picture? J Crit Care. 2018;44:148. 11. Kumar A, Roberts D, Wood KE, Light B, Parrillo JE, Sharma S, et al. Duration
of hypotension before initiation of effective antimicrobial therapy is the critical determinant of survival in human septic shock. Crit Care Med. 2006; 34(6):1589–96.
12. Leisman DE, Goldman C, Doerfler ME, Masick KD, Dries S, Hamilton E, et al. Patterns and outcomes associated with timeliness of initial crystalloid resuscitation in a prospective sepsis and septic shock cohort. Crit Care Med. 2017;45(10):1596–606.
13. Bloos F, Ruddel H, Thomas-Ruddel D, Schwarzkopf D, Pausch C, Harbarth S, et al. Effect of a multifaceted educational intervention for anti-infectious measures on sepsis mortality: a cluster randomized trial. Intensive Care Med. 2017;43(11):1602–12.
14. Yentis SM, Soni N, Sheldon J. C-reactive protein as an indicator of resolution of sepsis in the intensive care unit. Intensive Care Med. 1995;21(7):602–5. 15. Assicot M, Gendrel D, Carsin H, Raymond J, Guilbaud J, Bohuon C. High
serum procalcitonin concentrations in patients with sepsis and infection. Lancet. 1993;341(8844):515–8.
16. de Kruif MD, Lemaire LC, Giebelen IA, Struck J, Morgenthaler NG, Papassotiriou J, et al. The influence of corticosteroids on the release of novel biomarkers in human endotoxemia. Intensive Care Med. 2008;34(3):518–22.
17. Decker SO, Sigl A, Grumaz C, Stevens P, Vainshtein Y, Zimmermann S, et al. Immune-response patterns and next generation sequencing diagnostics for the detection of mycoses in patients with septic shock-results of a combined clinical and experimental investigation. Int J Mol Sci. 2017;18(8):1796. 18. Gille J, Ostermann H, Dragu A, Sablotzki A. MR-proADM: a new biomarker for
early diagnosis of sepsis in burned patients. J Burn Care Res. 2017;38(5):290–8. 19. Elke G, Bloos F, Wilson DC, Brunkhorst FM, Briegel J, Reinhart K, et al. The
use of mid-regional proadrenomedullin to identify disease severity and treatment response to sepsis - a secondary analysis of a large randomised controlled trial. Crit Care. 2018;22(1):79.
20. Elke G, Bloos F, Wilson DC, Meybohm P. Identification of developing multiple organ failure in sepsis patients with low or moderate SOFA scores. Critical Care [JArticle] 2018;22(1):147.
21. van der Does Y, Limper M, Jie KE, Schuit SCE, Jansen H, Pernot N, et al. Procalcitonin-guided antibiotic therapy in patients with fever in a general emergency department population: a multicenter noninferiority randomized clinical trial (HiTEMP study). Clin Microbiol Infect. 2018;24(12):1281-9. 22. Schuetz P, Hausfater P, Amin D, Amin A, Haubitz S, Faessler L, et al.
Biomarkers from distinct biological pathways improve early risk stratification in medical emergency patients: the multinational, prospective, observational TRIAGE study. Crit Care. 2015;19:377.
23. Bossuyt PM, Reitsma JB, Bruns DE, Gatsonis CA, Glasziou PP, Irwig L, et al. STARD 2015: an updated list of essential items for reporting diagnostic accuracy studies. Clin Chem. 2015;61(12):1446–52.
24. Stalenhoef JE, van Nieuwkoop C, Wilson DC, van der Starre WE, Delfos NM, Leyten EMS, et al. Biomarker guided triage can reduce hospitalization rate in community acquired febrile urinary tract infection. J Infect. 2018;77(1):18–24. 25. Bowden J, Tierney JF, Copas AJ, Burdett S. Quantifying, displaying and
accounting for heterogeneity in the meta-analysis of RCTs using standard and generalised Q statistics. BMC Med Res Methodol. 2011;11:41. 26. Letter FTJ. Nomogram for Bayes theorem. N Engl J Med. 1975;293(5):257.
27. Angus DC, van der Poll T. Severe sepsis and septic shock. N Engl J Med. 2013;369(21):2063.
28. Temmesfeld-Wollbruck B, Hocke AC, Suttorp N, Hippenstiel S. Adrenomedullin and endothelial barrier function. Thromb Haemost. 2007;98(5):944–51. 29. Pittard AJ, Hawkins WJ, Webster NR. The role of the microcirculation in the
multi-organ dysfunction syndrome. Clin Intensive Care. 1994;5(4):186–90. 30. Xie Z, Chen WS, Yin Y, Chan EC, Terai K, Long LM, et al. Adrenomedullin
surges are linked to acute episodes of the systemic capillary leak syndrome (Clarkson disease). J Leukoc Biol. 2018;103(4):749–59.
31. Vigue B, Leblanc PE, Moati F, Pussard E, Foufa H, Rodrigues A, et al. Mid-regional pro-adrenomedullin (MR-proADM), a marker of positive fluid balance in critically ill patients: results of the ENVOL study. Crit Care. 2016;20(1):363. 32. Nierhaus A, Bloos F, Wilson DC, Elke G, Meybohm P, SepNet Critical Care
Trials G. Predicting the requirement for renal replacement therapy in intensive care patients with sepsis. Crit Care 2018;22(1):201.
33. Courtais C, Kuster N, Dupuy AM, Folschveiller M, Jreige R, Bargnoux AS, et al. Proadrenomedullin, a useful tool for risk stratification in high Pneumonia Severity Index score community acquired pneumonia. Am J Emerg Med. 2013;31(1):215–21.
34. Huang DT, Angus DC, Kellum JA, Pugh NA, Weissfeld LA, Struck J, et al. Midregional proadrenomedullin as a prognostic tool in community-acquired pneumonia. Chest. 2009;136(3):823–31.
35. Espana PP, Capelastegui A, Mar C, Bilbao A, Quintana JM, Diez R, et al. Performance of pro-adrenomedullin for identifying adverse outcomes in community-acquired pneumonia. J Inf Secur. 2015;70(5):457–66. 36. Julian-Jimenez A, Yanez MC, Gonzalez-Del Castillo J, Salido-Mota M,
Mora-Ordonez B, Arranz-Nieto MJ, et al. Prognostic power of biomarkers for short-term mortality in the elderly patients seen in emergency departments due to infections. Enferm Infecc Microbiol Clin. 2019;37(1):11-8.
37. Cavallazzi R, El-Kersh K, Abu-Atherah E, Singh S, Loke YK, Wiemken T, et al. Midregional proadrenomedullin for prognosis in community-acquired pneumonia: a systematic review. Respir Med. 2014;108(11):1569–80. 38. Renaud B, Schuetz P, Claessens YE, Labarere J, Albrich W, Mueller B.
Proadrenomedullin improves risk of early admission to ICU score for predicting early severe community-acquired pneumonia. Chest. 2012;142(6):1447–54. 39. Ince C, Mayeux PR, Nguyen T, Gomez H, Kellum JA, Ospina-Tascon GA, et al.
The endothelium in Sepsis. Shock. 2016;45(3):259–70.
40. Andaluz-Ojeda D, Nguyen HB, Meunier-Beillard N, Cicuendez R, Quenot JP, Calvo D, et al. Superior accuracy of mid-regional proadrenomedullin for mortality prediction in sepsis with varying levels of illness severity. Ann Intensive Care. 2017;7(1):15.
41. Travaglino F, De Berardinis B, Magrini L, Bongiovanni C, Candelli M, Silveri NG, et al. Utility of Procalcitonin (PCT) and mid regional pro-Adrenomedullin (MR-proADM) in risk stratification of critically ill febrile patients in emergency department (ED). A comparison with APACHE II score. BMC Infect Dis. 2012;12:184. 42. van der Starre WE, Zunder SM, Vollaard AM, van Nieuwkoop C, Stalenhoef
JE, Delfos NM, et al. Prognostic value of pro-adrenomedullin, procalcitonin and C-reactive protein in predicting outcome of febrile urinary tract infection. Clin Microbiol Infect. 2014;20(10):1048–54.
43. Albrich WC, Dusemund F, Ruegger K, Christ-Crain M, Zimmerli W, Bregenzer T, et al. Enhancement of CURB65 score with proadrenomedullin (CURB65-a) for outcome prediction in lower respiratory tract infections: derivation of a clinical algorithm. BMC Infect Dis. 2011;11:112.
44. Albrich WC, Ruegger K, Dusemund F, Schuetz P, Arici B, Litke A, et al. Biomarker-enhanced triage in respiratory infections: a proof-of-concept feasibility trial. Eur Respir J. 2013;42(4):1064–75.
45. Albrich WC, Ruegger K, Dusemund F, Bossart R, Regez K, Schild U, et al. Optimised patient transfer using an innovative multidisciplinary assessment in Kanton Aargau (OPTIMA I): an observational survey in lower respiratory tract infections. Swiss Med Wkly. 2011;141:w13237.
46. Hartmann O, Schuetz P, Albrich WC, Anker SD, Mueller B, Schmidt T. Time-dependent cox regression: serial measurement of the cardiovascular biomarker proadrenomedullin improves survival prediction in patients with lower respiratory tract infection. Int J Cardiol. 2012;161(3):166–73.


![א Ùæù]<ðˆ¢] Ùæù]<ðˆ¢] Ùæù]<ðˆ¢] Ùæù]<ðˆ¢] E<V E<V E<V E<V áááá DDDD <](data:image/gif;base64,R0lGODlhAQABAIAAAP///wAAACH5BAEAAAAALAAAAAABAAEAAAICRAEAOw==)