HAL Id: hal-01128654
https://hal.archives-ouvertes.fr/hal-01128654
Submitted on 10 Mar 2015HAL is a multi-disciplinary open access archive for the deposit and dissemination of sci-entific research documents, whether they are pub-lished or not. The documents may come from teaching and research institutions in France or abroad, or from public or private research centers.
L’archive ouverte pluridisciplinaire HAL, est destinée au dépôt et à la diffusion de documents scientifiques de niveau recherche, publiés ou non, émanant des établissements d’enseignement et de recherche français ou étrangers, des laboratoires publics ou privés.
to adapt suppression strategies
S. Lahaye, T. Curt, L. Paradis, C. Hély
To cite this version:
S. Lahaye, T. Curt, L. Paradis, C. Hély. Classification of large wildfires in South-Eastern France to adapt suppression strategies. Advances in Forest Fire Research. Chapter 3 - Fire Management, Imprensa da Universidade de Coimbra, pp.696-708, 2014, �10.14195/978-989-26-0884-6_78�. �hal-01128654�
A navegação consulta e descarregamento dos títulos inseridos nas Bibliotecas Digitais UC Digitalis, UC Pombalina e UC Impactum, pressupõem a aceitação plena e sem reservas dos Termos e Condições de Uso destas Bibliotecas Digitais, disponíveis em https://digitalis.uc.pt/pt-pt/termos.
Conforme exposto nos referidos Termos e Condições de Uso, o descarregamento de títulos de acesso restrito requer uma licença válida de autorização devendo o utilizador aceder ao(s) documento(s) a partir de um endereço de IP da instituição detentora da supramencionada licença.
Ao utilizador é apenas permitido o descarregamento para uso pessoal, pelo que o emprego do(s) título(s) descarregado(s) para outro fim, designadamente comercial, carece de autorização do respetivo autor ou editor da obra.
Na medida em que todas as obras da UC Digitalis se encontram protegidas pelo Código do Direito de Autor e Direitos Conexos e demais legislação aplicável, toda a cópia, parcial ou total, deste documento, nos casos em que é legalmente admitida, deverá conter ou fazer-se acompanhar por este aviso.
Classification of large wildfires in South-Eastern France to adapt suppression strategies
Autor(es): Lahaye, S.; Curt, T.; Paradis, L.; Hély, C. Publicado por: Imprensa da Universidade de Coimbra URL persistente: http://hdl.handle.net/10316.2/34295 DOI: http://dx.doi.org/10.14195/978-989-26-0884-6_78 Accessed : 25-Nov-2014 13:08:28 digitalis.uc.pt pombalina.uc.pt
A
dvAnces
in
F
orest
F
ire
r
eseArch
DOMINGOS XAVIER VIEGAS
EDITOR
2014
http://dx.doi.org/10.14195/978-989-26-0884-6_78 Chapter 3 - Fire Management
Advances in Forest Fire Research – Page 696
Classification of large wildfires in South-Eastern France to adapt
suppression strategies
Lahaye S. abc, Curt T. b, Paradis L. c, Hély C. c
a Service Départemental d'Incendie et de Secours des Bouches-du-Rhône, 1 av de Boisbaudran 13326 Marseille France, slahaye@sdis13.fr
b Irstea EMAX Mediterranean Ecosystems and Risks, route Cézanne, 13182 Aix-en-Provence cedex 5 France, thomas.curt@irstea.fr
c Centre de Bio-Archéologie et d’Ecologie, UMR 5059 (CNRS/Univ. Montpellier 2/EPHE), Institut de Botanique, 163 rue A. Broussonet, 34090 Montpellier France,
christelle.hely-alleaume@univ-montp2.fr
Abstract
Large wildfires keep on developing in the French Mediterranean region, regularly threatening responders. We tested if these large fires could be classified into types, and if these types were representative of different environmental drivers. To proceed, we established a database comprising 153 of the largest fires from the last 25 years. For each fire we collected three datasets to describe the environment, the fire behavior and the control operations. We performed a hierarchical clustering analysis followed by a predictive analysis with Bootstrap Regression Trees. Fires were classified in 8 types that could a posteriori be reduced to 5 types. The One-way type was featured by moderate environmental parameters, the Multi-way type was featured by slope, the Winding and Rapid types were featured by wind, while the Very large type was featured by the drought code. Moreover, the probability of having vehicles trapped in a large fire was primarily correlated with the number of vehicles assigned for suppression. This study provides the basis for upcoming trainings of Fire Analyst in France. It paves the way for further research on predictive wildfire danger mapping.
Keywords: Forest fires, Firefighters, Hierarchical classification, Danger, Wind direction, Propagation rate.
Introduction
South-Eastern Mediterranean France is the major fire hotspot region in this country since each year it records about two-thirds of the 4,000 fire ignitions, and the mean annual burned area is 20,000 ha (Promethee 2014). Wildfires in this region constitute a major threat to human life and infrastructures thus generating high damages and costs like in other worldwide Mediterranean regions (San-Miguel-Ayanz et al. 2013). Fires are also a major landscape driver and the main disturbance for many ecosystems (Keeley et al. 2012). Most fires occur during the summer drought period and are crown stand-replacing fires. Wildfires are a major challenge for policy makers due to their costly suppression (San-Miguel-Ayanz et al. 2013).
Wildfires are especially active in South-Eastern France because this region encompasses many fire conducive features: the Mediterranean climate characterized by long summer droughts and frequent strong winds (mistral) (Curt et al. 2011), a high population density inducing numerous fire ignitions in the road and house vicinities (Curt and Delcros 2010), and large connected stands of flammable forests and wildland fuels due to natural afforestation and a positive fire-fuel feedback in shrublands (Curt et al. 2013). The increasing population density and the extension of rural-urban interfaces favor fire ignitions and enhance human vulnerability (Lampin-Maillet et al. 2008). Models for the next decades predict the same trends in land cover and land use changes than along the past decades ; therefore inducing an enlarged expected proportion of vulnerable areas (Moreira et al. 2011).
Advances in Forest Fire Research – Page 697
Based on the climate part of the global change, increase in mean temperature associated with more frequent heat waves should also extend fire seasons and should in turn generate higher pressure on fire suppression forces (Moriondo et al. 2006).
Wildfire size distribution is typically asymmetric with many small fires and few large fires. However, as in many regions around the Mediterranean basin, these large fires are those which threaten the most people and ecosystems (San-Miguel-Ayanz et al. 2013). Definitions for large fires vary according to the context: in France fires larger than 100 ha are generally considered as large. They are 741 among the 442,000 recorded from 1989 to 2013 and archived in Promethee database. They are often characterized by spotting and high rate of spread, these characteristics making them difficult to control, and reducing the range of suppression options (Moreira et al. 2011).
In 1992 a new policy and strategy for French fire prevention and suppression has been established after a number of large and destructive fires along the previous decades (Battesti 1992). First, it is based on improved prediction of daily fire danger, increased communication on fire risk, and banning of human frequentation in forests during the days at risk. Secondly, it relies on a hard-hitting, initial attack of all fires, concentrating all the fire suppression means available (Direction de la Sécurité Civile 1994). This strategy has been proved effective for small-to-medium fires since the mean annual burned area has decreased since 1992, while ignitions have remained rather constant and population and infrastructures have increased (Promethee 2014). However, large and destructive fires still occur every year escaping initial attack and burning hundreds or thousands of hectares.
We hypothesize that large fires will remain frequent in the South of France for two main reasons. First, the improved fire suppression leads to a negative selection to the benefit of the largest ones. This process paradoxically favored by an efficient fire policy has been referred to as the ‘fire paradox’ (Sande Silva et al. 2010): if fire suppression is effective and reduces the area burned, then wildland fuels accumulate and fuel connectivity increases across the landscape, thus increasing in turn the likelihood of large fires when fire suppression forces cannot control them at the initial stage. Secondly, fire suppression forces will face new challenges: climate change will likely favor more intense and more frequent fires and the extension of the area at fire risk while fire suppression crew and equipment may remain constant due to stagnation of financial resources allocated. The firefighters will have to operate on larger territories, including abroad.
All these arguments pledge for better understanding of the large fires and their drivers. We proposed to build a classification of main large fire types and to explore conditions for their propagation. Such classification has already been established for Catalonia (Spain) (Costa et al. 2011). While climate and fuel are similar in both regions, this classification has not been applied for France mainly due to differences in suppression strategies, as well as to coarse database information preventing such analysis. However such knowledge would allow fire brigades to base their intervention on a scientific, fast and robust methodology for forecasting fire risk and fire behavior. This approach is typically that of ‘Fire Analysts’ whose expertise is to predict the likely behavior and danger of a fire in relation to weather, topography and fuels (Castellnou et al. 2010). A high technical level based on scientific analysis has to be promoted to offset the empiric knowledge of local conditions that tends to decrease in Fire Services due to the decline of training over small fires.
In this study we investigated French Mediterranean fires larger than 200 ha that have occurred along the 25 last years in order to answer the two following questions: are there different types of large fires characterized by a typical behavior and typical level of danger for responders? What are the specific environmental drivers (vegetation, topography, fire weather) for these fire types?
Chapter 3 - Fire Management
Advances in Forest Fire Research – Page 698
Materials & methods Fire database
293 wildfires larger than 200 ha are reported on the Promethee database for the 1989-2012 period. To proceed, we collected fire behavior data describing the fire scenario, environmental data describing the fire environment (weather, fuel and topography), and fire suppression data in relation with human response to fire. This data collection required to get sufficiently detailed reports on each fire or to interview fire managers and commanders in 15 different fire agencies throughout the South of France. 38 Fire Officers and Forest Officers in charge of key positions during the fires were questioned and 81 paper or computer reports were investigated. We compiled detailed information for a subset of 153 among the 293 fires. The covered area extends from the Alps to the Pyrenean Mountains including Provence and Languedoc limestone plateaus as well as Corsica Island.
Each fire perimeter has been georeferenced on a dataset stored by the French Forest Department (Office National des Forêts). The accuracy of this database has been previously tested (less than 0.05% difference) by comparing ground collected fire perimeters with remote sensing inferred perimeters (Curt et al. 2013).
All spatial analyses were performed using the open source Geographical Information System
QuantumGIS 2-2 Valmiera (http://www.qgis.org).
Fire behavior data
We investigated three variables of fire behavior. The first one was the final area (SURF, in hectares) representative of the total area burned georeferenced. It can be slightly different from the one registered on the Promethee database which is given by responders sometimes with less accuracy, especially for the oldest fires. We interpreted SURF as an indirect and synthetic indicator which differentiates the large fires (hundreds of hectares) from the very large ones (thousands of hectares).
The second variable was the mean rate of propagation (HaH, in hectares per hour), featuring the overall fire increase and not only its axial rate of spread. It was extrapolated from both officer interviews and post-fire reports. The method consisted in rebuilding the isochrones of fire propagation. Assuming that the precise time of ignition and the final time of extinction were difficult to know, we focused only on the 10 to 90% extension of final area burned of each fire. Rapid fires were interpreted as dangerous since they spread more rapidly than the fighting resources can move.
The third variable was the angle change of the main propagation direction (DIRCHG). It was investigated assuming that changes result from specific combination of environmental data. When the main axis of the fire trajectory opened to an angle lower than 60°, it was considered as a non-significant change of direction (coded as 0). When the direction angle change was higher than 60° but less than 90° with constant wind, it was assumed to be a ‘winding’ fire (coded as 1). In all other cases with angle change higher than 90°, it was coded as 2. These fire direction changes are challenging for responders since they modify the position of active fire lines.
Environmental data
Weather during a fire event is crucial for explaining its size, its shape, and its danger (Pyne et al. 1996). Fire weather is often assessed using the Fire Weather Index (FWI), which is an integrative and unitless index that was designed originally to forecast fire risk in Canada on the basis of daily past and current weather conditions (Van Wagner 1987). The FWI consists of six components accounting for air temperature, relative humidity, surface wind speed, and the last 24-hour rainfall (Groot et al. 2007). The FWI and its sub-indices provides a uniform, numeric method of fire danger rating throughout an area and have been extensively used in the Mediterranean basin regions (Giannakopoulos et al. 2012). In this study we computed the FWI and its sub-indices for each fire using a daily integrative model on a 2 * 2 km grid. As some fires were very large, each of them was assigned the mean value of the index
Advances in Forest Fire Research – Page 699
within the fire perimeter. We especially focused on: (i) the duff moisture code (DMC), representative of the average moisture content of loosely compacted organic layers of moderate depth, it gives an indication of fuel consumption in medium-size woody material such as shrubs; (ii) the drought code (DC), representative of the average moisture content of deep, compact, organic layers, it indicates the seasonal drought effects on forest fuels. By selecting these two indexes, we integrated together rainfall, temperature and relative humidity. We chose to directly use the wind speed variable (WINDSP in meters per hours) without going through the fine fuel moisture code of the FWI because this last sub-index has been recognized to be nearly saturated during the entire summer season in Mediterranean region. WINDSP values were collected from the closest weather station to the fire (Meteo France 2014).
Vegetation composition within the area burned was characterized using the 1986 and 2006 French Forest Institute maps (Institut Forestier National, BDForêtV1; http://inventaire-forestier.ign.fr). These maps being updated from inventories performed every 10 years, the last statement before fire was considered. The vegetation type of every 2.25Ha forest or natural unit is given from photo interpretation of aerial images in infrared color. Depending on the inventory date, there were up to 75 different fuel classes that we aggregated in only four classes for the purpose of this study: broadleaved forests, pine forests, shrublands and other – this last class covering all agricultural, grassland and urban spaces. The considered data were the percentage of each vegetation class within the area burned. The average slope for each fire was obtained by crossing the Digital Elevation Model from the National Geographical Institute (Institut Geographique National, BDAlti25; http://www.ign.fr) with the layer of fire final area.
Fire suppression
We collected the number of vehicles considered as terrestrial resources (RESS) and indicative of the means for suppression. The chosen value represents the maximum number of fire appliances simultaneously committed, excluding logistic support and command vehicles.
Any reported accident injuring a responder or destroying an appliance was finally pointed as a trap (TRAP). The cases of little diseases, very common on such large fires and often linked to warmth and efforts in smoky conditions were not considered. Neither were traffic accidents of responders outside the fire perimeter.
Data analysis
All statistical tests and modeling were performed using the statistics program R (R Core Team 2013). The final area (SURF) and mean rate of propagation (HaH) variables were both divided into three classes each using the Jenks natural optimization method which minimizes each class average deviation from the class mean, while maximizing each class deviation from the means of the other groups (Jenks 1967).
A first fire classification was performed on fire behavior data, using the R Cluster package (Maechler
et al. 2013). The Partitioning Around Medoids (PAM) method was used with Euclidean distances and
standardized data (Reynolds et al. 1992). Results were plotted on a map to identify homogeneous areas in term of fire types.
To assess the influence of the environmental data on each fire class, we used the Bootstrap Regression
Trees (BRT). This statistical method is particularly suitable to explore ecological drivers and to
optimize the predictive performances (De'Ath 2007). Furthermore, it is flexible and easy to read (Elith
et al. 2008) and it considers any collinearity among variables. We proceeded with the dismo and gbm
packages (Hijmans et al. 2013; Ridgeway and others 2013) using a Bernoulli type error. Several regression trees were calculated on calibration data using a “boosting” process. Half the dataset was used to build the model and the other half to test the class accuracy. The number of trees in each BRT was automatically set at 20 with a 0.5 fraction and a 0.005 learning rate. We assessed model prediction
Chapter 3 - Fire Management
Advances in Forest Fire Research – Page 700
accuracies using the area below the receiving operator curve (AUC) (Pearce and Ferrier 2000). The performance was considered as excellent when AUC>0.9 and weak when AUC<0.6.
In order to assess if the types isolated with BRT correspond to different level of danger for responders, we calculated for each of them the rate of fire where resources were trapped and the Student confidence interval (Eq.1) where this rate would have been statistically supposed to be:
CI= [f-z/2√(f(1-f)/(n-1)) ; f+z/2√(f(1-f)/(n-1))] (Eq.1)
with CI the interval with probability, f the rate of trap in the database, z/2 Student coefficient, and
n number of fires in the type.
Assuming that the probability to have resources trapped (TRAP) is closely linked to the quantity of resources assigned (RESS), the correlation between these two parameters was tested separately with a parametric test of average comparison (Eq.2):
H0: μ1=μ2, with CI(μ1-μ2) = [(ā1- ā2) - z/2 *s√(1/n1+1/n2) ; [(ā1- ā2) + z/2 *s√(1/n1+1/n2)] (Eq.2)
where, for each of both distributions 1 (number of vehicles on fires with trap) and 2 (number of vehicles on fires without trap), μ is the population mean, ā the observed mean, n number of fires in the distribution and s the weighted variance of both distributions.
Results
Collected datasets
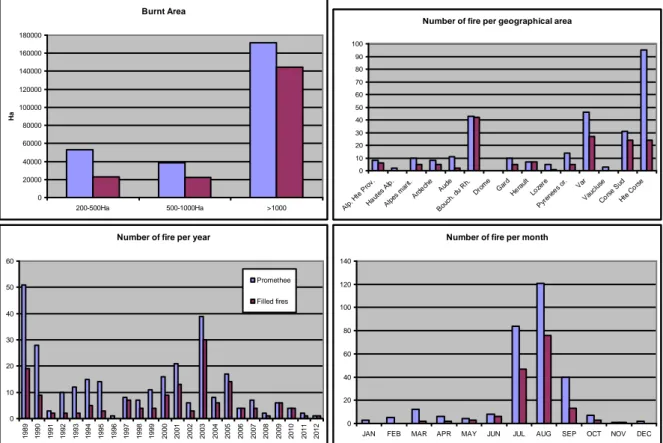
The 153 fire dataset distribution was compared with the 293 fires recorded in the Promethee database (Figure 1). The very large fires, which are generally the best documented, are better represented in the present study: 74% of the > 1000 Ha events versus 42% of the 200-500 Ha fires. If geographical distribution of data partly results from the ability to access different regional agency records, the underrepresentation of Haute Corse, where the number of large fire was the most important, is likely explained by the fact that in this territory written reports were few, thus we investigated only through interview and therefore we focused on the post-1995 fires. Moreover, the oldest are the fires, the less information is available, arguing why the 153 dataset includes 37% of 1989-1999 incidents versus 72% of 2000-2012 incidents. Finally, the seasonal variability is clearly represented with 93% of large fire occurrences recorded from June and September.
Dealing with the fire behavior and environmental datasets (Tabl. 1), the windspeed values spread nearly totally on the Beaufort scale, varying from “calm” to “storm” with a mean being “fresh breeze”. The averaged drought index values can be considered as exceptionally high compared to original North-American classification values (Van Wagner 1987). Thus the fires studied here have spread with variable windspeeds but often with important or very important fuel dryness. Shrubland is the most represented vegetation type in areas burned. Most forest stands are dominated by pine, while pines can also be mixed with broadleaved species, generally oak trees.
Data on fire direction change and suppression showed that among the 153 fires, winding was present on 16% of the fires (DIRCHG=1) and a shift on 22% (DIRCHG=2), while 16% of the fires recorded an accident (25 TRAP records).
Advances in Forest Fire Research – Page 701
Table 1. Recorded data: windspeed (WINDSP) ; Drought Code (DC), Duff Moisture Code (DMC) ; average slope (SLOPE) ; shrubland (SHRUB), pine (PINE), broadleaved (BRDLV), other fuel (OTHER) ; number of vehicles
(RESS) ; prpagation rate (HaH) ; area burned (SURF).
WINDSP DC DMC SLOPE SHRUB PINE BRDLV OTHER RESS HaH SURF
Unit (km.h-1) (--) (--) (degre) (ratio) (ratio) (ratio) (ratio) (engine)
(ha.h -1) (Ha) Mean 32 650 146 15 0.61 0.19 0.08 0.11 95 163 1239 Stand.dev. 17 193 81 7 0.30 0.25 0.13 0.16 83 208 1738 Min. 0 24 18 3 0.00 0.00 0.00 0.00 9 1 208 Max. 90 1067 376 35 1.00 1.00 0.57 0.93 400 1359 14020 Fire classification
According to Jenks method results, the final area burnt was splitted in three classes: the 200-1990 Ha class including 84% of the fire, the 2000-7000 Ha class including 15% and the > 7000 Ha class representative of the remaining 1%. In the same way, the three classes for the propagation rate were 1-219 Ha/H for 78%, 220-800 Ha/H for 19% and > 800 for 3% of the fires.
The PAM clustering was optimal with seven groups based on a strong structuration with an average proximity of data of 87% and six of the seven groups with an average proximity > 50%. We gave a describing name to each group based on the three investigated variables (Tabl.2).
In the first three groups, fires have not reached very important area burnt neither very important propagation rate. Among them, the One-way represents fires with linear direction, the Winding fires with angled propagation axis and the Multi-way includes fires that totally changed their propagation axis. The fourth group is named Vast because fires have reached an important area with a moderate rate of spread. Finally, the last three groups represent fires that developed the most rapidly, even
Burnt Area 0 20000 40000 60000 80000 100000 120000 140000 160000 180000 200-500Ha 500-1000Ha >1000 Ha
Number of fire per geographical area
0 10 20 30 40 50 60 70 80 90 100 Alp . Hte Pro v. Hau tes Alp . Alp es m arit. Ard eche Aud e Bou ch. d u R h. Dro me Gar d Her ault Loze re Pyr enee s or . Var Vau clus e Cor se S ud Hte Cor se
Number of fire per year
0 10 20 30 40 50 60 1989 1990 1991 1992 1993 1994 1995 1996 1997 1998 1999 2000 2001 2002 2003 2004 2005 2006 2007 2008 2009 2010 2011 2012 Promethee Filled fires
Number of fire per month
0 20 40 60 80 100 120 140
JAN FEB MAR APR MAY JUN JUL AUG SEP OCT NOV DEC
Chapter 3 - Fire Management
Advances in Forest Fire Research – Page 702
extremely quickly concerning the Mega. Among these three groups only fires in the Rapid did not reach the final area burnt of 2000Ha.
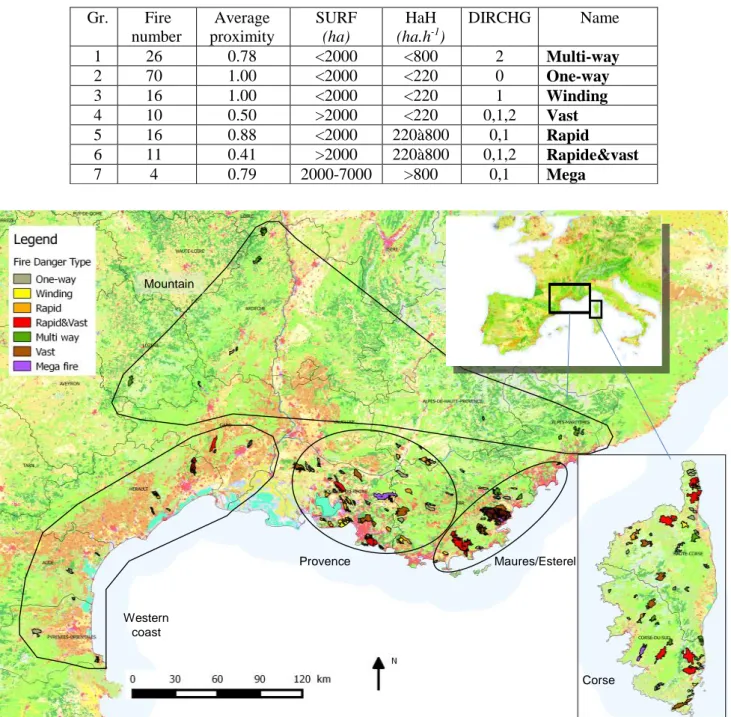
When visually analysed, the spatial distribution of fire groups displays five areas (Figure 2): Western coast (Pyrénées-Orientales, Aude, Hérault and southern Gard), Provence (Bouches-du-Rhône and western Var), Maures/Esterel (Eastern Var and west of Alpes-Maritimes), Mountain (North and east of Alpes-Maritimes, Alpes-de-Haute-Provence, Gard cévenol, Ardèche and Lozère) and finally Corsica (Corse). Three of these areas (Provence, Maures/Esterel and Corsica) seem to be particularly affected by the largest fires but more information would be required to go further in the spatial interpretation, which is out of the present study scope.
Table 2. Fire group based on the PAM clustering and fire number in each group. Each group is assumed to be homogeneous when the average proximity is > 0.5. The group specifications are given for each variable used in the
clustering : SURF, HaH, DIRCHG. The final name outlines these specifications.
Gr. Fire number Average proximity SURF (ha) HaH (ha.h-1) DIRCHG Name 1 26 0.78 <2000 <800 2 Multi-way 2 70 1.00 <2000 <220 0 One-way 3 16 1.00 <2000 <220 1 Winding 4 10 0.50 >2000 <220 0,1,2 Vast 5 16 0.88 <2000 220à800 0,1 Rapid 6 11 0.41 >2000 220à800 0,1,2 Rapide&vast 7 4 0.79 2000-7000 >800 0,1 Mega Western coast Provence Maures/Esterel Corse Mountain
Advances in Forest Fire Research – Page 703
BRT
The number of fires in groups 4 (Vast) and 7 (Mega) being insufficient to get convincing results with the BRT method, we gathered all the fires over 2000Ha, ie Vast, Rapid&vast and Mega, in a unique group thereafter called Very large.
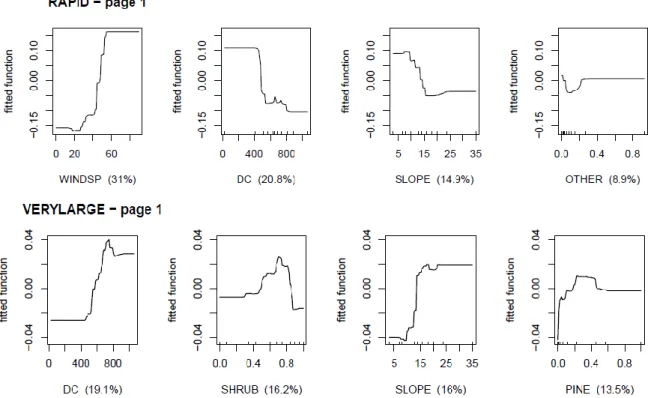
Positive values of fitted function for each variable determine the data scale linked to the given group (Fig.3). Thus, fires in the One-way group are substantially linked to low slope (<12°) with large parts of shrublands (>85%, ie the upper quartile of the distribution), moderate wind (<40 km/h) and low DC (<600 ie the lower third). The Multi-way fires are in relation with strong slopes (>17° ie the upper third), >50% of pine and <40% of shrublands. The Winding fires occur with >75% of shrublands, DC>750 (extreme value, upper quartile) and significant wind (>30km/h). The Rapid fires firstly happen with strong wind (>40 km/h ie the upper third), moderate DC (<500) and slope under 12°. Finally, the Very large fires are linked with important DC (>600), between 50 and 90% of shrublands in the landscape and low slope (<13°),.
Chapter 3 - Fire Management
Advances in Forest Fire Research – Page 704
Figure 3. Variance of the 4 most significant variables for each group (horizontal panel including 4 subpanels): One-way, Multi-One-way, Winding, Rapid and Very large.
We propose in Fig.4 a logical dichotomous synthetizing key to deduce the most likely large fire subtype from environmental data highlighted in the different fire groups. Low DC and low slope will give One-way or Rapid fire subtypes depending on the wind. High DC values will generate the
Winding subtype with strong wind and the Very large subtype with strong slope. Strong slope will
mainly lead in Multi-way subtype.
Figure 4. Synthesis of expected fire subtypes according to environmental data.
Vehicle traps
There is no significant difference in any fire group ratio with the overall mean value of 0.16 calculated from the entire studied database, even with a 90% confidence interval (Tabl.3). Nevertheless, based on the regional distribution, we found a significant higher risk in Provence and lower risk in Corsica than elsewhere in average.
DC < 600 DC > 600 Wind < 40km/h Wind > 40km/h Wind > 30km/h One-way Rapid Winding Very large Slope > 17° Slope < 13° Slope > 13° Multi-way
Advances in Forest Fire Research – Page 705
Table 3. Accident ratio (TRAP) and 90% confidence interval for each group and area.
Name Fire nb. TRAP ratio 90% C.I.
Group Multi-way 26 0.11 0.03 – 0.28 One-way 70 0.17 0.09 – 0.23 Winding 16 0 0 – 0.32 Rapid 16 0.31 0 – 0.32 Very large 25 0.20 0.03 – 0.29 Area Corsica 48 0.06 0.07 – 0.24 Maures/Esterel 18 0.11 0 – 0.31 Provence 52 0.27 0.07 – 0.24 Western coast 18 0.22 0 – 0.31 Montain 17 0.12 0 – 0.32
Finally, the homogeneity test of mean values of resources assigned with a 99% confidence
interval (CI(μ1-μ2) = [31 ; 119]) showed that there are significantly more accidents in fires with
numerous assigned resources.
Discussion
A suitable classification for France
One of the aims of this study was to check if large fires in South of France could be classified into subtypes. We have found that 46% of them are One-way and 10% are Winding. That means that 56% of the fires are mainly driven by a constant wind, which may locally take a different direction due to terrain. A small part of fires (17%) belongs to the Multi-way subtype. The change of wind direction can either result from a reverse of topographic breeze or from a wind shear, which is frequent in the Maures/Esterel area. Whatever the cause, the fire behavior can be anticipated for this subtype thanks to an adequate knowledge of the local meteorology. Finally, the two last subtypes, Rapid (10%) and
Very large (16%), regroup the fires for which the fighting operations are the most difficult, the less
effective and the most dangerous for suppression crews. These fires burned the largest area or reached the fastest propagation rate, sometimes both together.
To our knowledge, there are only similar studies for the Mediterranean region in Catalonia (Spain), conducted by Castellnou et al. (Castellnou et al. 2010). While we similarly investigated historical fires, we however used a slightly different methodology. Indeed, while the Catalan team considered the synoptic regional weather for each analysed fire, we focused on FWI index parameters in the vicinity of each fire. Moreover, we did not consider the three types of fires commonly accepted (i.e.topographic, wind driven and plume dominated), but we rather observed how our fires were naturally distributed in our study area considering their direction changes and their rate of propagation. Our results are convincing, introducing new subtypes of fires, and call for further research, especially on explosive or convective issues.
Environmental data as driver of fire types
Our large fire types were driven by environmental data, especially Drought Code, Windspeed and Slope. On The fact that the Duff Moisture Code has not been identified as a driver of any type of large fire could suggest that it may rather characterize smaller fires than 200Ha but this would need more investigations.
We have not kept the fuel composition as a determining factor because the shrubland cover raised as an explaining variable in almost every type. Indeed its fitted functions were all providing information in the same way, with shrub cover being positively correlated to the fire types. Multi-way fires are the
Chapter 3 - Fire Management
Advances in Forest Fire Research – Page 706
exception with shrub cover being negatively correlated to the type and pine and broadleaved cover being positively correlated (the broadleaved signal was nearly flat, so difficult to read). In conclusion, we haven’t found relevant to consider forest cover as a driver of Multi-way fires since it is an evidence that mountainous areas are the most propitious to this type of fire and together the most forested. The drivers of this fire type are thought to be more likely mountainous environment with wind breezes.
Link between number of resources assigned and trap probability
No fire type was significantly more propitious to endanger responders. Nevertheless, the trap likelihood was positively correlated to the number of vehicles assigned for suppressing fire. That is likely why accidents are prevalent in Provence area where there is a need to deploy many trucks to protect all the houses threatened by any fire. Conversely, accidents are less frequent in Corsica where the number of engines is much smaller.
Possible bias in the data
The large fire types we found are based on data coming from reports and interviews that may be partly subjective. Indeed, we called for data records up to 25 years after fires occured in order to rebuild fireline isochrones. Nevertheless, the accuracy of this oral information has been generally tested with crossing the interviews or comparing them to factual archived data.
Moreover, the type of fuel could likely be the less accurate of environmental variables since the vegetation cover was based on geodatabases up to 10 years old. Within this time interval, some land use changes can have occurred such as afforestation of agricultural parcels. That is another reason why fuel data has been interpreted with caution.
Conclusion: implications for fire suppression
In this study we have provided the first classification of large fires dedicated to help fire suppression in South-Eastern France. We have stated several large fire types characterized by their typical fire behavior and environmental drivers. These fire types range along a gradient of difficulty for fire suppression. Some types are predictable using their typical environmental drivers, which suggest that improvements in fire suppression safety and efficiency are possible using this approach.
The basis for classification being established, it is now challenging to have further research on certain types of fire. In particular, we have to investigate ‘explosive’ fires and convective behaviors to link them to responder traps. Further studies should also focus on the geographical distribution of different groups of fire.
In the workplace, first Fire Analyst trainings are in process in Europe for responders. This study will contribute to set the foundations for training program by proposing a typology related to environmental drivers for Mediterranean France.
Acknowledgements
This study has been funded by the Service Departemental d’Incendie et de Secours (SDIS) 13 through S. LAHAYE’s lifelong learning. It would not have been possible without the valuable debriefings of firefighters and foresters from Alpes-de-Hautes-Provence, Alpes-Maritimes, Ardèche, Aude, Bouches-du-Rhône, Corse, Var, Gard, Herault, Pyrennées-Orientales and Var. We thank Marine PASTUREL for her help in data processing.
References
Battesti JP (1992) Projet feux de forets; rapport d'étape. Ministère de l'intérieur; Direction de la sécurité civile (Paris)
Advances in Forest Fire Research – Page 707
Castellnou M, Larranaga A, Miralles M, Vilalta O, Molina D (2010) Wildfire Scenarios: Learning from Experience. European Forest Institute (Joensuu)
Costa P, Castellnou M, Larranaga A, Miralles M, Kraus D (2011) Prevention of large wildfires using the fire types concept. Fire Paradox European Project (Generalitat de Catalunya)
Curt T, Borgniet L, Bouillon C (2013) Widfire frequency varies with the size and shape of fuel types in southeastern France: Implications for environmental management. Journal of Environmental
Management 117.
Curt T, Delcros P (2010) Managing road corridors to limit fire hazard: a simulation approach in southern France. Ecological Engineering 4, 1-12.
Curt T, et al. (2011) Litter flammability in oak woodlands and shrublands of southeastern France.
Forest Ecology and Management 261, 2214-2222.
De'Ath G (2007) Boosted trees for ecological modeling and prediction. Ecology 88, 243-251.
Direction de la Sécurité Civile (1994) Guide de stratégie générale pour la protection de la forêt contre l'incendie. Ministère de l'intérieur (Paris)
Elith J, Leathwick JR, Hastie T (2008) A working guide to boosted regression trees. Journal of Animal
Ecology 77, 802-813.
Giannakopoulos C, et al. (2012) Comparison of fire danger indices in the Mediterranean for present day conditions. iforest-Biogeosciences and Forestry 5, 197-203.
Groot WJd, Field RD, Brady MA, Roswintiarti O, Mohamad M (2007) Development of the Indonesian and Malaysian Fire Danger Rating Systems. Mitigation and Adaptation Strategies for Global
Change 12, 165-180.
Hijmans RJ, Phillips S, Leathwick J, Elith J (2013) dismo: Species distribution modeling. R package version 0.9-3.
Jenks GF (1967) The Data Model Concept in Statistical Mapping. International Yearbook of
Cartography 7, 186-190.
Keeley J, Bond W, Bradstock R, Pausas J, Rundel P (2012) Fire in Mediterranean Ecosystems. Ecology, Evolution and Management. Cambridge University Press 450 pp.
Lampin-Maillet C, Long M, Jappiot M (2008) A Method for Characterising and Mapping Habitat/Forest Interfaces - a Means for Preventing Forest Fires. Revue Forestiere Francaise
(Nancy) 60, 363-380.
Maechler M, Rousseeuw P, Struyf A, Hubert M, Hornik K (2013) cluster: Cluster Analysis Basics and Extensions.
Meteo France (2014) http://www.meteofrance.com
Moreira F, et al. (2011) Landscape - wildfire interactions in southern Europe: Implications for landscape management. Journal of Environmental Management 92, 2389-2402.
Moriondo M, Good P, Durao R, Bindi M, Giannakopoulos C, Corte-Real J (2006) Potential impact of climate change on fire risk in the Mediterranean area. Climate Research 31, 85-95.
Pearce J, Ferrier S (2000) Evaluating the predictive performance of habitat models developed using logistic regression. Ecological Modelling 133, 225-245.
Promethee (2014) Base de données sur les incendies de forêt en région méditerranéenne en France depuis 1973. https://www.promethee.com/.
Pyne SJ, Andrews PL, Laven RD (Eds) (1996) 'Introduction to wildland fire.' (John Wiley and Sons Publishing)
R Core Team (2013) R: A Language and Environment for Statistical Computing. (R Foundation for Statistical Computing Publishing: Vienna, Austria)
Reynolds A, Richards G, De la Iglesia B, Rayward-Smith V (1992) Clustering rules: A comparison of partitioning and hierarchical clustering algorithms. Journal of Mathematical Modelling and
Algorithms 5, 475–504
Chapter 3 - Fire Management
Advances in Forest Fire Research – Page 708
San-Miguel-Ayanz J, Manuel Moreno J, Camia A (2013) Analysis of large fires in European Mediterranean landscapes: Lessons learned and perspectives. Forest Ecology and Management
294, 11-22.
Sande Silva J, Rego F, Fernandes P, Rigolot E (2010) Towards Integrated Fire Management - Outcomes of the European Project Fire Paradox. (Joensuu)
Van Wagner C (1987) Development and structure of the Canadian Forest Fire Weather Index System. Canadian Forestry Service (Ottawa)