HAL Id: hal-01496741
https://hal.archives-ouvertes.fr/hal-01496741
Preprint submitted on 27 Mar 2017
HAL is a multi-disciplinary open access
archive for the deposit and dissemination of sci-entific research documents, whether they are pub-lished or not. The documents may come from
L’archive ouverte pluridisciplinaire HAL, est destinée au dépôt et à la diffusion de documents scientifiques de niveau recherche, publiés ou non, émanant des établissements d’enseignement et de
Export management and incomplete VAT rebates to
exporters: the case of China
Julien Gourdon, Laura Hering, Stéphanie Monjon, Sandra Poncet
To cite this version:
Julien Gourdon, Laura Hering, Stéphanie Monjon, Sandra Poncet. Export management and incom-plete VAT rebates to exporters: the case of China. 2017. �hal-01496741�
fondation pour les études et recherches sur le développement international
LA FERDI EST UNE FOND
ATION REC ONNUE D ’UTILITÉ PUBLIQUE . ELLE ME T EN ŒUVRE A VEC L ’IDDRI L ’INITIA TIVE POUR LE DÉ VEL OPPEMENT E
T LA GOUVERNANCE MONDIALE (IDGM).
ELLE C
OORDONNE LE LABEX IDGM+ QUI L
’ASSOCIE A U CERDI E T À L ’IDDRI. CE TTE PUBLIC ATION A BÉNÉFICIÉ D ’UNE AIDE DE L ’É TA T FR ANC AIS GÉRÉE P AR L ’ANR A U TITRE DU PR OGR A MME «INVESTISSEMENT S D ’A VENIR» POR
TANT LA RÉFÉRENCE «ANR-10-LABX
-14-01».
Abstract
Compared to most countries, China’s value-added tax (VAT) system is not neutral and makes it less advantageous to export a product than to sell it domestically, as export-ers may not receive a complete refund on the domestic VAT they have paid on their inputs. However, the large and frequent changes to the VAT refunds which are offered to exporters have been led China to be accused of providing its firms with an unfair advantage in global trade. We use city-specific export-quantity data at the HS6-product level over the 2003-12 period to assess how changes in these VAT rebates have affected Chinese export performance. Our identification strategy relies on triple difference estimates that exploit an eligibility rule which disqualifies processing trade with sup-plied materials from these rebates. We find that changes in VAT rebates have significant export repercussions: eligible export quantity for a given city-HS6 pair rises by 6.5% following a one percentage-point increase in the VAT rebate. This magnitude yields a better understanding of the strong resistance of Chinese exports during the global recession, in which export rebates increased substantially.
Keywords: VAT System, export tax, export performance, China JEL codes: F10, F14, O14
Export management and
incomplete VAT rebates to
exporters: the case of China
Julien Gourdon, Laura Hering,
Stéphanie Monjon, Sandra Poncet
Julien Gourdon, is an Economist at CEPII. Email : julien.gourdon@cepii.fr
Laura Hering, is an Assistant Professor at the Department of Economics, Erasmus University, Rotterdam. Email: laura.hering@gmail.com
Stéphanie Monjon, is an Assistant Professor of Economics at the University Paris Dauphine. She is also research associate at CEPII. Email: stephanie.monjon@dauphine.fr
Sandra Poncet, the corresponding author, is a Professor at the Paris School of Economics (University of Paris 1), and scientific advisor at CEPII. She is Senior Fellow at Ferdi since 2012.
Email: sandra.poncet@univ-paris1.fr
Wo
rking Paper
Dev
elopment Po
lic
ie
s
December2014
117
“Sur quoi la fondera-t-il l’économie du monde qu’il veut
gouverner? Sera-ce sur le caprice de chaque particulier? Quelle
confusion! Sera-ce sur la justice? Il l’ignore.”
1
Introduction
The 2010 Global Trade Alert Report identified China’s system of Value Added Tax (VAT) rebates for exporters as the most important discriminatory state measure in terms of trade covered during the recent crisis (Global Trade Alert, 2010). The charge may first seem surprising insofar as China, contrary to most countries with a VAT system, does not fully refund the VAT on exports. Instead, exporters may receive VAT rebates that vary across commodities, and range from zero to the full refund of the typical 17% VAT rate. The Chinese VAT system thus imposes a tax on exporters whose goods receive a VAT refund rate lower than the applicable VAT rate.1
Two features have been highlighted as evidence that this VAT rebate system is never-theless a systematic form of export management, providing Chinese exporters with an ad-vantage with respect to foreign competitors (Evenett et al., 2012). First, there is tremendous variation across goods in the levels of and changes to the VAT rebates. Second, no other country amends its VAT rebates so often. Over the last decade, export VAT rebate rates
have been adjusted frequently, both upwards and downwards (WTO, 2010).2 In particular,
since the beginning of the global financial crisis in 2008, China has increased VAT rebate rates several times. In contrast to many other countries, China’s exports resisted rather well during the crisis and more than sextupled between 2002 and 2012, growing two times faster
1
The Value Added Tax (VAT) is an indirect consumption tax: it is paid to the revenue authorities by the seller of the goods, who is the “taxable person”, but it is actually borne ultimately by the final consumer. Most countries, including also the EU countries, the US and Japan, leave no residual VAT contained in the export price to avoid double taxation on final consumption: exports are not subject to VAT and VAT exporters have paid on inputs is refundable. In China, while exports are not subject to VAT, the authorities do not routinely reimburse the full VAT exporters have paid on their inputs. This makes it less advantageous to export a product than to sell it domestically.
2
In total, over the 2002-12 period, 89% of the products at the HS6-product level underwent at least one change in their VAT-refund rate.
than the world exports over that period.
This paper proposes a careful evaluation of the effects of the frequent movements in the Chinese VAT rebate system on the quantity exported. Our empirical analysis relies on product-level export data for 327 cities over the 200012 period. The rebate system is used to penalize commodity hungry, polluting and low added value products (Chan, 2008). Those product categories would get a reduced VAT rebate, while high technology and high added value products would benefit from more incentives. However, contrary to other forms of public intervention such as currency manipulation, multiple subsidies and trade protection, the rather confusing system of tax rebates for exporters in China has largely been overlooked. Our paper hence investigates the effectiveness of what appears to be a major instrument of Chinese industrial policy.
Theoretically, as in Feldstein and Krugman (1990), incomplete export VAT rebates
amount to export taxes and lead to lower exports.3 The immediate effect of a VAT rebate
cut, if it is not passed through to prices, is a fall in exporters’ profits. This may encourage manufacturers to change their mix of production and reorient their sales domestically. If exporters pass rebate cuts through to prices then foreign importers might consider alterna-tive sources of supply. Both of these responses lead to lower export production. In parallel, exports are expected to rise following an increase in the VAT refund rate. Conversely, the literature is relatively silent on whether exporters will actually react symmetrically to rises and falls in the rebate.
Only little work has considered the impact of VAT rebates in China. Chen et al. (2006) use aggregate data from 1985 to 2002 and find that export VAT rebates are positively
3
correlated with the country’s exports, final domestic consumption, and foreign exchange
reserves.4 Chandra and Long (2013) use firm-level panel data for 2004-2006 and find a
positive association between firm export volume and the average rebate rate (over exports) in the firm’s industry-province pair.5
We here depart from this analysis as we directly link the rebate at a very detailed product level (HS6) to corresponding Chinese exports and study an extended period of ten years. Moreover, we build on recent efforts to address the problem of omitted variables which has traditionally hindered the evaluation of the impact of trade policies on export performance. It is indeed likely that the timing and scope changes in the refund rate are correlated with various broader economic variables, such as worldwide economic conditions and product characteristics, as well as other industrial policies which likely affect export performance. Chinese authorities may have simultaneously increased VAT rebates and implemented other trade-promotion measures. We then risk over-estimating the positive export effects of VAT refunds. Another problem comes from reverse causality: export VAT rebate rates may increase to boost the exports of poorer-performing products or, on the contrary, of those commodities with greater export-growth potential. In both cases we have endogeneity.
Our main strategy to counter endogeneity exploits variations in the expected impact of the VAT rebates by trade regime, which comes from an eligibility rule disqualifying processing trade with supplied materials from the rebates. The typical export VAT policy is that of “exempt, credit, and refund” (or “refund after collection”). By contrast, the “no collection and no refund” policy applies to processing trade with supplied inputs. In this type of
4
However, the size of their sample is limited to 18 observations. 5
The explanatory variable in this study is the average ratio of the value of VAT rebates over exports, calculated over all exporting firms in the same province, 2-digit industry and year. This is instrumented by a proxy for local fiscal conditions.
trade, the firm undertakes processing or assembly work on materials it does not own. Even if the exporter pays VAT on local purchases, there is no entitlement to any export refund. We thus expect VAT rebates to only have an effect on eligible export activities (ordinary and processing trade with imported materials).6 We use HS6-product level export data for a panel of Chinese cities and isolate the causal effect of the VAT rebates using a triple difference estimate. We compare the difference in export quantity growth between eligible and non-eligible transactions of products for which the rebate grew sharply to that of products where it grew more slowly.
Our key explanatory variable is an interaction between the VAT rebate at the product level and a dummy for eligible trade. Our benchmark regression also includes product-year specific fixed effects, in order to capture all factors that affect all exports (both eligible and non-eligible flows) for a given product in a year. We further introduce various controls, notably we account for factors that are common to exports of a given regime type for a specific product in a given city through product-regime dummies and time-varying city-level industry characteristics by regime type via city-sector-regime-year dummies.
Three factors may limit the effectiveness of a rise in VAT rebates to encourage export activity in China. First, Chandra and Long (2013) suggest that a rise in the official rates may not materialize in larger actual rates of VAT rebates received by exporters. Part of the fiscal burden for paying such rebates is the responsibility of the local governments which may not have the sufficient fiscal conditions to meet the expenses. Second, the relatively low
profit margins of Chinese exporters7 may make them eager to absorb VAT rebates increase
6
This expectation builds on the assumption of exogeneity of the choice of the trade regime with respect to the VAT rebates. Our results will show that non-eligible exports are unrelated to the VAT rebate.
7
in their markups so that their export volumes are less sensitive. 8. Third, the relatively high shares of imported content used in Chinese exports could dampen the positive repercussions on profits from a rise in VAT rebate rates,9 making it less likely to be passed through to prices and result in larger export quantities.
Our focus on export quantities is motivated by growing evidence on the underreporting of export values by exporters to avoid paying taxes (VAT or processing taxes) based on export value (Ferrantino et al., 2012). Quantities are more easily observable by customs authorities and hence may be less subject to misreporting. Fisman and Wei (2004) find prevalent underreporting of the total value imported to China from Hong-Kong but not significant misreporting of total quantities. We complement the quantity estimates with results on unit values to infer the impact of a rebate change on the pricing strategy of the exporter. Our paper is therefore complementary to existing studies on pricing-to-market and pass-through.
Our results support the theoretical prediction that the VAT system with incomplete rebates for exports reduces trade quantities. We find a negative and significant effect of non-rebated VAT only when exports are eligible. Our benchmark estimate with a full set of fixed effects suggests that a one percentage-point rise in the VAT rebate will lead to a 6.5% increase in eligible export quantities with respect to non-eligible trade. This change in export quantities is the same in the case of a fall in the VAT rebate. We check that our results are robust to various measures of the VAT rebate policy and subsamples and we control for the possibility that products are misclassified in order to avoid higher rates (Ferrantino et al.,
8
By contrast, sensitivity could be greater in the case of VAT rebates cuts 9
A given VAT rebate increase gives rise to lower VAT reimbursements in the case of low value-added activities compared to high value-added activities.
2012; Fisman and Wei, 2004).
The lack of a significant link between VAT rebates and non-eligible exports is consistent with the recent literature which finds that the choice between trade forms relates to a variety of intrinsic factors such as the domestic availability and quality of inputs or the extent of financial constraints, which are independent of any VAT rebate policy (Manova and Yu, 2012; Brandt and Morrow, 2013).
Overall, our results yield a better understanding of the strong resistance of Chinese exports during the global recession, in which export rebates increased substantially. They also suggest that the adoption of a full VAT rebate system, as in many Western countries, would potentially increase Chinese exports by 40%. If we consider the full VAT rebate system to be “normal”, then this impressive figure represents a challenge to the accusation of unfair export subsidies in China.
The remainder of the paper is structured as follows. The next section describes the Chinese VAT rebate system. Section 3 presents the data and variable construction, and Section 4 overviews our empirical specification. Section 5 discusses the results. The last section concludes.
2
The VAT rebate system
2.1
The evolution of the VAT rebate system
Implemented in 1994 to replace the old industrial and commercial standard tax, the Chinese VAT system differs from that applied in many Western countries, in particular because it is
not neutral (Yan, 2010). In theory, neutral VAT implies a zero rate on exported goods and a full refund of the domestic VAT paid by exporters on their inputs. In China, VAT applies at a standard rate of 17 percent on goods sold on the domestic market,10 while a zero rate is applied to exported goods. However, China has applied a partial VAT refund on inputs for exporters, which varies by commodity. Over the 2002-2012 period, only 13% of the products received rebates compensating for the VAT rate. Incomplete rebates, which are equivalent to export taxation (Feldstein and Krugman, 1990), are hence the rule in China.
There are a variety of rationales for these export restrictions (Bou¨et and Laborde, 2011). The manipulation of the terms-of-trade is a typical explanation. If a country supplies a large share of the world market, restricting its exports brings about a rise in the world price and an improvement in its terms of trade. In a related manner, countries can use dynamically the effect of taxes on prices to stabilize the domestic demand: taxes would be raised when world prices are low and reduced to counter falling prices.11 If export taxes in particular discourage raw-commodity exports, this is equivalent to an indirect subsidy to higher-value-added manufacturing or processing industries: the domestic price of inputs compared to the world price falls.
In China, export VAT rebate changes have been carried out frequently to address various economic issues: managing the trade surplus, increasing government revenue or guiding the growth of certain industries. In the 2000s, growing concerns about energy and environmental problems have prompted Chinese authorities to attempt to shift China’s exports toward
10
A reduced rate of 13 percent applies to basic staples or household necessities such as food, fuel, electricity, books, newspapers and magazines, and agricultural products.
11
Another justification is food security. Public authorities can reduce the consumption price of a good by reorienting domestic supply toward the domestic market (Piermartini, 2004). This motivation has been cited for the implementation of export taxes and other forms of export restrictions during the food crisis of 2006-2008 (WTO, 2008).
more value-added and high-tech products, and away from those generating pollution and consuming large amounts of natural resources. VAT rebates were also manipulated to address looming trade disputes. The booming of the Chinese trade surplus since 2000 generated worries from its WTO trade partners. In order to keep its trade surplus under control, China profoundly modified its system in 2007: these adjustments were designed to substantially reduce the VAT refund rate. More recently, the global economic crisis induced the authorities to raise the export VAT refund rates on thousands of commodities, while continuing to promote technological upgrading. However, the adjustments also benefited labor-intensive goods, and VAT rebates were also raised for some steel products and other final products of energy-intensive sectors (HKTDC, 2009).
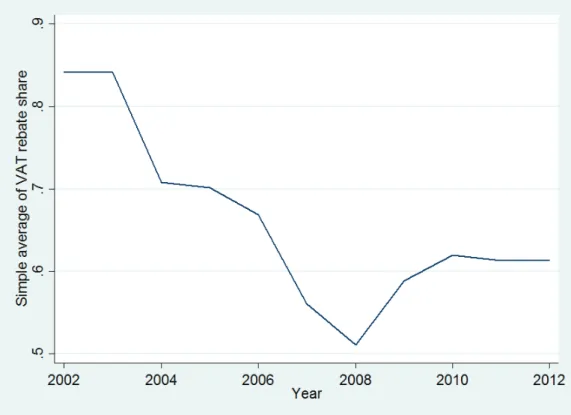
Figure A-1 depicts the evolution of the average ratio between the VAT rebate and VAT rates over the 2002-2012 period. The VAT rebate share declined continuously from 2002, before rebounding in 2009 in reaction to the international crisis. In 2008, eligible exporters could get back roughly 51% of their VAT cost, down from 84% in 2002. This proportion rose back to 58% in 2009.12
2.2
Eligibility in the VAT rebate system
At the risk of oversimplifying the reality, there are two major export refund methods in China (China Tax & Investment Consultants Ltd, 2008): the standard method is the “exempt-credit-refund” (or “refund after collection”) method and the exception is the “tax-exempt” (or “no collection and no refund”) method. Under the latter, even if the exporting company
12
The average probability that an adjustment takes place in a given year for a given HS6 product was 34% over this period. This figure was over 60% in both 2004 and between 2007 and 2009.
paid VAT on local purchases, it is not entitled to any refund. The main example of this non-eligibility is when the goods purchased locally are used by a manufacturer engaged in export processing with supplied materials.13 In this type of processing trade, the Chinese firm undertakes processing or assembling work on materials it does not own. The property of these materials is retained by a foreign party. The Chinese authorities then consider that there are no imports and no export sales: as such, no VAT on imported inputs is collected and hence no VAT is refunded. This contrasts sharply with the standard method of “exempt-credit-refund”, where the amount of VAT that the taxpayer pays for the purchase of inputs used in the manufacture of export sales can be offset against the output VAT collected on local sales, if any.
The Chinese VAT rebate policy on exports is complex and has changed frequently over time. However, the logic has remained fairly stable (Ferrantino et al., 2012). According to Circular No.7 (2002), the official formula used to calculate VAT payable for general trade and processing exports with purchased imported materials is as follows:
VAT payable = (domestic sales × VAT rate)
| {z }
output VAT
−(inputs × VAT rate)
| {z }
input VAT
+ (Exports − BIM) × (VAT rate − VAT rebate rate)
| {z }
VAT export tax
(1)
where output VAT is the VAT collected on domestic sales and input VAT is the VAT paid on inputs subject to VAT. The input VAT applies to all inputs, whether domestically-sourced or imported, except the bonded duty-free imported materials (BIM).14 The tax on exporters
13
The same rule applies also to all processing trade in the so called “bonded zones” and “export processing zones”. Those zones are excluded from our analysis.
14
whose goods receive a VAT rebate rate lower than the applicable VAT rate is captured by the last interaction term. A higher VAT rebate increases the fiscal burden for exporters.15 For pure exporters that use only bonded duty-free inputs, a one percentage-point cut in the VAT rebate rises their tax payment by one percent of their total value-added.
Our empirical approach exploits the eligibility rule that disqualifies processing trade with supplied materials from the rebates. We measure the impact of the VAT rebate policy on city-level exports as its differential effect across regime types for a given product-year pair, while accounting for time invariant city-product-regime type and time varying city-level industry characteristics via city-sector-regime-year dummies.
2.3
Stylized facts on the eligibility status and VAT rebate
Our empirical strategy will be a good one only if the VAT rebate policy does not affect the trade form chosen by firms, i.e. if a cut in the VAT rebate for a given product does not lead firms to switch from eligible to non-eligible trade. In this section, we provide several arguments and evidence from our data suggesting that this assumption is valid.
A recent and growing literature has underlined the specific motives behind the ineligible regime of processing trade with supplied materials in China, which are unrelated to the VAT rebate system.
Manova and Yu (2012) show that the regime type of trade chosen by companies is driven by the importance of financial constraints. Since the ownership of imported intermediates en-tails high up-front costs, financial constraints restrict firms to processing trade with supplied
15
If the VAT payable is negative, the tax bureau will refund it. In fact, the amount of refundable VAT is capped by (Exports-BIM) × (VAT rebate rate).
materials.
Fernandes and Tang (2012) also investigate the rationale behind the ownership of im-ported intermediates. They show that the choice of form of trade is related to factors that have been suggested by theories of the boundaries of the firm, such as control and hold-up. Their results suggest that control over imported components by international firms is an alternative to asset ownership in alleviating hold-up by export-processing plants. We hence expect the extent of processing trade with supplied materials to depend mostly on the observability of input use or the dominance and power of foreign buyers.16
Finally, Brandt and Morrow (2013) investigate another particularity of firms engaged in processing with supplied inputs: their inability to source domestically. As opposed to manufacturers engaged in ordinary trade and processing with imported materials, those in processing trade with supplied inputs are not allowed to buy inputs from China. Their role in China’s exports should thus be related to the attraction of Chinese suppliers. The extent of processing trade with supplied inputs should then fall with improvements in the number, diversity, quality or cost advantage of Chinese manufacturers of intermediate inputs.
Consistent with these arguments, we find no evidence that products with high rebates also have a relatively low share of non-eligible exports. Figure A-2 plots the ratio of the VAT rebate to the VAT rate in 2007 against the share of non-eligible exports at the city-level in 2008.17 It suggests that the absence of association between the VAT rebate policy and forms of trade. Figure A-3 plots for every product the change in the VAT rebate between 2002 and 2012 against the change in the share of non-eligible exports. It suggests that there is little
16
It could also depend on the degree of relationship specificity of the physical capital used in production (Nunn and Trefler, 2013).
17
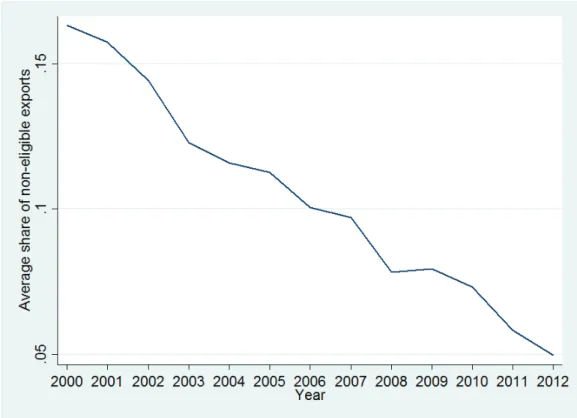
correlation between the evolution of rebates and the trade form chosen by exporters. Figure A-4 shows the share of non-eligible exports between 2000 and 2012. This exhibits a continuous decline over the period, further suggesting the lack of any direct link between the choice of trade type and the ups and downs in the VAT rebate policy. The downward trend is however consistent with the relaxation of financial constraints over time (in the spirit of Manova and Yu, 2012) and the growing diversity and quality of China’s intermediates (as suggested by Brandt and Morrow, 2013).
3
Data and Indicators
3.1
Data on VAT rates and rebates
Our variable of interest is the VAT rebate. VAT rebate rates and VAT rates at the tariff-line level (HS 8-digit or more disaggregated levels) are taken from the Etax yearbooks of Chinese Customs. To account for the changes in the HS classification in 2002, 2007 and 2012, we aggregate the data to the HS 6-digit level (1996 revision)18 using the yearly average of these rates.19 While VAT rebates change frequently, the VAT rate has remained constant between
2002 and 2012 for nearly all HS6 products.20 We exclude the few (355) HS6 products that
experience a change in the VAT rate over this period, leaving us with VAT rates and rebates for 4,651 products.21
18
The correspondence tables from UNCTAD can be found at
http://unstats.un.org/unsd/trade/conversions/HS Correlation and Conversion tables.htm. 19
We use the simple average of all tariff lines within a HS6 product and all sub-periods within the year. 20
The standard rate of 17 percent applies to roughly 97% of our benchmark sample. 21
Column 4 of Table 5 provides robustness checks to ensure that our results remain when these products are included.
3.2
Trade data
The data collected by Chinese Customs include annual export values and quantities by city at the HS 8-digit product level, and separate trade flows according to transaction type. Aggregating the trade flows to the HS6 (1996 revision) level yields a panel of 4,823 products over the 2003-12 period.22
We split export flows into two groups depending on wether they are eligible or not to VAT refund. Eligible trade includes ordinary trade and processing trade with imported materials (also known as import-and-assembly). The latter refers to “business activities in which the operating enterprise imports materials/parts by paying foreign exchange for their processing, and exports finished processed products for sale abroad” (Yu and Manova, 2012).
Non-eligible trade corresponds to processing trade with supplied materials (also called processing & assembly).23 It refers to “the type of inward processing in which foreign sup-pliers provide raw materials, parts or components under a contractual arrangement for the subsequent reexportation of the processed products. Under this type of transaction, the imported inputs and the finished outputs remain property of the foreign supplier” (General Administration of Customs of the People’s Republic of China, 2013).24
Combining the trade data and the VAT data leaves us with 4,444 HS6 products and 436 22
Quantities may be reported in different units over years. For example in tons in one year and in pairs or units another. Therefore, HS6 products for which the quantity unit is not consistent over time are dropped.
23
The other transaction types in the data include international aid, border trade, contracting projects, customs warehousing trade and logistics goods by customs special control area. These other regimes together cover less than 7% of exports over the 2003-2012 period. We do not include these flows in our analysis, as we have only limited information on how the VAT rebate policy is applied to them. Column 2 of Table A-2 provides robustness checks to ensure that our results remain when these other flows are included and regarded as eligible.
24
We exclude exports coming from the so-called “bonded zones” and “export processing zones”, in which all processing trade is treated as non-eligible for VAT refund.
cities.25 As our empirical strategy appeals to heterogenous policy responses according to the trade regime, we drop products which are not exported under both the eligible and the non-eligible regime, as well as cities that do not export under both trade regimes. Our final sample includes observations for 327 cities on 3,142 HS6 products. The trade included in this sample represent more than 80% of China’s total exports under these two regimes over the sample period.
4
Empirical specification
Our empirical approach consists in estimating an equation relating the rebate rate to the quantity exported. We identify the impact of the export VAT rebate policy via its differential effect on eligible and non-eligible trade regimes. Our dependent variable is the log of the export quantity of HS6 product k in city c under regime R in year t, with R comprising the eligible and non-eligible regime. This is regressed on the interaction between the VAT rebate and a dummy for eligible exports. To deal with potential endogeneity problems, we lag all right-hand side variables by one year. Our benchmark specification is:
ln Export quantityR
ck,t = αE VAT rebate ratek,t−1×Eligibility R
+ λ1 Export Growthck,t−1+ λ2 Foreign shareRck,t−1 + λ3 State shareRck,t−1+ γk,t+ µR ck+ ν R cs,t+ ǫ R ck,t (2)
where the dummy EligibilityRtakes the value one if the export flow is in the eligible trade 25
China is divided into 4 municipalities (Beijing, Tianjin, Shanghai and Chongqing) and 27 provinces which are further divided into prefectures. All our results hold if we limit our sample also to prefecture-level cities only. In this case, the main sample contains 260 cities and 3097 products.
regime and zero otherwise. We include product-year fixed effects (γk,t) and hence appeal to a differential effect of rebates across regime types for a given product-year pair. Product-year dummies account for all factors that affect product-level exports irrespective of the trade regime in a given year. These include world demand and all product-specific policies, like import tariffs. Our key coefficient of interest is αE, which captures the net effect of the VAT rebates on eligible export flows.
We further introduce various controls, notably we account for a city’s comparative ad-vantage and export intensity. We use city-product-regime fixed effects (µR
ck) and add ν R cs,t to capture time-varying city-level industry characteristics by regime. The city-sector-regime-year dummies account for demand and supply shocks that are common to all products k of regime type R in sector s at year t for city c. Sectors s are defined following the Chinese GB/T industry classification.26 Our main sample with 3,142 products at the HS6-level con-sists of 395 4-digit sectors. Including these time-varying sector fixed effects also reduces the potential bias resulting from tax evasion. As found in Fisman and Wei (2004) for imports from Hong-Kong to China, evasion of custom duties can occur through the underreporting of export value but also through misclassification. Since it is likely to be easier to misclassify within a similar category as the descriptions are quite similar, any such effects are captured by νR
cs,t. Moreover, these dummies also capture general equilibrium effects such as the im-pact of changes in the rebate of product k on the export of other products since most of the substitution in terms of supply and demand is likely to take place within sectors (which group together products with greater degrees of substitution).
We further account for export dynamics by introducing the change in city-level export 26
quantity for products from t-2 to t-1 at the HS6 product-level. In China, export performance varies importantly by firm ownership (Amiti and Freund, 2010).27 We thus include also the share of exports by foreign firms (Foreign shareR
ck,t−1) and the share of state-owned firms (State shareR
ck,t−1) defined at the city-product-regime level. These three controls are crucial to account for the time-varying ability of different cities to export different products.
All regressions cluster standard errors at the sectoral level to account for serial correlation of the error term within sectors.
5
Results
5.1
Benchmark results
Table 1 presents the results of the regression of export quantities on VAT rebates by HS6 product. In the first four columns we estimate Equation 2 without the product-year fixed effects γk,t to get an estimate of the repercussions of VAT rebates on exports for both the eligible and the non-eligible regimes.
In Column 1 we simply regress export quantity on the interaction between VAT rebates and the dummy for the eligible “exempt-credit-refund” and non-eligible “tax-exempt” cate-gories. The results show that VAT rebates are positively correlated with export performance for eligible trade. In contrast, and in line with our expectations, VAT rebates have no significant effect on quantities when exports consist of non-eligible processing with supplied inputs.
27
All firms (whatever their ownership type) receive similar VAT rebates or pay identical export and import duties.
In Column 2, we add the explanatory variables presented in Equation 2. Due to the absence of product-year fixed effects, we add four additional controls at the product-year level. First, following the gravity literature, we account for the demand-side determinants of exports by including the world import value, defined at the product level. Second, supply-side determinants are taken into account by adding the lagged growth rate of China’s exports at the product level. The last two variables are export taxes and import tariffs.28
With respect to Column 1, the addition of controls reduces slightly our estimated co-efficients on the VAT rebate for eligible trade. Proxies for world demand and supply side dynamics have the expected positive and significant impact on our dependent variable. Other trade policy measures (export tax and import tariffs) fail to be significant. In presence of sector-year dummies, this may reflect that there is limited heterogeneity in these rates be-tween products in the same sector.
Columns 3 and 4 reproduce the baseline of Column 2 on the subsample of eligible and non-eligible exports respectively. This allows all variables to have a different coefficient according to the eligibility status. Our results confirm that αE is positive and highly significant, while the coefficient of the rebate for non-eligible trade is insignificant. This latter result suggests that non-eligible trade is a valid control group for evaluating the effectiveness of the changes in the VAT refunds to exporters.
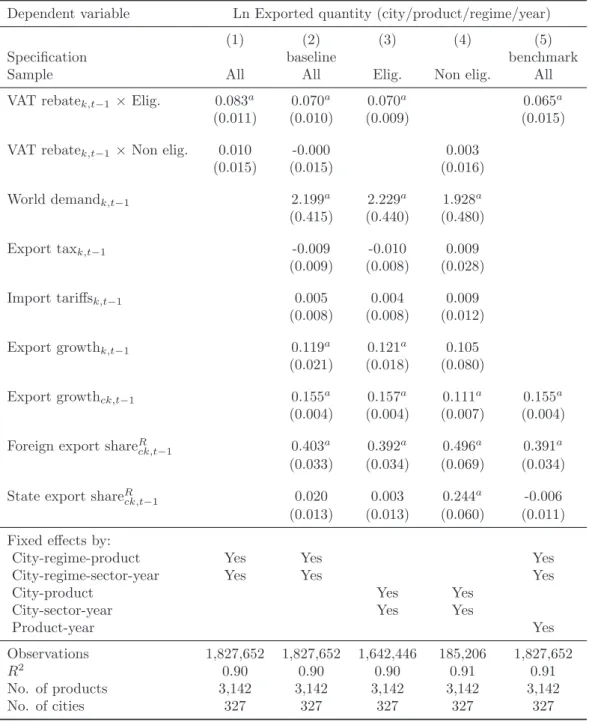
Column 5 displays our benchmark triple difference specification including all control variables as presented in Equation (2). It includes product-year fixed effects which capture the overall effect of VAT rebate on exports which is common to all regimes. The coefficient
28
Export tax is another fiscal measure affecting Chinese exports, although it applies to far fewer products than export VAT rebates. For a detailed description and the construction of the control variables, see Appendix B-1.
of 0.065 on the interaction between the VAT rebate and the eligibility status suggests that a one percentage-point increase in the VAT rebate leads to a 6.5% increase in eligible export quantities. This effect is economically large. Our estimates suggest that if a full VAT refund was applied in China, as it is in most developed countries, the quantity of Chinese exports (under the eligible regime) would potentially jump up by 41% (=6.5%×6.3, where 6.3 is the average non-refunded VAT rate in 2012). Our results indicate that the Chinese VAT system with incomplete rebates for exports reduces the country’s share in world exports.29
In Table 2, we investigate possible asymmetry in upward and downward movements in VAT rebates. The relatively low profit margins of Chinese exporters may make them eager to absorb VAT rebates rise in their margins so that their export quantities are more sensitive to rebate cuts than to rebate increases. In Column 1 we therefore test whether the impact of a change in the VAT rebate depends on its sign. For this, the interaction between VAT rebate and trade regime is further differentiated according to whether the VAT rebate rose or fell from the previous year. We multiply the VAT rebate for eligible trade with two dummies. The dummy Fall takes the value 1 in case of a strict fall in the rebate in the previous period while the dummy Rise equals 1 if the VAT rose or stayed constant with respect to the previous year. The coefficients on the Fall and the Rise interactions are both significant and have the same magnitude, suggesting that the export effects of a given change in the VAT rebate are of the same size whether this change corresponds to a rise or a fall. This result further suggests that the VAT rebate is an effective industrial policy tool.
In the last two columns of Table 2, we test whether the impact of the VAT rebate evolves 29
Table A-2 shows that results hold and magnitudes of the VAT rebate coefficients remain highly similar when controlling for even stricter fixed effects at the HS4 product-level instead of the sector-level (Column 1) or when including the trade category “others” in the eligible trade (Column 2).
over time. The results for the first five years of our sample period (2003 to 2007) are reported in Column 5 and estimates for the second half (2008 to 2012) are displayed in Column 6. The effect of the VAT rebates appears to be slightly lower after 2008. The estimates suggest however that rising VAT rebates was an effective policy to encourage exports during the global recession.
5.2
Robustness checks
5.2.1 Alternative proxies of the VAT rebate
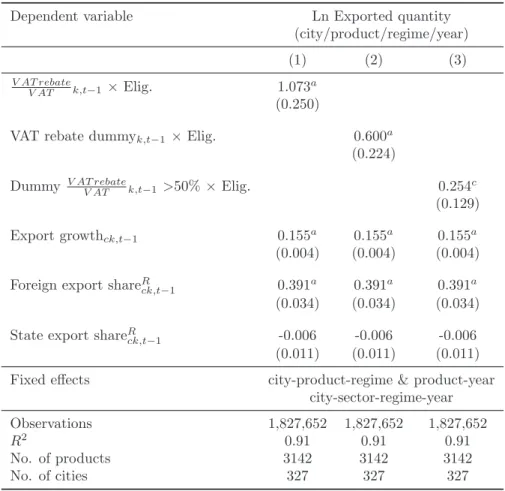
In Table 3 we check that our benchmark results hold with alternative proxies of the VAT rebate. In Column 1 we account for the fact that the VAT rate applied differs across products and use the ratio of the VAT rebate to the VAT rate (VAT rebate
VAT k,t−1). Column 2 uses a dummy
variable which takes the value 1 when the rebate is strictly positive (and zero otherwise) by product-year pair. In Column 3 the dummy is 1 when the rebate is at least half of the VAT rate applied to a product in a given year. The results are very consistent with those using the continuous indicator. The impact of benefiting from a positive or large rebate is positive and significant for eligible trade.
5.2.2 Alternative samples
This section checks robustness across various subsamples, with the rebate being measured as the VAT-rebate rate as in Column 5 of Table 1.
First, Table 4 verifies that our estimates do not reflect the specific features of some prod-ucts which have been targeted by Chinese authorities as either strategic or undesirable. This
allows us to address concerns regarding omitted unobserved policies that may be correlated
with both VAT rebates and export performance.30
Column 1 shows that our results hold, when the sample is restricted to manufacturing products (and so excludes agriculture). This checks that our estimates do not reflect some particular features of agriculture: agricultural products have indeed been particularly tar-geted by Chinese authorities concerned by food security in a context of rising prices, notably in 2006-8.
Our findings of a positive and significant αE also hold when dropping other product
categories that have explicitly been targeted by the Chinese authorities: In Column 2, the few but very strategic rare-earth products are excluded to make sure that they do not drive our results. The same logic is behind the exclusion of energy and carbon-intensive products in Column 3, which might be specifically targeted in the attempt to reduce pollution. Column 4 excludes high-tech products as defined by the OECD to ensure that we do not pick up the
many unobserved subsidies granted in this sector.31 Finally, our results also hold when
dropping high-skill intensive products (Column 5).
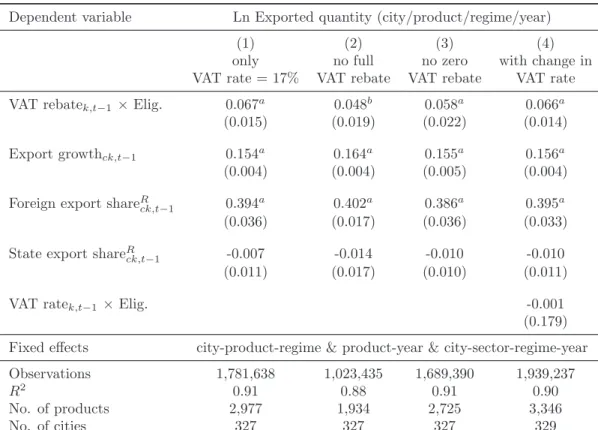
In Table 5 we make sure that our results are not driven by a specific type of VAT rate or rebate. First in Column 1 we check that our estimates are not driven by the different VAT rates across products and drop the 165 HS6 products in our sample with the reduced rate of 13 percent (instead of the basic 17%). In Column 2 we exclude products, which have enjoyed a full rebate at any time over our sample period, since they may have benefited from
30
For details on how we identify the products to drop, see Appendix B-2. 31
High-tech exporters have likely benefited from a variety of policies such as FDI promotion, production and R&D subsidies and access to preferential-tax high-tech zones as part of the Chinese effort to upgrade exports. Findings are robust to alternative classifications by high-tech products, as e.g. defined by Eurostat.
other unobserved policies. Column 3 restricts our sample to products that have throughout the whole sample period a positive rebate. Despite the sharp reduction in the number of observations (we drop one third of the products in the second case), the point estimates change only little. Finally, Column 4 includes also products, whose VAT rate changed during the sample period.32
Our main findings remain unchanged in all specifications, so that our estimated VAT-rebate impact is not simply picking up other aspects of industrial policy or product specific features. Overall, this confirms our claim that changing VAT rebates is an effective policy tool to manage exports in China.
5.3
Misreporting issues
Despite our strict controls and the numerous robustness checks presented above, there is one important issue that remains: the potential risk of misreporting of exports for the purpose of tax evasion. Ferrantino et al. (2012) confirm widespread VAT evasion by Chinese exporters. Our specification includes city-sector-regime-year fixed effects, hence controls for the misclassification of goods within sectors. Tax evasion can however also happen through the misreporting of prices or quantities. As can be seen in Equation 1, the tax burden of exporters is proportional to export value. Our empirical approach has therefore so far deliberately relied on export quantities because of potential measurement problems from the underreporting of export values by exporters to avoid paying taxes based on export value. If these practices affect values and not quantities as suggested by Fisman and Wei (2004),
32
To control for the change in VAT rates, we also include the interaction between the VAT rate and the eligibility dummy.
export prices should be underreported. When the VAT rebate is increased, the exporters may be incited to cheat less and to declare a higher price to the Customs. The repercussions of the changes in rebates on export prices however also depend on the extent to which exporters pass rebates through to prices. Exporters could well absorb the changes in rebates in their margins. The overall effect is hence ambiguous.
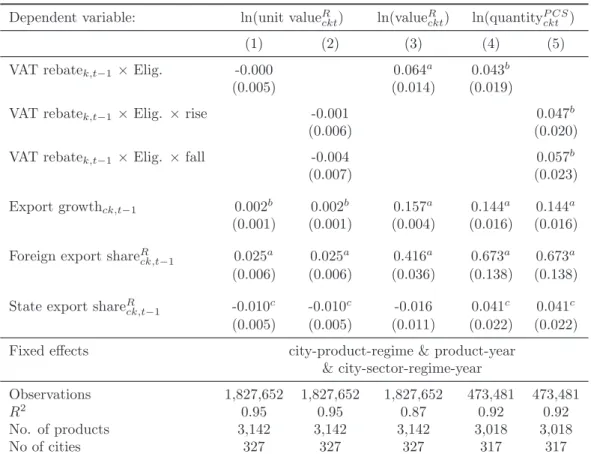
To see whether misreporting is indeed an issue, we use two approaches. First, Column 1 of Table 6 reports the estimates of Equation 2 using the unit value (calculated as the ratio of export value to export quantity) as dependent variable. Conditional on our strict controls, we find no significant differential negative effect of VAT rebates on unit prices in the two trade regimes, neither for our benchmark specification nor when allowing the coefficient of the rebate to be different for a fall or a rise in the rebate (Column 2). We therefore do not find that exporters pass rebate variations through to prices. This suggests that the VAT rebate effect on export values (Column 3) is driven entirely by the effect on export quantities. Another way to check that our results do not reflect misreporting by exporters is by ex-cluding ordinary trade: Ferrantino et al. (2012) argue that the stricter enforcement applied to processing trade at the Chinese border makes processing exporters less likely to underre-port than normal exunderre-porters.33 Columns 4 and 5 of Table 6 consider only processing trade, and so exclude ordinary trade.
Limiting the sample to processing trade also allows to reduce two other concerns. First, we can check that our estimates do not simply reflect the determinants of export structure into ordinary and processing trade. Brandt and Morrow (2013) suggest, for example, that
33
Another reason why processing exporters are less likely to underreport than normal exporters results from the formula of VAT payable (Equation 1). Processing traders can reduce their VAT liability either illegally by understating exports or legally by purchasing more bonded duty-free imported materials (BIM).
lower import tariffs on inputs explain almost all of the rise in Chinese exports via ordinary trade between 2000 and 2006. If import tariffs and VAT rebates are correlated, then our estimates could reflect the former instead of the effect of VAT rebates.
Second, it makes our sample more homogenous: ordinary exports embody more than twice as much domestic value added per USD as do processing exports (Koopman et al., 2012; Kee and Tang, 2012). Greater value-added content means a higher non-refundable VAT cost for a given VAT rebate, and larger refunds from any given rise in the VAT rebate. The focus on processing trade allows us to eliminate this source of potential bias due to differences in local value-added content.
We find a positive and significant αE even after ordinary trade is excluded, confirming the trade-creating effect of VAT rebates (Column 4). The results in Column 5 confirm the previously found symmetry of export effects from upward and downward movements in VAT rebates.34
Overall, our results are consistent. We find no evidence of an impact of VAT rebate changes on the pricing strategy of exporters. They suggest that the massive rise in Chinese VAT rebates in 2008 helped to maintain the profitability of domestic exporters amid declining world prices, and resulted in greater Chinese export quantity and value.
6
Conclusion
We have appealed to a product-level database on Chinese exports at the city level to consider how export performance is affected by VAT rebates. Our empirical strategy to address
endo-34
In unreported results, which are available upon request, we verify the absence of a VAT-rebate effect on unit values for this sample restricted to processing activities.
geneity exploits an eligibility rule that disqualifies processing trade with supplied materials from the rebates. Our estimates rely on export-quantity data for 327 Chinese cities at the HS6 product-level over the 2003-2012 period, and provide evidence of positive and significant VAT rebate effects on Chinese export performance. Our benchmark estimate suggests that a one percentage-point rise in the VAT rebate will lead to a 6.5% increase in eligible trade flows. Our main findings remain unchanged in all specifications, so that our estimated VAT rebate impact is not simply picking up other aspects of trade policy or supply and demand. Moreover, we find identical effects for rebate rises and falls. The size of our estimates al-lows us to better understand the resistance of China’s exports over the global recession, and confirms the key role of trade policy in China’s rising advantage in global markets.
References
Amiti, Mary, and Caroline Freund, 2010, An anatomy of China’s export growth, in: Feen-stra, Robert, and Wei, Shang-Jin (Eds.), China’s Growing Role in World Trade. Uni-versity of Chicago Press, Chicago.
Bergmann, Manfred, Andreas Schmitz, Mark Hayden and Katri Kosonen, 2007, Imposing a unilateral carbon constraint on energy-intensive industries and its impact on their in-ternational competitiveness : Data and analysis, European Economy Economic Papers, No 298, December 2007
Bou¨et, Antoine, and David Laborde, 2011, Food Crisis and Export Taxation: The Cost of Non-Cooperative Trade Policies, Review of World Economics, 148(1), 209-233.
Brandt, Loren and Peter M. Morrow, 2013, Tariffs and the Organization of Trade in China, University of Toronto, Working paper 491.
Chan, Alfred, 2008, An Overview of the VAT Export Refund Rules in China, Tax Notes International, 49(2), 159-164.
Chandra, Piyush and Cheryl Long, 2013, VAT rebates and export performance in China: Firm-level evidence, Journal of Public Economics, 102, 13-22.
Chen, Chien-Hsun, Mai, Chao-Cheng, Yu, Hui-Chuan, 2006, The effect of export tax rebates on export performance: theory and evidence from China, China Economic Review, 17(2), 226-235.
China Tax & Investment Consultants Ltd, 2008, A Summary on VAT Export Refund Rule in
China. http://www.china-tax.net/business/customsvat/SummaryCHNVATExpRefundRules.pdf Circular No.7, 2002, Notice on Further Implementing the ”Exemption-Credit-Refund”
Sys-tem of Export Tax Rebate, issued jointly by the Finance Ministry and the State Ad-ministration of Taxation in China, October.
Evenett, Simon J., Johannes Fritz and Yang Chun Jing, 2012, Beyond Dollar Exchange-rate Targeting: China’s Crisis-era Export Management Regime, Oxford Review of Economic Policy, 28(2), 284-300.
Feldstein, Martin, and Paul Krugman, 1990, International trade effects of value-added tax, in: Razin, A., Slemrod, J. (Eds.), Taxation in the Global Economy. University of Chicago Press, 263-282.
Fernandes, Ana, and Heiwei Tang, 2012, Determinants of vertical integration in export processing: Theory and evidence from China, Journal of Development Economics, 96(2), 396-414
Ferrantino, Michael J., Xuepeng Liu and Zhi Wang, 2012, Evasion behaviors of exporters and importers: Evidence from the U.S.-China trade data discrepancy, Journal of In-ternational Economics, 86, 141-157.
Fisman, Raymond and Shang-Jin Wei, 2004, Tax rates and tax evasion: evidence from “missing imports” in China, Journal of Political Economy, 112(2), 471-496.
cus-Gaulier, Guillaume, and Soledad Zignago, 2010, BACI: International Trade Database at the Product-Level, CEPII Working Paper 10-23, October.
Global Trade Alert “Unequal Compliance: The 6th Global Trade Alert report”, 2010, Evenett, Simon J. (Ed.), Centre for Economic Policy Research.
Hatzichronoglou, Thomas, 1997, Revision of the High-Technology Sector and Product Clas-sification, OECD Science, Technology and Industry Working Papers, No 1997/02.
HKTDC, 2009, Export Rebate Increases & Scheme of Tax Reduction by VAT Transforma-tion, 14th January (http://info.hktdc.com/shippers/vol31-6/vol31-6-Trade-03.htm) Kee, Hiau Looi and Heiwei Tang, 2012, Domestic Value Added in Chinese Exports:
Firm-level Evidence, Working Paper, Tufts University
Koopman, Robert, Zhi Wang and Shang-Jin Wei, 2012, Estimating domestic content in exports when processing trade is pervasive, Journal of Development Economics, 96(2), 178-189.
Manova, Kalina and Zhihong Yu, 2012, Firms and Credit Constraints along the Global Value Chain: Processing Trade in China, NBER Working Paper, 18561.
Nunn, Nathan and Daniel Trefler, 2013, Incomplete Contracts and the Boundaries of the Multinational Firm, Journal of Economic Behavior & Organization, 94(1), 330-344.
Piermartini, Roberta, 2004, The Role of Export Taxes in The Field of Primary Commodi-ties, WTO Discussion Papers, Geneva, Switzerland.
Upward, Richard, Zheng Wanga and Jinghai Zheng, 2013, Weighing China’s export bas-ket: The domestic content and technology intensity of Chinese exports, Journal of Comparative Economics, 41(2), 527-543.
WTO, 2008, Trade Policy Review: China, Report by the Secretariat, WT/TPR/S/199, 16 April, World Trade Organization.
WTO, 2010, Trade Policy Review: China, Secretariat Report, WT/TPR/S/230/Rev.1, World Trade Organization.
Yan, Xu, 2010, Reforming value added tax in mainland China: a comparison with the EU, Revenue Law Journal,20 (1), article 4.
Main tables
Table 1: Exports and VAT rebates: Benchmark results
Dependent variable Ln Exported quantity (city/product/regime/year)
(1) (2) (3) (4) (5)
Specification baseline benchmark
Sample All All Elig. Non elig. All
VAT rebatek,t−1 ×Elig. 0.083a 0.070a 0.070a 0.065a
(0.011) (0.010) (0.009) (0.015)
VAT rebatek,t−1 ×Non elig. 0.010 -0.000 0.003
(0.015) (0.015) (0.016) World demandk,t−1 2.199a 2.229a 1.928a (0.415) (0.440) (0.480) Export taxk,t−1 -0.009 -0.010 0.009 (0.009) (0.008) (0.028) Import tariffsk,t−1 0.005 0.004 0.009 (0.008) (0.008) (0.012) Export growthk,t−1 0.119a 0.121a 0.105 (0.021) (0.018) (0.080) Export growthck,t−1 0.155a 0.157a 0.111a 0.155a (0.004) (0.004) (0.007) (0.004)
Foreign export shareR
ck,t−1 0.403a 0.392a 0.496a 0.391a
(0.033) (0.034) (0.069) (0.034)
State export shareR
ck,t−1 0.020 0.003 0.244
a -0.006
(0.013) (0.013) (0.060) (0.011)
Fixed effects by:
City-regime-product Yes Yes Yes
City-regime-sector-year Yes Yes Yes
City-product Yes Yes
City-sector-year Yes Yes
Product-year Yes Observations 1,827,652 1,827,652 1,642,446 185,206 1,827,652 R2 0.90 0.90 0.90 0.91 0.91 No. of products 3,142 3,142 3,142 3,142 3,142 No. of cities 327 327 327 327 327
Heteroskedasticity-robust standard errors clustered at the sector level appear in parenthe-ses. a,b andc indicate significance at the 1%, 5% and 10% confidence level respectively. c stands for city, k for the HS6 product level, t for year and R refers to the two eligibility regimes in the VAT-rebate system: the non-eligible processing trade with supplied inputs and the eligible ordinary and processing trade with imported materials.
Table 2: Exports and VAT rebates: testing for an asymmetric impact
Dependent variable Ln Exported quantity
(city/product/regime/year)
(1) (2) (3)
Period 2003-2012 2003-2007 2008-2012
VAT rebatek,t−1× Elig. 0.101a 0.055a
(0.022) (0.020)
VAT rebatek,t−1× Elig. × rise 0.064a (0.015) VAT rebatek,t−1× Elig. × fall 0.064a
(0.018)
Export growthck,t−1 0.155a 0.121a 0.117a
(0.004) (0.004) (0.004)
Foreign export shareR
ck,t−1 0.391
a 0.271a 0.223a
(0.034) (0.029) (0.022)
State export shareR
ck,t−1 -0.006 -0.031b -0.008
(0.011) (0.013) (0.013)
Fixed effects city-product-regime & product-year
city-sector-regime-year Observations 1,827,652 850,079 977,573 R2 0.91 0.93 0.94 No. of products 3,142 3,140 2,980 No. of cities 327 324 327
Heteroskedasticity-robust standard errors clustered at the sector level appear in parentheses. a,b and c indicate significance at the 1%, 5% and 10% confidence level respectively. c stands for city, k for the HS6 product level, t for year and R refers to the two eligibility regimes in the VAT-rebate system: the non-eligible processing trade with supplied inputs and the eligible ordinary and processing trade with imported materials.
Table 3: Exports and VAT rebates: alternative rebate-policy measures
Dependent variable Ln Exported quantity
(city/product/regime/year) (1) (2) (3) V AT rebate V AT k,t−1 ×Elig. 1.073 a (0.250)
VAT rebate dummyk,t−1 ×Elig. 0.600a
(0.224) Dummy V AT rebate V AT k,t−1>50% × Elig. 0.254 c (0.129) Export growthck,t−1 0.155a 0.155a 0.155a (0.004) (0.004) (0.004)
Foreign export shareR
ck,t−1 0.391
a 0.391a 0.391a
(0.034) (0.034) (0.034)
State export shareR
ck,t−1 -0.006 -0.006 -0.006
(0.011) (0.011) (0.011)
Fixed effects city-product-regime & product-year
city-sector-regime-year
Observations 1,827,652 1,827,652 1,827,652
R2 0.91 0.91 0.91
No. of products 3142 3142 3142
No. of cities 327 327 327
Heteroskedasticity-robust standard errors clustered at the sector level ap-pear in parentheses. a, b andc indicate significance at the 1%, 5% and 10% confidence level respectively. c stands for city, k for the HS6 product level, t for year and R refers to the two eligibility regimes in the VAT-rebate sys-tem: the non-eligible processing trade with supplied inputs and the eligible ordinary and processing trade with imported materials.
Table 4: Exports and VAT rebates: excluding sensitive sectors
Dependent variable Ln Exported quantity (city/product/regime/year)
(1) (2) (3) (4) (5)
only w/o w/o w/o w/o
manuf rare earths energy-intensive high-tech high-skilled int.
VAT rebatek,t−1 ×Elig. 0.065a 0.065a 0.063a 0.067a 0.065a
(0.015) (0.015) (0.015) (0.016) (0.015)
Export growthck,t−1 0.154a 0.155a 0.155a 0.154a 0.153a
(0.004) (0.004) (0.004) (0.004) (0.004)
Foreign export shareR
ck,t−1 0.395a 0.391a 0.389a 0.375a 0.383a
(0.036) (0.034) (0.034) (0.034) (0.034)
State export shareR
ck,t−1 -0.006 -0.006 -0.006 -0.010 -0.006
(0.011) (0.011) (0.011) (0.011) (0.011)
Fixed effects city-product-regime & product-year & city-sector-regime-year
Observations 1,798,316 1,825,899 1,809,970 1,708,406 1,788,447
R2
0.91 0.91 0.91 0.91 0.91
No. of products 3,024 3,136 3,103 2,876 3,061
No. of cities 327 327 327 327 327
Heteroskedasticity-robust standard errors clustered at the sector level appear in parentheses. a,band c indicate significance at the 1%, 5% and 10% confidence level respectively. c stands for city, k for the HS6 product level, t for year and R refers to the two eligibility regimes in the VAT-rebate system: the non-eligible processing trade with supplied inputs and the eligible ordinary and processing trade with imported materials.
Table 5: Exports and VAT rebates: alternative samples
Dependent variable Ln Exported quantity (city/product/regime/year)
(1) (2) (3) (4)
only no full no zero with change in
VAT rate = 17% VAT rebate VAT rebate VAT rate
VAT rebatek,t−1 ×Elig. 0.067a 0.048b 0.058a 0.066a
(0.015) (0.019) (0.022) (0.014)
Export growthck,t−1 0.154a 0.164a 0.155a 0.156a
(0.004) (0.004) (0.005) (0.004)
Foreign export shareR
ck,t−1 0.394
a 0.402a 0.386a 0.395a
(0.036) (0.017) (0.036) (0.033)
State export shareR
ck,t−1 -0.007 -0.014 -0.010 -0.010
(0.011) (0.017) (0.010) (0.011)
VAT ratek,t−1×Elig. -0.001
(0.179) Fixed effects city-product-regime & product-year & city-sector-regime-year
Observations 1,781,638 1,023,435 1,689,390 1,939,237
R2
0.91 0.88 0.91 0.90
No. of products 2,977 1,934 2,725 3,346
No. of cities 327 327 327 329
Heteroskedasticity-robust standard errors clustered at the sector level appear in parenthe-ses. a, b andc indicate significance at the 1%, 5% and 10% confidence level respectively. c stands for city, k for the HS6 product level, t for year and R refers to the two eligibility regimes in the VAT-rebate system: the non-eligible processing trade with supplied inputs and the eligible ordinary and processing trade with imported materials.
Table 6: Export prices and processing trade
Dependent variable: ln(unit valueR
ckt) ln(valueRckt) ln(quantityP CSckt )
(1) (2) (3) (4) (5)
VAT rebatek,t−1 ×Elig. -0.000 0.064a 0.043b
(0.005) (0.014) (0.019)
VAT rebatek,t−1 ×Elig. × rise -0.001 0.047b
(0.006) (0.020)
VAT rebatek,t−1 ×Elig. × fall -0.004 0.057b
(0.007) (0.023)
Export growthck,t−1 0.002b 0.002b 0.157a 0.144a 0.144a
(0.001) (0.001) (0.004) (0.016) (0.016)
Foreign export shareR
ck,t−1 0.025
a 0.025a 0.416a 0.673a 0.673a
(0.006) (0.006) (0.036) (0.138) (0.138)
State export shareR
ck,t−1 -0.010c -0.010c -0.016 0.041c 0.041c
(0.005) (0.005) (0.011) (0.022) (0.022)
Fixed effects city-product-regime & product-year
& city-sector-regime-year
Observations 1,827,652 1,827,652 1,827,652 473,481 473,481
R2 0.95 0.95 0.87 0.92 0.92
No. of products 3,142 3,142 3,142 3,018 3,018
No of cities 327 327 327 317 317
Heteroskedasticity-robust standard errors clustered at the sector level appear in parenthe-ses. a,bandc indicate significance at the 1%, 5% and 10% confidence level respectively. c stands for city, k for the HS6 product level, t for year and R refers to the two eligibility regimes in the VAT-rebate system: the non-eligible processing trade with supplied inputs and the eligible ordinary and processing trade with imported materials.
Appendix A - Additional tables and figures
Figure A-1: Evolution of the VAT rebate share (over VAT rate) 2002-2012
Figure A-2: VAT-rebate share and share of non-eligible exports (city-product)
Note: The share of non-eligible exports is the export value share of processing trade with supplied inputs. City-product pairs are those in the benchmark sample.
Figure A-3: Change in VAT-rebate share and share of non-eligible exports (product) between 2002 and 2012.
Figure A-4: Share of non-eligible exports over time
Table A-1: Summary statistics of variables
Mean Std. Dev. Min Max
ln(exported quantity)R ck,t 9.87 3.67 0 24.12 ln(export value)R ck,t 11.64 2.90 0 23.96 ln(unit value)R ck,t 1.77 2.41 -10.13 19.97 VAT rebatek,t−1 (%) 12.59 3.88 0 17 VAT ratek,t−1(%) 16.91 0.60 13 17 VAT rebate/VATk,t−1 0.74 0.23 0 1 World demandk,t−1) 0.21 0.18 0 1 Export taxk,t−1 (%) 0.08 1.40 0 106 Import tariffsk,t−1 (%) 10.94 6.19 0 68 Export growthk,t−1 0.20 0.33 -2 2 Export growthck,t−1 0.26 1.19 -2 2
Foreign export shareR
ck,t−1 0.24 0.38 0 1
State export shareR
ck,t−1 0.25 0.37 0 1
Please refer to Section 3 and Appendix B-1 for a detailed de-scription of these variables. The statistics are based on the sample in our benchmark specification (1,827,652 observations) (Column 5 of Table 1). VAT rates, VAT rebate rates, the share of the VAT rebate over VAT rates, export taxes and import tariffs are measured as percentages. c stands for city, k for the HS6 product level, t for year and R refers to the two eligibility regimes in the VAT-rebate system: the non-eligible processing trade with supplied inputs and the eligible ordinary and pro-cessing trade with imported materials.
Table A-2: Additional results
Dependent variable ln(quantityR
ckt)
(1) (2)
HS4 including
controls “other”
VAT rebatek,t−1 ×Elig. 0.057b 0.066a
(0.025) (0.015)
Export growthck,t−1 0.155a 0.153a
(0.006) (0.004)
Foreign export shareR
ck,t−1 0.401a 0.377a
(0.048) (0.032)
State export shareR
ck,t−1 -0.012 -0.014
(0.011) (0.011)
Fixed effects: City-HS6 product-regime Yes Yes
HS6 product-year Yes Yes
City-sector-regime-year Yes
City-HS4 product-regime-year Yes
Observations 1,827,652 1,881,361
R2
0.93 0.91
No. of HS6 products 3,142 3,143
No. of cities 327 327
In Column 1, heteroskedasticity-robust standard errors clustered at the HS3-product level appear in parentheses. In Column 2, standard errors are clustered at the sector level. a,b andc indi-cate significance at the 1%, 5% and 10% confidence level respec-tively. c stands for city, k for the HS6 product level, t for year and Rrefers to the two eligibility regimes in the VAT-rebate system: the non-eligible processing trade with supplied inputs and the eligible ordinary and processing trade with imported materials.
Appendix B - Data sources and classifications
B-1
Construction and data sources of control variables
The Customs trade data is used to obtain several of our control variables: Export growthk,t−1, Export growthck,t−1, Foreign export shareR
ck,t−1 and State export share R ck,t−1.
Export growthk,t−1 and Export growthck,t−1are yearly export growth at the product-level and at the city-product level respectively. These proxies of export dynamics are computed using the mid-point growth rate formula using export values from t − 2 and t − 1. For-eign export shareR
ck,t−1and State export share R
ck,t−1 measure respectively the share of export quantities by foreign and state-owned firms for each product-city-regime combination.
World demandk,t−1 is defined as the share of China’s exports in world exports for a given product in a given year. This variable is obtained from the BACI world trade dataset.35
Export tax information comes from the General Administration of Customs of the Peo-ple’s Republic of China (www.customs.gov.cn) and the Ministry of Finance of the PeoPeo-ple’s Republic of China (www.gss.mof.gov.cn). We calculate annual export taxes at the HS 6-digit level as the simple average over the various lines. This rate includes the special tax (from 2009) when applicable. The number of HS6 products covered by export taxes rose from 20 in 2002 to 252 in 2012.
Data on import tariffs at the HS6 level come from the World Integrated Trade Solution (WITS). We calculate simple averages of MFN tariffs, which measure the average level of nominal tariff protection applied to imports into China.
B-2
Different classifications of products
In Section 5.2, we check that our results hold after excluding a number of product categories which have specifically been targeted by the Chinese authorities. Rare-earth products are those listed in the WTO reports (WTO, 2008 and 2010), and products under conflict are a small group of 21 HS6 products of raw materials.36
Energy- and emission-intensive products are identified from the European Commission classification which singles out 78 HS6 products as energy- and carbon-emission intensive (Bergmann et al., 2007). High-tech products are defined based on the list established by the OECD of 319 high-tech products (Hatzichronoglou, 1997). The list of high-skilled products comes from the UNCTAD.
35
This dataset is based on COMTRADE data using an original procedure that reconciles the declara-tions of exporters and importers (Gaulier and Zignago, 2010). BACI uses the 1996 HS 6-digit product nomenclature. It is downloadable from http://www.cepii.fr/anglaisgraph/bdd/baci.htm.
36
Recently the “China Raw Materials dispute” at the WTO highlighted Chinese efforts to restrict its exports of rare-earth products which are key in the production process of many high-value products. China is by far the world’s largest producer of the 17 metals known collectively as “rare earths”. In the 2000s, Chinese authorities gradually tightened restrictions on these products in an effort to encourage the domestic processing of these metals and secure a better position in the global value chain.