HAL Id: hal-01345301
https://hal-univ-rennes1.archives-ouvertes.fr/hal-01345301
Submitted on 10 May 2021
HAL is a multi-disciplinary open access
archive for the deposit and dissemination of
sci-entific research documents, whether they are
pub-lished or not. The documents may come from
teaching and research institutions in France or
abroad, or from public or private research centers.
L’archive ouverte pluridisciplinaire HAL, est
destinée au dépôt et à la diffusion de documents
scientifiques de niveau recherche, publiés ou non,
émanant des établissements d’enseignement et de
recherche français ou étrangers, des laboratoires
publics ou privés.
Distributed under a Creative Commons Attribution| 4.0 International License
Marine Grandgeorge, Sarah Wanless, Timothy E. Dunn, Myriam Maumy,
Grégory Beaugrand, David Grémillet
To cite this version:
Marine Grandgeorge, Sarah Wanless, Timothy E. Dunn, Myriam Maumy, Grégory Beaugrand, et
al.. Resilience of the British and Irish seabird community in the twentieth century. Aquatic Biology,
Inter-Research, 2008, 4 (2), pp.187-199. �10.3354/ab00095�. �hal-01345301�
INTRODUCTION
Disturbance is defined as ‘any relatively discrete event in time that disrupts an ecosystem, a community, or the structure of a population and changes resource
pools, substrate availability, or the physical environ-ment’ (White & Pickett 1985). Such disturbance may have natural or anthropogenic origins (Turner et al. 2003) and is one of the dominant forces that shape the structure of biological systems (e.g. Wootton 1998).
© Inter-Research 2008 · www.int-res.com *Corresponding author. Email: david.gremillet@cefe.cnrs.fr
Resilience of the British and Irish seabird community
in the twentieth century
Marine Grandgeorge
1, 2, Sarah Wanless
3, Timothy E. Dunn
4, Myriam Maumy
5,
Grégory Beaugrand
6, David Grémillet
1, 7,*
1Centre National de la Recherche Scientifique, Centre d’Ecologie Fonctionnelle et Evolutive, 1919 route de Mende,
34293 Montpellier, France
2Centre National de la Recherche Scientifique, Laboratoire EthoS, Campus de Beaulieu, Bat 25, 263 avenue du Général Leclerc,
35042 Rennes, France
3Centre for Ecology and Hydrology, Bush Estate, Penicuik, Midlothian EH26 0QB, UK 4Joint Nature Conservation Committee, Dunnet House, 7 Thistle Place, Aberdeen AB10 1UZ, UK
5Laboratoire de Statistique, Université Louis Pasteur, 7 rue Descartes, 67084 Strasbourg, France
6Centre National de la Recherche Scientifique, Laboratoire d’Océanologie et de Géosciences, UMR LOG CNRS 8187,
Station Marine, Université des Sciences et Technologies de Lille, 59000 Lille, France
7DST/NRF Centre of Excellence at the Percy FitzPatrick Institute of African Ornithology, University of Cape Town,
Rondebosch 7701, South Africa
ABSTRACT: We studied the British and Irish seabird community in the 20th century, a period of great anthropogenic impact. We determined the average body mass of community members and analysed population sizes, phylogenetic and spatial structures. We also quantified the total predation exerted by seabirds around Britain and Ireland and the spatial distribution of this predation in the North Sea. To achieve these aims we used (1) presence or absence of the seabird species in the different coun-ties of Britain and Ireland between 1875 to 1900 and 1968 to 1972, (2) seabird breeding censuses of Britain and Ireland from 1969 to 1970, 1985 to 1988 and 1998 to 2002, (3) at-sea abundance and dis-tribution surveys of seabirds in the North Sea from 1980 to 1985 and 1990 to 1995, and (4) a bioener-getics model to estimate energy expenditures for 40 seabird species. Our analyses suggest a marked expansion in the breeding range of seabirds in Britain and Ireland between 1875 and 1972. Total seabird numbers also increased at an average rate of 1% per annum between 1969 and 2002, with a related increase of 115% in predicted total seabird predation. Only terns Sternidae declined during this second period. Some characteristics of the community (geographical and phylogenetic structure, body mass) showed minor and non-significant variability between 1969 and 2002. Finally, seabird predation in the North Sea showed a slight north-eastward shift between 1980 to 1985 and 1990 to 1995. Overall, our study indicates that the seabird community of Britain and Ireland has prospered during the 20th century. These results contrast with extensive breeding failures recorded during the first years of the 21st century, which indicate that certain species within the community are now being critically disturbed.
KEY WORDS: Bird phylogeny · Population census · Bioenergetics · Predation · Regime shift · Spatial analysis · Marine environment
Resale or republication not permitted without written consent of the publisher
O
PEN
PEN
Conversely, resilience is defined as the capacity of these systems to face natural or man-made environ-mental change (and their positive or negative impact) without degrading or shifting to alternate states (Holling 1973, Hughes et al. 2005).
After centuries of use of marine resources by humans, there is now compelling evidence that marine ecosystems are critically disturbed by pollution (Thomp-son et al. 1992), overfishing (Jack(Thomp-son et al. 2001) and climate change (Pinnegar et al. 2002, Frederiksen et al. 2004). Seabirds also suffer from the impact of human activities, and they are the most threatened bird group (Butchart et al. 2004). Numerous studies have assessed the impact of global climate change and consequences of overfishing on seabird populations (e.g. Croxall et al. 2002, Barbraud & Weimerskirch 2003). However, to our best knowledge, no study has so far examined the effects of disturbances at the community level. This is an important handicap in management terms, since responses to disturbance can vary substantially across species, taxonomic groups and trophic levels (Wootton 1998).
In the present study, we examined the seabird munity of Britain and Ireland, which currently com-prises about 8 million birds belonging to 25 different breeding species (Mitchell et al. 2004); these live in some of the most perturbed marine habitats on the planet (Halpern et al. 2008). We defined this ‘commu-nity’ in a taxonomic and functional sense, i.e. a group of species belonging to specific bird families sharing a wide range of life-history traits.
This seabird community has been affected by 4 main factors: (1) fisheries, (2) exploitation for food, (3) spe-cies invasions and habitat destruction, and (4) climate change.
(1) The seas around Britain and Ireland have been influenced by industrial fishing since the 19th century (Pauly & Maclean 2003), with overfishing of many stocks taking place throughout the 20th century as a result of improved fishing technology (e.g. Pauly et al. 1998, Hutchinson et al. 2003, Barrett et al. 2004). Fish-eries initially removed large predatory fish such as Atlantic cod Gadus morhua from the system, which were potentially competing with seabirds for re-sources. Subsequently, mid-trophic forage fish such as Norway pout Trisopterus esmarkii and sandeels Ammo-dytes spp., which are important seabird prey, were intensively fished and used for fish oil or fishmeal in the agriculture and aquaculture industries (Jennings & Kaiser 1998). Intensification of industrial fishing also generated vast amounts of discards and offal, a poten-tially important food source for some seabird species (Garthe et al. 1996, Furness 2003). Fishery activities may, therefore, have positively (removal of competi-tors, higher availability of fishery refuses) or negatively
(removal of seabird live prey, lethal interactions with fishing gear) impacted seabird populations, and it seems likely that the overall balance has fluctuated from pos-itive to negative through time (Tasker et al. 2000).
(2) Enhanced adult mortality and poor breeding per-formance was initially caused by hunting and egg col-lection at breeding sites (Ratcliffe 2004).
(3) Breeding seabirds have also been facing alien species of animals and plants, as well as habitat destruction, which can critically affect their breeding performance (Blackburn 2004).
(4) Finally, a seabird community may be structured by global disturbances impacting its environment and often causing changes in prey availability (e.g. Clarke et al. 2003). The regime shift observed in the North Atlantic and adjacent seas during the mid-1980s (Beaugrand 2004, Alheit et al. 2005, Weijerman et al. 2005) is a good example of this. It is thought that this abrupt shift was the result of higher sea temperatures, which caused a northward latitudinal shift in plankton and fish communities (Beaugrand et al. 2002, Perry et al. 2005). Such modifications might have affected the Britain and Ireland seabird community, which is largely constituted of boreal species at the southern edge of their range (Mitchell et al. 2004).
In this study we used published accounts of the spatial distribution of breeding seabirds around Britain and Ireland in 1875 to 1900 and 1968 to 1972 (Holloway 1996); distribution and abundance data from 3 breeding seabird censuses in Britain and Ireland in 1969 to 1970, 1985 to 1988 and 1998 to 2002 (Mitchell et al. 2004); and a bioenergetics model to determine population and distributional trends, as well as body mass trends and overall energy require-ments. We also used at-sea distributions of seabirds (extracts from the European Seabirds at Sea database [ESAS] from 1979 to 2002) and a bioenergetics model to explore the spatial distribution of seabird predation on marine resources of the North Sea and surround-ing waters (English Channel, Baltic Sea and the zones of contact with the North Atlantic), comparing patterns between the breeding and non-breeding seasons for 1979 to 1985 and 1990 to 1995 (before and after the 1983 to 1988 regime shift; Beaugrand 2004).
The overall aim of our study was to investigate the characteristics of the seabird community from Britain and Ireland during a period of great anthropogenic impact, the 20th century. We hypothesized that if major changes occurred within this community, they affected: (1) the species composition, (2) global popula-tion and distribupopula-tion trends, (3) trophic status, (4) pre-dation pressure of the community upon marine resources, and (5) the spatial distribution of this preda-tion pressure.
MATERIALS AND METHODS
Study area. The geographic zones considered are:
(1) Britain and Ireland and (2) the North Sea and adja-cent waters, i.e. the English Channel, the western Baltic Sea and the zone of contact with the North Atlantic, corresponding to the Zones VIIh, VIIe, VIId, IVc, IVb, IVa and IIIa of the International Council for the Exploration of the Seas (ICES).
Seabird populations of Britain and Ireland between 1875 and 1972. This analysis focused on 25 seabird
species (Category 1 in Table 1) using data from Hol-loway (1996), that details the presence or absence of breeding seabirds by counties and by species of Britain and Ireland in 1875 to 1900 and 1968 to 1972. We
cal-culated changes in numbers of counties occupied between the 2 periods (e.g. positive values correspond to an increase in the number of occupied counties).
Seabird populations of Britain and Ireland between 1969 and 2002. This analysis concerned 22 species of
seabirds (Category 2 in Table 1) that breed in Britain and Ireland, and used data from Mitchell et al. (2004), who summarize 3 population censuses: Operation Sea-farer (1969 to 1970), Seabird Colony Register (SCR) census (1985 to 1988) and Seabird 2000 (1998 to 2002). Spatial coverage increased with each subsequent survey, with almost complete coverage in the Seabird 2000 census (in Operation Seafarer, coverage was con-fined to coastal colonies and a part of inland colonies was recorded in the SCR census; more details in
Order Family Species Common name Body mass (g) Category
Charadriiformes Alcidae Cepphus grylle Black guillemot 385 1, 2, 3
Uria aalge Common guillemot 836 1, 2, 3 Fratercula acrtica Atlantic puffin 415 1, 2, 3
Alca torda Razorbill 677 1, 2, 3
Alle alle Little auk 155 3’
Laridae Larus argentatus Herring gull 988 1, 2, 3
Larus fuscus Lesser black-backed gull 814 1, 2, 3
Larus canus Mew gull 410 1, 2, 3
Larus melanocephalus Mediterranean gull 796 2 Larus marinus Great black-backed gull 1622 1, 2, 3 Larus ridibundus Black-headed gull 265 1, 2, 3 Rissa tridactyla Black-legged kittiwake 393 1, 2, 3
Larus minutus Little gull 120 3
Larus hyperboreus Glaucous gull 1326 3’
Stercorariidae Catharacta skua Great skua 1431 1, 2, 3
Stercorarius longicaudus Long-tailed skua 350 3’ Stercorarius pomarinus Pomarine skua 725 3’ Stercorarius parasiticus Arctic skua 465 1, 2, 3
Sternidae Sterna paradisaea Arctic tern 102 1, 2, 3
Sterna sandvicensis Sandwich tern 249 1, 2, 3 Sterna dougallii Roseate tern 115 1, 2 Sterna hirundo Common tern 125 1, 2, 3 Sterna albifrons Little tern 49 1, 2 Pelecaniformes Phalacrocoracidae Phalacrocorax carbo Great cormorant 2300 1, 2, 3
Phalacrocorax aristotelis European shag 1763 1, 2, 3
Sulidae Morus bassanus Northern gannet 3015 1, 2, 3
Procellariiformes Hydrobatidae Oceanodroma leucorhoa Leach’s storm-petrel 44 1, 3 Hydrobates pelagicus European storm-petrel 25 1, 3 Procellariidae Fulmarus glacialis Northern fulmar 758 1, 2, 3
Calonectris diomedea Cory’s shearwater 750 3’ Puffinus puffinus Manx shearwater 419 1, 3 Puffinus gravis Great shearwater 850 3’ Puffinus griseus Sooty shearwater 819 3’
Gaviiformes Gaviidae Gavia arctica Black-throated diver 3000 3’
Gavia immer Great Northern diver 3950 3’ Gavia stellata Red-throated diver 1625 3’ Podicipediformes Podicipedidae Podiceps auritus Slavonian grebe 412 3’ Podiceps cristatus Great Crested grebe 975 3’ Podiceps grisegena Red-necked grebe 800 3’
Anseriformes Anatidae Somateria mollissima Common eider 1600 1, 3’
Table 1. Britain and Ireland seabird community species considered in our study. Categories: 1, Seabird population trends in Britain and Ireland between 1875 and 1972; 2, seabird population trends in Britain and Ireland between 1969 and 2002; 3 and 3’,
Mitchell et al. 2004). The quality of the data also improved with time through the development of improved methods (e.g. Seabird 2000 was the first sur-vey to use tape-playback methods and consequently achieved much more accurate estimates of shear-waters and petrels).
Since we were primarily interested in global trends, we used total numbers for each species (sum of all individuals at all breeding sites) and we calculated species-specific population growth rates between the different censuses. For each census period, we also calculated the average body mass of all seabirds within the community (BMac; g):
(1) where BMiis the body mass of each species i in grams
(Cramp 1992, Wilson et al. 2004), Numbersi is the
number of individuals for each species i and Numberscommunityis the total size of the community.
Seabird predation around Britain and Ireland. We
used the bioenergetics approach detailed in Tasker & Furness (1996), and Grémillet et al. (2003) to estimate the yearly food requirements of 40 seabird species for time periods 1969 to 1970, 1985 to 1988 and 1998 to 2002. These species are listed in Table 1 (Category 3). Population size was calculated by adding total num-bers of breeding birds, extracted from Mitchell et al. (2004) and estimates of numbers of juveniles and of adult non-breeders. The proportion of juveniles was calculated after Cairns et al. (1991), and the proportion of adult non-breeders after Barrett et al. (2006). Species-specific energy requirements of adults and chicks were taken from the literature when available, or estimated using allometric equations detailed in Ellis & Gabrielsen (2002). Field metabolic rates (FMR) were used to estimate energy requirements (ER; kJ d–1) of seabirds during the breeding season (those of adults ERadult, plus those of the chick) and during the non-breeding season (ERadultonly) (see Tables 2 & 3). The average number of chicks per nest was taken from the database of the British Trust for Ornithology (avail-able at www.bto.org). Body masses (BM; g) were extracted from Cramp (1992) and Wilson et al. (2004). A fixed energy density of prey of 5.5 kJ g–1wet mass was assumed (see Barrett et al. 2006). The assimilation efficiency (%) was set to 75% for adults (ICES 2000) and to 80% for chicks (Ellis & Gabrielsen 2002), except when specific information was available for the species considered (Ellis & Gabrielsen 2002).
Seabird predation in the North Sea. We followed
the same bioenergetics approach as above, but instead of calculating the predation using total population numbers, we investigated the spatial distribution of seabird predation in the North Sea. Energy
require-ments were calculated as previously (see ‘Seabird pre-dation around Britain and Ireland’). We used data from the ESAS database (from 1979 to 2002), covering 3 235 434 km2of the North Sea and including 310 000 seabird sightings. In the 3 235 434 km2 sampled, 37 different species were observed (Table 1). These observations were compiled using a spatial resolution of 15’ latitude × 30’ longitude for 2 time periods: 1979 to 1985 and 1990 to 1995, which were split into 2 phases: (1) the breeding season (April to June) and (2) the non-breeding season (October to February); 36 species were considered (Table 1). Species with <100 individuals for each time period and season were excluded from the analysis. Since sampling effort was not uniform in space and time we used bootstrapping methods to resample all data and reduce this bias. Bootstrapping is often used as an alternative to infer-ence based on parametric assumptions when those assumptions are in doubt, or where parametric infer-ence is impossible or requires very complicated formu-las for the calculation of standard errors (Efron & Tib-shirani 1993). Seabird predation was then calculated per square kilometer of the entire study area for each time period and season by multiplying the estimated abundance of each seabird species by its food require-ments and adding these total requirerequire-ments for all spe-cies present (ICES 2000). Firstly, we estimated daily food intake (DFI):
(2) where DFIiis the daily food intake for each species i
(kg of food), ERiis the energy requirements for each
species i (in kJ d–1), FED
preyis the fixed energy density of prey of 5.5 kJ g–1 wet mass and 0.75 (75% is the mean assimilation efficiency for each species i).
Total food consumption per square kilometer was then estimated as:
(3) where PPkm2is the predation per square kilometer (kg of food), FIi season is the food intake for each species i
according to the target season (kg of food), and ADiis
the adjusted density of each species i (density per km2 sampled; seabird density at sea is adjusted by using various correction factors to account for, e.g., de-tectability of different species at various distances from the survey platform; details in Stone et al. 1995). Predation per square kilometer was calculated separately for each season (the breeding season lasts for 91 d and the non-breeding season for 151 d) and each time period. Data were projected into a standard background map of the North Sea provided by ICES (www.ices.dk, accessed 31 July 2007) with the planar projection GSC WGS 1984 using ArcView 8.2.
PPkm2 =
∑
(FIiseason×ADi) DFI ER FEDprey i = i × . 1 0 75 BM BM Numbers Numbers ac community =∑
i× iStatistical analyses. We considered 3 factors
accord-ing to their ecological importance (e.g. Nagy et al. 1999): taxonomic status (i.e. family), ecological niche (i.e. diet; Cramp 1992) and average body mass of each species. To standardise these 3 factors in qualitative data, we used body mass classes for all species. According to Sturges’ rule (Sturges 1926), we divided the community into 5 classes of very small (0 to 603 g), small (604 to 1206 g), intermediate (1207 to 1809 g), large (1810 to 2412 g) and very large species (2313 to 3015 g). We used Dixon’s test to detect outlier species on a whole-species basis (Gibbons 1994). Two-factor ANOVA or general linear models (i.e. GLM) were used to test for these factors (i.e. family, diet and body mass class) and periods (i.e. 1875 to 1900 and 1968 to 1972) on occupied county numbers of breeding seabirds and proportional species composition (i.e. seabird numbers of each species divided by total seabird numbers). Stu-dent’s t-tests were used to examine change in seabird numbers between the different censuses according to the same 3 ecological factors. Kruskal-Wallis tests allowed us to perfect these analyses, and Wilcoxon U-tests, to compare the average body mass of community members at the different periods. We also employed a standardised principal component analysis (PCA) and a cluster analysis to detect spatial and temporal trends in the seabird community using data from Mitchell et al. (2004). The standardised PCA was applied on a table of 108 observations (36 counties × 3 time periods) and 14 variables (14 species). Prior to the analysis, abundance data for each county and species (xi) were
normalised so that the sum of the square of the time periods was equal to 1. The transformation yiwas done
as follows:
(4)
yiis the transformed abundance data for time period i,
xithe original abundance data for time period i, and n
the number of time periods (n = 3). This normalisation procedure was used to give the same weight to each species and county (Beaugrand & Ibañez 2004). Such transformation is commonly applied in 3-mode PCA (Beaugrand et al. 2000).
Eigenvectors were normalised as follows:
(5)
Un being the matrix of normalised eigenvectors, U
being the matrix of eigenvectors and Λ being the diag-onal matrix of eigenvalues. Thus, the variables in the space of eigenvectors represented the linear correla-tion with the first and the second principal component (Legendre & Legendre 1998). This allowed us to add a circle of correlation of 1. When variables are close to
this circle, they contribute significantly to the space. The circle of equilibrium descriptor contribution C (Legendre & Legendre 1998) was also represented to see which variables contribute most strongly to the reduced space. C was calculated as follows:
(6) d is the number of dimensions, and p is the number of variables used in the analysis. d was equal to 2 in the PCA, p = 14 species and therefore C = 0.38. All vari-ables inside the circle are not correctly represented in this space.
A cluster analysis based upon Ward’s procedure (i.e. minimization of intra-class variance) was employed to further investigate spatial structure. Regions showing homogeneous variation over time were identified and combined to represent county clusters based on spe-cies composition. This cluster analysis was applied for each time period over the period 1969 to 1970 and 1985 to 1988, we did not take inland zones into account because they were not, or only partially, surveyed (Mitchell et al. 2004).
Analyses were conducted using Minitab and Matlab, with an accepted p-level at 0.05.
RESULTS
Seabird populations of Britain and Ireland between 1875 and 1972
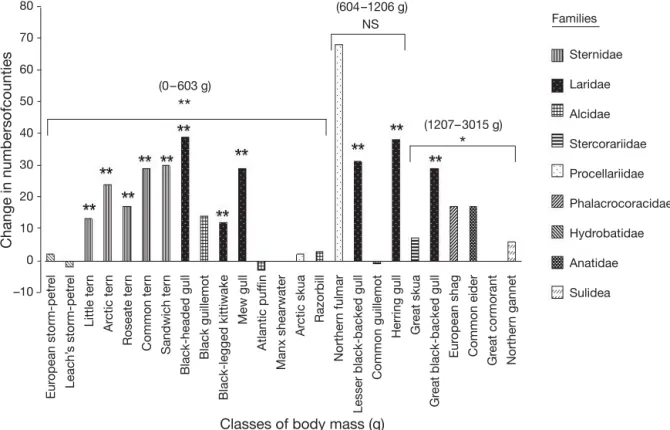
Between 1875 and 1972 no seabird species was lost and there was an overall expansion in breeding range of the seabird population of Britain and Ireland, with the number of counties occupied increasing from 31 to 47 (F1,48= 5.43, p = 0.024). This geographical expan-sion likely stems from population growth. For instance, northern gannets Morus bassanus markedly extended both their breeding range (10 counties occupied in 1900 and 19 in 1969 to 1970) and total population size (49 000 breeding pairs in 1900 and 187 908 from 1984 to 1988) during this period. Changes in species range expansion were also significantly influenced by tax-onomy (F8,41= 6.06, p < 0.001), but not by body mass (F5,45= 1.61, p = 0.189). Out of 9 studied families, only the Sternidae and Laridae occupied significantly more counties in 1972 than in 1875 (t5= 6.80, p = 0.002 and t6 = 7.48, p = 0.001, respectively; Fig. 1). Piscivorous species occupied more counties in later periods (t13= 3.60, p = 0.004), as well as the smallest species (class of body mass 0 to 603 g; t14= 3.68, p = 0.002), and the largest species (classes of body mass 1207 to 3015 g; t6= 2.98, p = 0.031; Table 1). C d p = Un = ΛU 1 2 y x x i i i i n = =
∑
2 1Seabird populations of Britain and Ireland between 1969 and 2002
Between 1969 and 2002 there was no species loss and proportional species composition remained un-changed (F2,56< 0.001, p = 1.000; e.g. European shag featured 1.2% of the overall populations in 1969 to 1970, 3.3% in 1985 to 1988 and 1.7% in 1998 to 2002). Our analysis revealed a significant effect of seabird body mass classes on community composition (H4 = 23.32, p < 0.001). The body mass class 604 to 1206 g was the most numerous in recent times; for example, it corresponded to approximately 60% of total numbers between 1998 and 2002. Piscivorous species were also numerous (65.75% in 1969 to 1970, 74.3% in 1985 to 1988 and 75% in 1998 to 2002).
Seabird breeding populations increased by 34% (4 780 000 to 6 396 000 ind.) between 1969 and 2002, rep-resenting an augmentation of approximately 1% yr–1. The initial growth rate was 25% between 1969 and 1988, subsequently decreasing to 7% between 1985 and 2002. This rate was not influenced by body mass classes (F4,52 = 0.54, p = 0.704), with the exception of species weighing between 1207 and 3015 g. The 9 species contained in this class declined by 12.7% between 1969 to 1970 and 1985 to 1988 (t5= 7.18, p = 0.002). Taxonomic status had a significant impact on population trends (F6,43= 3.88, p = 0.003). The Sternidae declined significantly (t5= –7.43,
p = 0.002). In 1969, tern numbers corresponded to 3.6% of total community numbers, against 2.2% in 2002. Laridae numbers also decreased between 1969 and 1988 (t5= –4.40, p = 0.012), but stabilized between 1988 and 2002, with a similar growth rate to the whole community (t5= 1.09, p = 0.336). Piscivorous species had a higher population growth rate than other species between 1969 and 1988 (t11= –3.98, p = 0.003), but not between 1988 and 2002 (t11= –1.68, p = 0.124).
The average body mass of community members showed no significant change during the study period (U22 = 115.0, p = 0.721). Nevertheless, it increased slightly from 804 g in 1969 to 860 g in 2002.
Spatial analyses of seabird population trends between 1969 and 2002
Long-term spatial changes were examined for 14 species using a standardised PCA. Values of the first principal component increased with time for nearly all counties taken into consideration in the analysis (Fig. 2). Species that were positively correlated with the first component exhibited an increase in abun-dance between 1969 to 1970 and 1985 to 1988, the time of the North Sea regime shift. Timing of the regime shift in the North Sea is between 1982 and 1988 according to species (Beaugrand 2004). Herring gull
Sternidae Laridae Alcidae Stercorariidae Procellariidae Phalacrocoracidae Hydrobatidae Anatidae Sulidea 80 70 60 50 40 30 20 10 0 –10
**
(0– 603 g) NS (604–1206 g)*
(1207– 3015 g) Families Eur opean storm-petr e l Leach’ s storm-petr e l Little ter n Ar ctic ter n Roseate ter n Common ter n Sandwich ter n Black-headed gull Black guillemot Black-legged kittiwake Mew gull Atlantic puf fin Manx shearwater Arctic skua Razorbill
Norther
n fulmar
Lesser black-backed gull
Common guillemot
Herring gull Gr
eat skua
Gr
eat black-backed gull
Eur opean shag Common eider Gr eat cormorant Norther n gannet
Classes of body mass (g)
Change in numbersofcounties
Fig. 1. Change in the number of counties of Britain and Ireland occupied by seabirds in 1875 and in 1972 according to their taxonomic status and their body mass (g). NS: non-significant difference between the 2 time periods; *p < 0.05; **p < 0.025
–4 –3 –2 –1 0 1 2 3 4
c
Second principal component
–4 –3 –2 –1 0 1 2 3 4
b
First principal component
1969–1970 1985–1988 1998–2002 –5 1 5 9 13 17 21 25 29 33 37 41 45 49 53 57 61 65 69 73 77 81 85 89 93 97 101 105 1 5 9 13 17 21 25 29 33 37 41 45 49 53 57 61 65 69 73 77 81 85 89 93 97 101 105 Fig. 2. Standardised PCA for 108 observations (counties and periods) × 14
species. (a) Normalised Eigenvectors 1 and 2 (35.57% of the total variance); both circle of correlation (outer circle) and circle of equilibrium (inner circle) descriptor contribution (C = 0.38) are displayed. The latter circle allows an examination of the contribution of each descriptor in the reduced space. A variable inside this circle has a non-significant contribu-tion. (b) Long-term changes in the first principal component. (c) Long-term changes in the second principal component. Numbers are counties and the 3 levels of grey indicate the 3 time periods considered in the analysis. Counties were coded as follows: (1, 37, 73 for time periods 1, 2 and 3, re-spectively) Shetland; (2, 38, 74) Orkney; (3, 39, 75) Caithness; (4, 40, 76) Sutherland; (5, 41, 77) Ross & Cromarty; (6, 42, 78) Banff & Buchan; (7, 43, 79) Gordon; (8, 44, 80) Kincardine & Deeside; (9, 45, 81) Northeast Fife; (10, 46, 82) East Lothian; (11, 47, 83) Stewartry; (12, 48, 84) Wigtown; (13, 49, 85) Kyle & Carrick; (14, 50, 86) Argyll & Bute; (15, 51, 87) Lochaber; (16, 52, 88) Skye & Lochalsh; (17, 53, 89) Western Isles Comhairle nan eilean; (18, 54, 90) Northumberland; (19, 55, 91) Dorset; (20, 56, 92) Channel Is-lands; (21, 57, 93) Cornwall; (22, 58, 94) Isles of Scilly; (23, 59, 95) Devon; (24, 60, 96) Cumbria; (25, 61, 97) Isle of Man; (26, 62, 98) Dyfed; (27, 63, 99) Gwynedd; (28, 64, 100) Co. Antrim; (29, 65, 101) Co. Down; (30, 66, 102) Co. Dublin; (31, 67, 103) Co. Wexford; (32, 68, 104) Co. Cork; (33, 69, 105) Co. Kerry; (34, 70, 106) Co. Galway; (35, 71, 107) Co. Mayo; (36, 72, 108)
Co. Donegal –0.8 –0.6 –0.4 –0.2 0.2 0.4 0.6 0.8 –0.8 –0.6 –0.4 –0.2 0.2 0.4 0.6 0.8 GBB gull Her gull Razorbill Eur shag Atl puffin LBB gull Lit tern Com guil Kit Corm Fulmar Com tern BH gull Arct tern PC I (21.19% of the total variance) PC II (14.38% of the total variance)
a
Larus argentatus and great black-backed gull Larus marinus showed a decrease in abundance between 1969 to 1970 and 1985 to 1988, which reversed in some counties between 1998 and 2002 (Fig. 2). All terns, and black-legged kittiwakes Rissa tridactyla, showed a decrease in abundance after the period from 1985 to 1988 in the majority of the counties (Fig. 3).
For the remaining seabird species within the com-munity, the PCA did not reveal significant changes for the 1962 to 2002 time period, except in Shetland. In this region there was a decrease in the size of colonies for all species except black-headed gull after the period from 1985 to 1988 (Figs. 2 & 3). Long-term changes in the Shetland colonies are distinct but not opposite from other regions as demonstrated by the first 3 principal components. Similar changes, but not as pronounced as in Shetland, were also observed in a few locations across Britain (Sutherland, Kincardine & Deeside, Wigtown, Lochaber, Gwynedd).
Finally, our cluster analysis revealed spatial structur-ing of the community with 4 independent zones, but with very little variability across the study period. A northern cluster gathering Shetland, Orkney and the
Western Isles-Comhairle nan eilean (Fig. 4, purple), was clearly isolated from the rest. A second cluster (Fig. 4, green), representing primarily Sternidae, the black-headed gull and the lesser black-backed gull, expanded northwards during 1985 to 1988, but subse-quently retreated. The third cluster (Fig. 4, yellow) mainly contained northern gannets and black-legged kittiwakes, and tended to decrease its distributional range during the study period. Finally, a last area corresponding to inland populations could only be displayed for the 1998 to 2002 period, and showed no specific core area (Fig. 4, blue).
Seabird predation around Britain and Ireland
The seabird community of Britain and Ireland weighed a total of 40 380 t in 1969 to 1970, 58 910 t in 1985 to 1988 and 71 200 t in 1998 to 2000. We estimated that it consumed 378 500 t of food yr–1 in 1969 to 1970, 577 200 t yr–1in 1985 to 1988 and 813 200 t yr–1in 1999 to 2002. Seabird predation around Britain and Ireland has therefore increased by 115% since the 1970s. –4 –3 –2 –1 0 1 2 3 4
b
Thir d principal component 1969–1970 1985–1988 1998–2002 1 5 9 13 17 21 25 29 33 37 41 45 49 53 57 61 65 69 73 77 81 85 89 93 97 101 105 Fig. 3. Standardised PCA for 108 observations (counties andperiods) × 14 species. (a) Normalised eigenvectors 1 and 3 (33.91% of the total variance); both circle of correlation (outer circle) and circle of equilibrium (inner circle) descriptor contri-bution (C = 0.38) are displayed. The latter circle allows an examination of the contribution of each descriptor in the re-duced space. A variable inside this circle has a non-significant contribution. (b) Long-term changes in the third principal component. Numbers are counties and the 3 levels of grey indicate the 3 time periods considered in the analysis.
Coun-ties were coded as in Fig. 2
–0.8 –0.6 –0.4 –0.2 0. 0.4 0.6 0.8 –0.8 –0.6 –0.4 –0.2 0.2 0.4 0.6 0.8 PC I (21.19% of the total variance) PC III (12.72% of the total variance) GBB gull Her gull Razorbill Eur shag LBB gull Lit tern Com guil Kit Corm Fulmar Com tern BH gull Arct tern Atl puffin
a
2Seabird predation in the North Sea
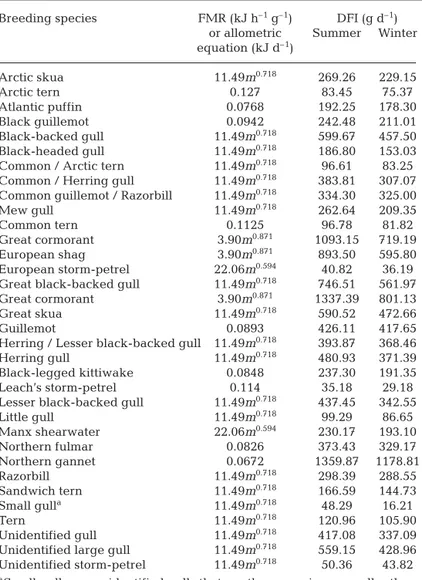
Our calculations indicate that northern gannets have the highest daily food requirements of all North Sea seabirds (1360 g d–1in summer and 1179 g d–1in winter), followed by great cormorants (1337 g d–1in summer and 801 g d–1in winter). These values accord well with pre-vious estimates provided by Grémillet et al. (2000) and Enstipp et al. (2006). Conversely, Sandwich terns and Leach’s storm-petrels are predicted to have the lowest food requirements (32 and 35 g d–1in summer and 16 and 29 g d–1in winter, respectively). Note that summer food requirements are higher because of the additional energy demand of the brood (Tables 2 & 3).
During the summers of 1979 to 1985, predation was highest in the western North Sea, more specifically, along the east coast of Scotland, around Orkney, Shet-land, and in the northern North Sea. Summer predation increased markedly during the 1990 to 1995 time pe-riod, with a north-eastward shift in predation pressure (Fig. 5a). During the winter period from 1979 to 1985, predation was most intense in the central western North Sea, off the east coast of England and Scotland, and south of Shetland. The pattern generally remained during the 1990 to 1995 period, although there was also a shift in predatory pressure towards the eastern North Sea (Fig. 5b). These eastward shifts during the winter and summer periods 1990 to 1995 compared to 1979 to 1985 might be partly due to more extensive seabird monitoring in the eastern North Sea and the Baltic Sea.
DISCUSSION
Our results indicate that the seabird community of Britain and Ireland has prospered in the 20th century. This contrasts with the fate of the global avifauna (Owens 2000, Pimm et al. 2006), land bird communities from tropical and sub-tropical areas (Sekercioglu et al. 2002, Sodhi et al. 2004), the European land bird com-munity (Julliard et al. 2004) and the worldwide seabird community, within which the petrels have been mas-sively affected by incidental catches on fishing lines (BirdLife International 2001).
Some caution is nevertheless required in interpret-ing our findinterpret-ings. The databases used are outstandinterpret-ing sources of information but remain incomplete. For instance, population data (Mitchell et al. 2004) were not recorded for some zones and species during Operation Seafarer and the SCR census. In addition, although we included a spatial dimension to our analysis, the lack of real time series might have blurred any potential impact of the 1980s regime shift on the seabird community (Beaugrand 2004). Furthermore, sampling of seabird abundance and distribution in the North Sea was not standardised, i.e. some zones and/or time periods were more intensively monitored than others. We did, however, use a bootstrapping resampling technique to reduce this spatiotemporal bias. Data randomisation tempered the fact that: (1) estimates of population numbers obtained at sea were not temporally and spatially uniform (Camphuysen et
Fig. 4. Cluster analyses of seabird breeding distribution in Britain and Ireland in 1969 to 1970, 1985 to 1988 and 1998 to 2002 allowed the distinction of 4 different zones (marked in purple, green, yellow and blue; see ‘Results’ for details). Grey zones show areas for which no
al. 1995) and (2) estimates were inaccurate because when data on at-sea seabird distribution and abun-dance were collected, specific areas were surveyed and these were not chosen randomly (Van der Meer & Camphuysen 1996). Finally, although both the struc-ture and the input values of our bioenergetics models were as realistic as possible, we must stress that all calculations presented here are theoretical.
Further investigations are therefore required, and, in particular, continued, accurate long-term monitoring of seabird numbers, investigations of seabird at-sea distribution and abundance, and refined knowledge of seabird foraging behaviour and energetics, especially for species <1000 g, which dominate the community, but have been far less studied than larger species.
Despite such limitations, important con-clusions emerge from our analyses. Un-like in many perturbed ecosystems, no species has disappeared from the seabird community of Britain and Ireland during the 20th century, and, generally speak-ing, abundance has been increasing. Moreover, the phylogenic and geographic structure of the community has remained fairly stable during the study period (no species loss, no major change in geo-graphic structure), despite a slight in-crease in average body mass potentially suggesting an impoverishment of trophic width typical of strongly perturbed marine food webs (Pauly et al. 1998).
Despite a marked disturbance, the sea-bird community of Britain and Ireland on the whole has prospered during the 20th century. We propose 3 potential, mutually non-exclusive explanations for this com-munity growth.
Firstly, it is highly likely to have fea-tured a recovery period after centuries of persecution: seabirds were extensively hunted, but protection measures since the end of the 19th century (1869 ‘Protection of Birds at Sea’ Act) have meant that their exploitation has now largely diminished. Initially, legislation proved most benefi-cial for the Laridae and Sternidae. This could be explained by the fact that these 2 groups usually breed at sites which are accessible and are consequently more open to persecution than other seabird species (Lloyd et al. 1991). As seabirds are long-lived animals with a low reproduc-tive rate, the majority of their populations only started to show signs of recovery after several decades, with growth being most apparent during the second half of the 20th century. Over the last 15 yr population growth rates have declined, suggesting that some species, such as northern gannets and black-legged kittiwakes, are now being regulated via density-dependent effects (Frederiksen et al. 2005, Wanless et al. 2005).
Secondly, the impact of human fisheries appears to have been mostly beneficial to the seabird community of Britain and Ireland, mainly by removing potential seabird competitors from the system (large predatory fish) and/or by producing vast amounts of additional seabird food via fishery refuses (see ‘Introduction’). For instance, seabird species weighing >1200 g declined between 1969 and 1988, but became constant after-wards. This stabilization and consequent range expan-Breeding species FMR (kJ h–1g–1) DFI (g d–1)
or allometric Summer Winter equation (kJ d–1) Arctic skua 11.49m0.718 269.26 229.15 Arctic tern 0.127 83.45 75.37 Atlantic puffin 0.0768 192.25 178.30 Black guillemot 0.0942 242.48 211.01 Black-backed gull 11.49m0.718 599.67 457.50 Black-headed gull 11.49m0.718 186.80 153.03
Common / Arctic tern 11.49m0.718 96.61 83.25
Common / Herring gull 11.49m0.718 383.81 307.07
Common guillemot / Razorbill 11.49m0.718 334.30 325.00
Mew gull 11.49m0.718 262.64 209.35
Common tern 0.1125 96.78 81.82
Great cormorant 3.90m0.871 1093.15 719.19
European shag 3.90m0.871 893.50 595.80
European storm-petrel 22.06m0.594 40.82 36.19
Great black-backed gull 11.49m0.718 746.51 561.97
Great cormorant 3.90m0.871 1337.39 801.13
Great skua 11.49m0.718 590.52 472.66
Guillemot 0.0893 426.11 417.65
Herring / Lesser black-backed gull 11.49m0.718 393.87 368.46
Herring gull 11.49m0.718 480.93 371.39
Black-legged kittiwake 0.0848 237.30 191.35
Leach’s storm-petrel 0.114 35.18 29.18
Lesser black-backed gull 11.49m0.718 437.45 342.55
Little gull 11.49m0.718 99.29 86.65 Manx shearwater 22.06m0.594 230.17 193.10 Northern fulmar 0.0826 373.43 329.17 Northern gannet 0.0672 1359.87 1178.81 Razorbill 11.49m0.718 298.39 288.55 Sandwich tern 11.49m0.718 166.59 144.73 Small gulla 11.49m0.718 48.29 16.21 Tern 11.49m0.718 120.96 105.90 Unidentified gull 11.49m0.718 417.08 337.09
Unidentified large gull 11.49m0.718 559.15 428.96
Unidentified storm-petrel 11.49m0.718 50.36 43.82 aSmall gulls are unidentified gulls that are the same size or smaller than
mew gulls (i.e. 410 g)
Table 2. Daily food intake (DFI) of the breeding seabird species considered in our study, according to their field metabolic rates (FMR) or allometric equation for species or species groups (Ellis & Gabrielsen 2002). m: body
sion (Lloyd et al. 1991) may have been due to increased levels of fishery discard, food which is predominantly gathered by large species such as great skua, great black-backed gull and northern gannet (Garthe & Hüppop 1994, Votier et al. 2004).
Finally, climate change and the accompa-nying ecosystem shift, which affected the en-tire North Atlantic during the 1980s, signifi-cantly raised ocean temperatures in the North Sea (Beaugrand 2004), and may have created more favourable environmental conditions for some seabird species (Thompson 2006).
Overall, our study shows that the seabird community of Britain and Ireland has been re-markably resilient to environmental change in the 20th century. However, the relative importance of protection measures at breed-ing sites, positive and negative impacts of industrial fisheries and climate change remain unclear and deserve further analysis. The apparent growth of the seabird com-munity of Britain and Ireland in the 20th cen-tury contrasts strongly with some regional and species-specific patterns during this period. For example, seabird breeding num-bers in Shetland, in particular for terns and black-legged kittiwakes, showed dramatic declines from the late 1980s, and remain in comparatively low numbers (Suddaby & Rat-cliffe 1997, Heubeck et al. 1999, Frederiksen et al. 2005, Harris et al. 2006). Reasons for these trends remain unclear, although they might be linked to a fishery-induced and/or climate-driven regional population crash of the lesser sandeel Ammodytes marinus, an essential prey item for the local marine avi-fauna (Arnott & Ruxton 2002).
Since 2004, spectacular breeding failures of formerly abundant species, such as the black-legged kittiwake, have not only been recorded in Shetland, but also all along the east coast of Britain (Mavor et al. 2005, 2006, Wanless et al. 2005). The current hypothesis states that these declines are linked to low availability and low energy content of lesser sandeels. This may have resulted from a trophic cascade driven by warmer water tem-peratures in the eastern Atlantic (Beaugrand et al. 2000, Wanless et al. 2007).
Non breeding species Allometric DFI (g d–1)
in the zone equation (kJ d–1) Summer Winter
Black-throated diver 16.69m0.651 742.40 742.40
Common eider 16.69m0.651 493.08 493.08
Cory’s shearwater 22.06m0.594 272.88 272.88
Glaucous gull 11.49m0.718 486.28 486.28
Great Crested grebe 16.69m0.651 357.17 357.17
Great Northern diver 16.69m0.651 888.01 888.01
Great shearwater 22.06m0.594 293.94 293.94
Great / Cory’s shearwater 22.06m0.594 283.54 283.54
Little auk 11.49m0.718 104.12 104.12 Long-tailed skua 11.49m0.718 186.87 186.87 Pomarine skua 11.49m0.718 315.22 315.22 Red-necked grebe 16.69m0.651 314.01 314.01 Red-throated diver 16.69m0.651 498.08 498.08 Slavonian grebe 16.69m0.651 204.02 204.02 Sooty shearwater 22.06m0.594 287.52 287.52 Unidentified auk 11.49m0.718 239.33 239.33 Unidentified diver 16.69m0.651 719.50 719.50
Table 3. Daily food intake (DFI) of non-breeding seabird species considered in our study, according to their field metabolic rate (FMR), estimated by an allometric equation (Ellis & Gabrielsen 2002). m: body
mass in grams
Fig. 5. Percentage change in: (a) summer and (b) winter seabird predation between the 1979 to 1985
Acknowledgements. We thank the many people who gath-ered seabird data around Britain and Ireland, and in the North Sea, in particular, ESAS data providers from Instituut voor Bos- en Natuuronderzoek, The Netherlands, Instituut voor Natuur- en Bosonderzoek, Belgium, Joint Nature Con-servation Committee, National Environmental Research Insi-tute Kalo, Norsk Institutt for Naturforskning; Ornis Consult, University College Cork and Vogelwarte Helgoland.
LITERATURE CITED
Alheit J, Möllmann C, Dutz J, Kornilovs G, Loewe P, Mohrholz V, Wasmund N (2005) Synchronous ecological regime shifts in the central Baltic and the North Sea in the late 1980s. ICES J Mar Sci 62:1205–1215
Arnott SA, Ruxton GD (2002) Sandeel recruitment in the North Sea: demographic, climatic and trophic effects. Mar Ecol Prog Ser 238:199–210
Barbraud C, Weimerskirch H (2003) Climate and density shape population dynamics of a marine top predator. Proc R Soc Lond B Biol Sci 270:2111–2116
Barrett JH, Locker AM, Roberts MR (2004) The origins of intensive marine fishing in medieval Europe: the English evidence. Proc R Soc Lond B Biol Sci 271:2417–2421 Barrett RT, Chapdelaine G, Anker-Nilsson T, Mosbech A,
Montevecchi WA, Reid J, Veit RR (2006) Seabird numbers and prey consumption in the North Atlantic. ICES J Mar Sci 63:1145–1158
Beaugrand G (2004) The North Sea regime shift: evidence, mechanisms and consequences. Prog Oceanogr 60:245–262 Beaugrand G, Ibañez F (2004) Monitoring marine plankton ecosystems. II. Long-term changes in North Sea calanoid copepods in relation to hydro-climatic variability. Mar Ecol Prog Ser 284:35–47
Beaugrand GF, Ibañez PC, Reid PC (2000) Spatial, seasonal and long-term fluctuations of plankton in relation to hydroclimatic features in the English Channel, Celtic Sea and Bay of Biscay. Mar Ecol Prog Ser 200:93–102 Beaugrand G, Reid PC, Ibañez F, Lindley JA, Edwards M
(2002) Reorganisation of North Atlantic marine copepod biodiversity and climate. Science 296:1692–1694
BirdLife International (2001) Threatened birds of the world. Available at http://www.birdlife.org
Blackburn TM (2004) Avian extinction and mammalian intro-ductions on oceanic islands. Science 305:1955
Butchart SHM, Stattersfield AJ, Bennun LA, Shutes SM, Akçakaya HR, Baillie JEM, Stuart SN (2004) Measuring global trends in the status of biodiversity: red list indices for birds. PLoS Biol 2(12):e383
Cairns DK, Chapdelaine G, Montevecchi WA (1991) Prey exploitation by seabirds in the Gulf of St. Lawrence. In: Therriault JC (eds) The Gulf of St. Lawrence: Small ocean or big estuary? Canadian Special Publication of Fisheries and Aquatic Sciences, Mont-Joli, p 277–291
Camphuysen CJ, Calvo B, Durinck J, Ensor K and others (1995) Consumption of discards by seabirds in the North Sea. Final Report EC DG XIV Research Contract BIO-ECO/93/10, NIOZ-Rep, Netherlands Institute for Sea Research, Texel
Clarke ED, Spear LB, McCracken ML, Marques FF, Borchers DL, Buckland ST, Ainley DG (2003) Validating the use of generalized additive models & at-sea surveys to estimate size and temporal trends of seabird populations. J Appl Ecol 40:278–292
Cramp S (1992) The birds of the western Palearctic, Vol VI: Warblers. In: Cramp S (eds) Handbook of the birds of
Europe, the Middle East and North Africa. Oxford Univer-sity Press, Oxford
Croxall JP, Trathan PN, Murphy EJ (2002) Environmental change and Antarctic seabird populations. Science 297: 1510–1514
Efron B, Tibshirani RJ (1993) An introduction to the bootstrap. Monographs on statistics and applied probability, No. 57. Chapman & Hall, London
Ellis HI, Gabrielsen GW (2002) Energetics of free-ranging seabirds. In: Schreiber EA, Burger J (eds) Biology of marine birds CRC Press, Boca Raton, p 357–405
Enstipp MR, Daunt F, Wanless S, Humphreys EM, Hamer KC, Benvenuti S, Grémillet D (2006) Foraging energetics of North Sea birds confronted with fluctuating prey avail-ability. In: Boyd IL, Wanless S, Camphuysen CJ (eds) Top predators in marine ecosystems. Symposium of the Zoological Society London. Cambridge University Press, Cambridge, p 191–210
Frederiksen M, Wanless S, Rothery P, Wilson LJ (2004) The role of industrial fisheries and oceanographic change in the decline of North Sea black-legged kittiwakes. J Appl Ecol 41:1129–1139
Frederiksen M, Wright PJ, Heubeck M, Harris MP, Mavor RA, Wanless S (2005) Regional patterns of kittiwake Rissa tridactyla breeding success are related to variability in sandeel recruitment. Mar Ecol Prog Ser 300:201–211 Furness RW (2003) Impacts of fisheries on seabirds
communi-ties. Mediterranean seabirds and their conservation. Sci Mar 67:33–45
Garthe S, Hüppop O (1994) Distribution of ship-following seabirds and their utilization of discards in the North Sea in summer. Mar Ecol Prog Ser 106:1–9
Garthe S, Camphuysen CJ, Furness RW (1996) Amounts of discards by commercial fisheries and their significance as food for seabirds in the North Sea. Mar Ecol Prog Ser 136:1–11
Gibbons RD (1994) Statistical methods for groundwater mon-itoring. John Wiley & Sons, New York
Grémillet D, Storch S, Peters G (2000) Determining food requirements in marine top-predators: a comparison of three independent methods in great cormorants Phalacro-corax carbo. Can J Zool 78:1567–1579
Grémillet D, Wright G, Lauder A, Carss DN, Wanless S (2003) Modelling the daily food requirements of wintering great cormorants: a bioenergetics tool for wildlife management. J Appl Ecol 40:266–277
Halpern BS, Walbridge S, Selkoe KA, Kappel CV and others (2008) A global map of human impact on marine eco-systems. Science 319:948–949
Harris MP, Heubeck M, Shaw DN, Okill JD (2006) Dramatic changes in the return date of common guillemots to colonies in Shetland, 1962–2005. Bird Study 53:247–252 Heubeck M, Mellor RM, Harvey PV, Mainwood AR, Ridding-ton R (1999) Estimating the population size and rate of decline of kittiwake breeding in Shetland, 1981–97. Bird Study 46:48–61
Holling CS (1973) Resilience and stability of ecological systems. Annu Rev Ecol Syst 4:1–23
Holloway S (1996) The historical atlas of breeding birds in Britain and Ireland 1875–1900. Black Publishers, London Hughes TP, Bellwood DR, Folke C, Steneck RS, Wilson J (2005) New paradigms for supporting the resilience of marine ecosystems. Trends Ecol Evol 20:380–386 Hutchinson WF, van Oosterhout C, Rogers SI, Carvalho GR
(2003) Temporal analysis of archived samples indicates marked genetic changes in declining North Sea cod (Gadus morhua). Proc R Soc Lond B Biol Sci 270:
➤
➤
➤
➤
➤
➤
➤
➤
➤
➤
➤
➤
➤
➤
➤
➤
➤
➤
➤
➤
➤
➤
➤
2125–2132
ICES (International Council for the Exploration of the Sea) (2000) Report of the working group on seabird ecology. Doc. CM, 04, ICES, Aberdeen
Jackson RB, Carpenter SR, Dahm CN, McKnight DM, Naiman RJ, Postel SL, Running SW (2001) Water in a changing world. Ecol Appl 11:1027–1045
Jennings S, Kaiser MJ (1998) The effects of fishing on marine ecosystems. Adv Mar Biol 34:201–352
Julliard R, Jiguet F, Couvet D (2004) Common birds facing global changes: What makes a species at risk? Glob Change Biol 10:148–154
Legendre P, Legendre L (1998) Numerical ecology, 2nd edn. Elsevier Science BV, Amsterdam
Lloyd CS, Tasker ML, Partridge K (1991) The status of seabirds in Britain and Ireland. Black Publishers, London Mavor RA, Parsons M, Heubeck M, Schmitt S (2005) Seabird numbers and breeding success in Britain and Ireland, 2004. Joint Nature Conservation Committee, Peterborough Mavor RA, Parsons M, Heubeck M, Schmitt S (2006) Seabird numbers and breeding success in Britain and Ireland, 2005. Joint Nature Conservation Committee, Peterborough Mitchell PI, Newton SF, Ratcliffe N, Dunn TE (2004) Seabird populations of Britain and Ireland. Results of the Seabird 2000 census (1998–2002). Black Publishers, London Nagy KA, Girard IA, Brown TK (1999) Energetics of
free-ranging mammals, reptiles and birds. Annu Rev Nutr 19: 247–277
Owens IPF (2000) Ecological basis of extinction risk in birds: habitat loss versus human persecution and introduced predators. Proc Natl Acad Sci USA 97:12144–12148 Pauly D, Maclean J (2003) A perfect ocean. In: A perfect
ocean: fisheries and ecosystem in the North Atlantic. Island Press, Washington, DC
Pauly D, Christensen V, Dalsgaard J, Froese R, Francisco T Jr (1998) Fishing down marine food webs. Science 279: 860–863
Perry AL, Low PJ, Ellis JR, Reynolds JD (2005) Climate change and distribution shifts in marine fishes. Science 308:1912–1915
Pimm S, Raven P, Peterson A, Sekercioglu CH, Ehrlich PR (2006) Human impacts on the rates of recent, present, and future bird extinctions. Proc Natl Acad Sci USA 103: 10941–10946
Pinnegar JK, Jennings S, O’Brien CM, Polunin NVC (2002) Long-term changes in the trophic level of the Celtic Sea fish community and fish market price distribution. J Appl Ecol 39:377–390
Ratcliffe N (2004) Causes of seabird population change. In: Poyser T, Poyser AD (eds) Seabird populations of Britain and Ireland. Black Publishers, London, p 407–441 Sekercioglu CH, Ehrlich PR, Daily GC, Aygen D, Goehring D,
Sandí R (2002) Disappearance of insectivorous birds from tropical forest fragments. Proc Natl Acad Sci USA 99: 263–267
Sodhi NS, Liow LH, Bazzaz FA (2004) Avian extinctions from tropical and subtropical forests. Annu Rev Ecol Evol Syst 35:323–345
Stone CJ, Webb A, Barton C, Ratcliffe N and others (1995) An atlas of seabird distribution in north-west European waters. Joint Nature Conservation Committee, Peterborough Sturges HA (1926) The choice of a class interval. J Am Stat
Assoc 21:65–66
Suddaby D, Ratcliffe N (1997) The effects of fluctuating food availability on breeding Arctic terns. Auk 114:524–570 Tasker M, Furness RW (1996) Estimation of food consumption
by seabirds in the North Sea. ICES Coop Res Rep 216: 6–42
Tasker ML, Camphuysen CJ, Cooper J, Garthe S, Monte-vecchi WA, Blaber SJM (2000) The impacts of fishing on marine birds. ICES J Mar Sci 57:531–547
Thompson PM (2006) Identifying drivers of change; Did fish-eries play a role in the spread of North Atlantic fulmars? In: Boyd IA, Wanless S, Camphuysen CJ (eds) Manage-ment of marine ecosystems: monitoring change in upper trophic levels. Cambridge University Press, Cambridge Thompson DR, Furness RW, Walsh PM (1992) Historical changes in mercury concentrations in the marine eco-system of the North and North East Atlantic Ocean as indicated by seabird feathers. J Appl Ecol 29:79–84 Turner MG, Collins SL, Magnuson JJ, Scott Rupp T, Swanson
FJ (2003) Disturbance dynamics and ecological response: the contribution of long term ecological research. Bio-science 53:46–56
Van der Meer J, Camphuysen CJ (1996) Effect of observer differences on abundance estimates of seabirds from ship-based strip transect surveys. Ibis 138:433–437
Votier SC, Furness RW, Bearhop S, Crane JE and others (2004) Changes in fisheries discard rates and seabird com-munities. Nature 427:727–730
Wanless S, Harris MP, Redman P, Speakman JR (2005) Low energy values of fish as a probable cause of a major seabird breeding failure in the North Sea. Mar Ecol Prog Ser 294:1–8
Wanless S, Frederiksen M, Daunt F, Scott BE, Harris MP (2007) Black-legged kittiwakes as indicators of environ-mental change in the North Sea: evidence from long-term studies. Prog Oceanogr 72:30–38
Weijerman M, Lindeboom H, Zuur AF (2005) Regime shifts in marine ecosystems on the North Sea and Wadden Sea. Mar Ecol Prog Ser 298:21–39
White PS, Pickett STA (1985) Natural disturbance and patch dynamics: an introduction. In: Pickett STA, White PS (eds) The ecology of natural disturbance and patch dynamics. Academic Press, New York, p 3–13
Wilson LJ, Bacon PJ, Bull J, Dragosits U and others (2004) Modelling the spatial distribution of ammonia emissions from seabirds in the UK. Env Polit 131:173–185
Wootton JT (1998) Effects of disturbance on species diversity: a multitrophic perspective. Am Nat 152:803–825
Editorial responsibility: Peter Corkeron, Woods Hole, Massachusetts, USA
Submitted: August 21, 2007; Accepted: September 9, 2008 Proofs received from author(s): November 30, 2008