HAL Id: hal-02993423
https://hal.archives-ouvertes.fr/hal-02993423
Submitted on 6 Nov 2020HAL is a multi-disciplinary open access archive for the deposit and dissemination of sci-entific research documents, whether they are pub-lished or not. The documents may come from teaching and research institutions in France or abroad, or from public or private research centers.
L’archive ouverte pluridisciplinaire HAL, est destinée au dépôt et à la diffusion de documents scientifiques de niveau recherche, publiés ou non, émanant des établissements d’enseignement et de recherche français ou étrangers, des laboratoires publics ou privés.
Use of automated speech analysis and facial emotion
measurements on videos to assess the effects of
relaxation devices: a pilot study
Elisa Elleuch, Norma Gomes, Noelia Do Carmo Blanco, Christophe Zimmer,
Nicklas Linz, Alexandra Konig, Rachid Guerchouche, Alice Guyon
To cite this version:
Elisa Elleuch, Norma Gomes, Noelia Do Carmo Blanco, Christophe Zimmer, Nicklas Linz, et al.. Use of automated speech analysis and facial emotion measurements on videos to assess the effects of relaxation devices: a pilot study. Journal of Interdisciplinary Methodologies and Issues in Science, Journal of Interdisciplinary Methodologies and Issues in Science, 2020, Vol. 9 - Methods to assess the effects of sensory stimulations on wellness, �10.18713/JIMIS-021120-9-3�. �hal-02993423�
Use of automated speech analysis and facial emotion measurements on videos
to assess the effects of relaxation devices: a pilot study
Elisa ELLEUCH#1, Norma GOMES#1, Noelia DO CARMO BLANCO2, Christophe ZIMMER2,
Nicklas LINZ3, Alexandra KONIG4, Rachid GUERCHOUCHE5 and Alice GUYON*1 1- Université Côte d’Azur- CNRS UMR 7275- IPMC- Gérard Lambeau’s Laboratory - 660 route des
Lucioles-06560 Valbonne, France
2- Université Côte d’Azur- Cocolab Plateform- Saint Jean d’Angely, 25, Avenue François Mitterrand, 06100 Nice, France
3- ki elements, Am Holzbrunnen 1a , 66121 Saarbrücken, Germany
4- Memory Clinic, CoBTeK (Cognition-Behaviour-Technology) Lab, Universite´ Coˆte d’Azur Institut Claude Pompidou, 10 rue Molière, 06100 Nice, France
5- INRIA Stars Team, Sophia Antipolis, 2004 2004 Route des Lucioles, 06902 Valbonne, France *Correspondence: alice.guyon@ipmc.cnrs.fr
# both authors contributed equally to the work
DOI : 10.18713/JIMIS-021120-9-3
Soumis le Neuf Avril Deux mille vingt – Publié le 2 novembre 2020
Volume: 9 – Année : 2020
Volume title: Methods to assess the effects of sensory stimulations on wellness Éditeurs : Martine Adrian-Scotto, Gabriel Gandolfo, Sandra Perez
Abstract
Rapid relaxation installations in order to reduce stress appear more and more in public or work places. However, the effects of such devices on physiological and psychological parameters have not been scientifically tested yet. This pilot study (N=40) evaluates the variations of vocal speech and facial emotions parameters in 3-minute videos of participant recorded just before and after relaxation, on four different groups, three of them using a different rapid (15 minutes) sensorial immersion relaxation devices and a control group using no device. Vocal speech parameters included sound duration, pause mean duration, sound duration ratio, mean vocal frequency (F0), standard deviation of F0, minimum and maximum of F0, jitter and shimmer. Facial emotion analysis included neutral, happy, sad, surprised, angry, disgusted, scared, contempt, valence and arousal.
The objective of this study is to evaluate different parameters of the automated vocal and facial emotions analysis that could be of use to evaluate the relaxation effect of different devices and to measure their variations in the different experimental groups.
We identified significant parameters that can be of use for evaluating rapid relaxation devices, particularly voice prosody and minimum vocal frequency, and some facial emotion such as happy, sad, the valence and arousal. Those parameters allowed us to discriminate distinct effects of the different devices used: in G1 (control) and G2 (spatialized sounds), we observed a slow-down in voice prosody; in G3 (Be-breathe) a decrease in minimum vocal frequency and an increase of arousal; while in G4 (3D-video) we found an increase in facial emotion valence (happy increasing and sad decreasing). Other parameters tested were not affected by relaxation.
In conclusion, this pilot study allowed us to evaluate different parameters of the automated vocal and facial emotions analysis that could be of use to evaluate the relaxation effect of different devices.
Keywords
Rapid relaxation devices; Acoustic analysis; Facial emotions analysis; Arousal
I INTRODUCTION
In recent years, the number of people diagnosed with chronic stress-related illnesses has increased rapidly in developed societies. Several companies have developed relaxation immersion installations that can be used by businesses or in other public locations (hospitals, transportation, schools, etc.) to meet the increasing demand for relaxation and well-being interventions (Culbert, 2017). In two previous studies, we investigated the effect on physiological and psychological parameters measured 1) before and after (Gomes et al., 2020a, companion paper in the present issue) and 2) during the use (Gomes et al., 2020b, companion paper in the present issue) of three of these devices, which were chosen because they employ different sensorial stimuli and were compatible with the measurements we made.
The first device, Neural Up by iCare-Science, is an apparatus based on spatialized audition of sound frequencies, which are supposed to reduce stress by acting on the nervous system through the auditory pathway. The second device, Be-Breathe by Ino-Sens, consists of a warming armchair that modifies the posture with an audio breathing exercise that prompts the respiratory rate of the user. This device is supposed to decrease stress while mainly improving physiological parameters. The third device is a relaxation room, which shows a 3D-virtual movie about a trip to an island, accompanied by music, where the rhythm complements the image, and was developed by the Cobtek laboratory in Nice, France. This device, using the visual and auditory systems, is supposed to favor a better focus after the relaxation period by reducing anxiety. We compared these three devices using different types of sensorial immersion to a control group doing a 15-minute relaxation with no device.
Psychological stress induces multiple effects on the body including increased muscle tension, breathing rate and changes in salivation rate that may in turn affect vocal production (Pisanski et
al., 2016). Under psychological stress, voice pitch (the acoustic correlate of fundamental frequency,
F0) usually increases as it is inversely related to the rate of vocal fold vibration that stretches under stress and becomes tenser together with an increase in sub-glottal pressure and vocal intensity (Kirchhübel et al., 2011; Hollien 2014). Indeed, an increase in voice pitch is the most commonly reported finding in studies examining speech under stress although stress can also affect other voice parameters such as an increase of the speech prosody (Giddens et al., 2013). Although it has not been tested yet, we assumed that a short period of 15 minutes relaxation might have the opposite effect, thus reducing F0 and decelerating speech prosody.
Psychological stress can also induce negative emotions such as sadness, anger, disgust and fear while relaxation can increase happiness. Different methods have been employed to measure specific aspects of emotions, but facial movements represent a central source of information in the field of emotional expression analysis (Skiendziel et al., 2019). Facial expressions are based on facial muscles activity: when a muscle is contracted, the tissue covering it is pulled towards the muscle’s basis on the bone and forms a wrinkle in the direction of the contraction. If the muscular activity involves the simultaneous stimulation of several muscles, a unique constellation of changes appears on the face that represents a specific facial expression (Bartlett et al., 1999), for instance, raised eyebrows, wide-open eyes, and gaping mouth of surprise are a good representation of this muscle activity. If a systematic relationship exists between distinct emotions and activation patterns of
specific facial muscles as postulated by Ekman (Ekman, 1993), that specific pattern of muscle activations in the face can be seen as a criterion for the activation of an emotion (Donato et al., 1999). As these emotions feature distinctive facial expressions, based on specific patterns of muscle activations, an objective assessment of these emotions by manual and automated coding is possible. The automated facial coding software Noldus FaceReader soon became an alternative to traditional manual coding, as it scores correctly between 91% and 100% of the time, depending on which emotion is measured, while comparing with the facial expressions scored manually by the professional annotators. FaceReader analysis allows the detection of the basic expression of emotion on the face. Seven emotions (happiness, sadness, anger, disgust, fear, surprise and contempt) can be detected. When the participant shows no emotion, the software considers him as being in a neutral state. The software is also calculating the valence (which indicates whether the person's emotional state is positive or negative) and the arousal level of the person.
The aim of the present study was to investigate the possibility of using speech processing markers and emotional states automatically extracted from 3-minute videos recorded right before and after the 15-minute period of relaxation, to contribute to the evaluation of the relaxation effect of the three devices compared to the control group. We assumed that after relaxation we could observe a decrease in F0, a slow-down of the prosody measured by an increase in mean pause duration and a decrease in sound duration, and a global change of facial emotions with an increase in valence (an increase in positive emotions and/or decrease of negative emotions). As the different devices tested are targeting different sensorial systems, we hypothesized that the impact of each device on the different parameters tested could vary between groups and give information on the relaxation process involved.
II MATERIALS AND METHODS 2.1 Groups of participants
The experiment was conducted with 40 healthy volunteers. The participants were aged between 24 and 68 years old, with an average of 42.7 ± 11.5 years old, including 28 women and 12 men. They were distributed in four groups (10 participants per group) using pseudo-randomization in order to acquire comparable groups in terms of age and sex. Briefly, male participants were listed by increasing ages and randomization was made within subgroups of four men of the nearest age to allocate them to each group (G1-G4). The same protocol was applied to women. There were seven women and three men in each group. All participants reported that there they were not dependent on drugs or alcohol, except four participants smoking occasionally (one in each group). Participants were not taking any medication except three participants who were taking medicine for hyper or hypothyroidism (which were stabilized). The majority of participants were from Université Côte d’Azur or French research centers (students, teachers, employees, etc.). Both French and English speakers took part in the experiment, and participants could select either English or French. The whole protocol, including the measurement of the parameters, lasted 1 hour and the relaxation phase lasted 15 minutes. The experiments were performed at room temperature (20-23°C) between 10 a.m. and 6 p.m. on four consecutive weeks in April-May 2019.
2.2 Relaxation devices
We named the groups as follows: G1 for the control group; G2, Neural Up device; G3, Be-breathe chair; and G4, Cobtek “Relax Room” (see Gomes et al., 2020a).
G1 was the control group: the participants remained seated in an armchair with their eyes closed. They were equipped with noise-cancelling headphones and asked to breathe calmly throughout the 15-minute session.
G2 tested the Neural Up device: This solution was developed by iCare Sciences, and is composed of a patented acoustic technology based on relaxing sound frequencies (Tibetan sounds) that alternate between right and left ears, giving a sensation of spatialized sound around the body. The participants remained seated in an armchair with their eyes closed and were equipped with noise-cancelling headphones. After 2.5-minute rest, the headphones delivered the Neural Up sound for 10 minutes, followed by 2.5-minutes additional rest.
G3 tested the Ino-Sens Be-Breathe device: This features a warming armchair with a back massage and swing, which is synchronized with the respiratory rhythm and communicates audio-respiratory instructions to the participant to inhale for 5 seconds and exhale for 5 seconds. The participants were installed in the Be-Breathe chair, instructed to breathe with their abdomen and were equipped with noise-cancelling headphones and a sleeping mask that covered their eyes. The Be-Breathe chair was configured for a complex 15-minute sequence including: a 1-minute rest, a 1-minute of listening to audio instructions while the chair reached horizontal position; 9 minutes of breathing movements driven by the armchair while the participant received a back massage and a swing in sync with the respiration rate in the last 7 minutes in rhythm with respiration; then the participant got 3 minutes of rest in an inclined position and finally came back to the seated position to rest for 1 minute.
G4 tested the Cobtek laboratory “Relax Room”: A relaxation cabin was employed to present a 3D-movie, first containing virtual images of a realistic universe and then holding images of a fantasy world on an island, with animals (butterflies, turtles) followed by a virtual immersion in the water. The movie also presented sounds that began with a fast tempo and slowed down during the island travelling phase, and that came back to the initial rhythm in the end. The participants remained seated in a chair, equipped with 3D vision glasses, in front of a large screen. After a 3-minute rest, the 3-D movie was presented for a duration of 9 minutes followed by another 3-minute rest.
2.3 Protocol
We developed a protocol in order to test and compare the effect of the different devices. All procedures contributing to this work comply with the ethical standards of the relevant national and institutional committees on human experimentation and with the Helsinki Declaration of 1975, as revised in 2008. The Université Côte d’Azur ethics committee for non-interventional research (CERNI, Comité d’Ethique pour les Recherches Non Interventionnelles) approved this protocol. The order of the different measurements for each participant was determined in this protocol (Gomes et al., 2020a). All experiments were video-recorded.
2.4 Vocal analysis
For each participant, we recorded two videos of 3 minutes before and after the relaxation session to assess the effects of the device on their voice, speech rate and facial emotions. In the first 3-minute video, they were asked: “Tell me about a good experience that you had recently”, “Tell me about a bad experience that you had recently” and “Why did you decide to participate in this experiment?”. For the second 3-minute video, they were asked: “How do you feel now?”, “Choose 3 words to describe your experience.” and “What were the positive and negative aspects of your experience?”. Audio files were extracted from the videos using FFMPEG at a sampling rate of 44 kHz and 16-bit amplitude quantization and stored onto a computer as WAV files to keep maximum quality. After converting the original WAV files in MP3 format, which was easier to use with Praat 6.1.09 software, (Boersma and Weenink, 2001; de Jong and Wempe 2009), we extracted multiple features by automatic sound analysis of the 3 minutes videos pre and post relaxation. Statistics relating to lengths of silence and sounding segments were determined based on intensity, calculated from the bandpass filtered sound signal. Three temporal parameters, describing measures of speech
proportions were extracted: total sound duration, mean pause duration and sound duration ratio. We also determined the fundamental mean vocal frequency (F0) for each sequence, the standard deviation of F0, the minimum and maximum of F0 (Pisanski et al., 2016). Finally, we also determined the percentage of jitter and shimmer, which are measures of the cycle-to-cycle variations of fundamental frequency and amplitude, respectively, and which have been largely used for the description of voice quality (Brockmann et al., 2008).
2.5 Facial emotion analysis
Videos were checked one by one and cropped using FFMPEG to keep only the face of the participants. In the same way as for sound, the FFMPEG code file was changed into .bat to execute the code for all the videos. Emotions revealed by facial expression were measured with the FaceReader technique (version 8; Noldus Information Technology, Wageningen, The Netherlands). The software measures the probability of the participant to be in different emotional states based on his/her facial expression at each time frame and gives the proportion of time spent in each determined emotional state determined for the total 3 minutes. It scales the 8 basic emotion patterns (neutral, happy, sad, angry, surprised, scared, disgusted, and contempt) from 0 to 1 (maximum intensity of the fitted model). In addition, it also analyses the valence, which indicates whether the person's emotional state is positive or negative. ‘Happy' is the only positive emotion, while ‘Sad', ‘Angry', ‘Scared', and ‘Disgusted' are considered to be negative emotions. ‘Surprised' can be either positive or negative. The valence was calculated as the intensity of ‘happy’ minus the intensity of the negative emotion with the highest intensity, indicating whether the emotional state of the subject was rather positive or negative. Valence scores ranged from -1 to 1. Finally, the software gives the probability of arousal from 0 to 1. This study was performed in the CocoLab (MSHS Sud-Est - Université Côte d’Azur).
2.6 Statistics
For the statistical analysis, we used Sigmaplot-10.0, GraphPad Prism-6 and InvivoStat-3.7.0.0 software. We first evaluated the effects of the relaxation protocols on the different parameters measured using a repeated measures 2-way ANOVA (time x 4 groups). We then compared the values from before and after the relaxation period for each group using paired t-tests. P values inferior to 0.05 were considered to be significant. We measured effect sizes using Hedges’g formula adapted for small samples, as effect sizes are not affected by sample size. The effect was considered as small for g < 0.2, and large for g > 0.6 (Cohen, 1994; Schmidt and Hunter, 1997).
III RESULTS 3.1 Speech analysis
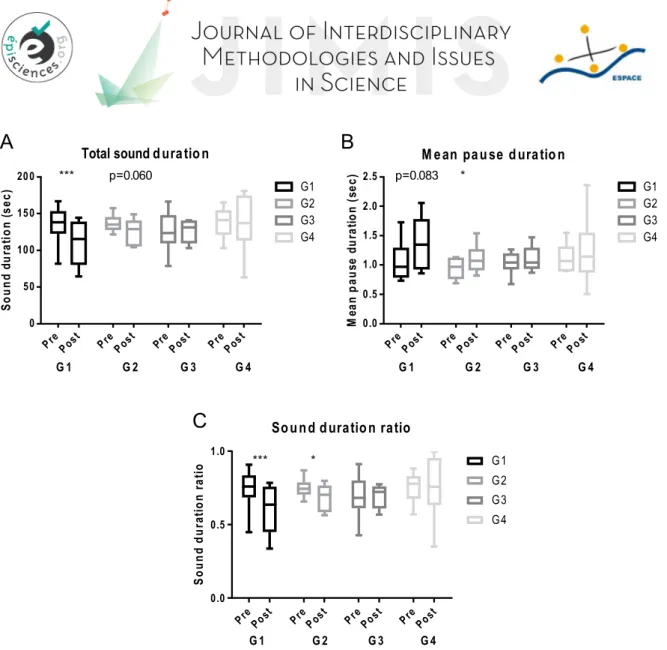
As illustrated in Figure 1A, a decrease in sound duration was observed in G1 (control) and to a lesser extent G2 (Neural Up). As shown in Table 1, it was significant in G1 with an effect size of -0.690 and close to significance in G2 (p=0.060) with an effect size of -0.580. This was concomitant to an increase in mean pause duration (Figure 1B), that was significant in G2 with an effect size of 0.632 and close to significance in G1 with an effect side of 0.625.
Overall, this leads to a significant decrease in sound duration ratio in G1 and G2 with effect sizes of respectively -0.691 and -0.584, suggesting that in these two groups, the speech was slowed after relaxation. By contrast, we observed no difference in this parameter in G3 and G4.
Figure 1: Analysis of vocal sounds recorded during the videos recorded before (Pre) and after (Post) the relaxation period. Box and whiskers plots showing the median of the different sound parameters measured surrounded by the 25-75% quartiles and the minimum-maximum (bars). A- Total sound duration. B- Mean pause duration C- Sound duration ratio. We performed two-way ANOVA with repeated measures for time and group. We found an effect of time and an interaction but no effect of group. P values obtained from the post-hoc paired t tests are indicated on top of the bars. *p<0.05, ***p<0.001. P values close to significance are also indicated.
Surprisingly, we observed no significant difference in the mean vocal frequency (F0) or SD of F0 between pre- and post- relaxation (Figure 2A-B). We only observed a decrease in the minimum F0 after relaxation that was significant in G3 (Figure 2C), with an effect size of -0.661. No effect of relaxation was observed on the maximum of F0 (Figure 2D).
G 1 G 2 G 3 G 4 S o u n d du ra ti o n (s ec ) PrePost PrePost PrePost PrePost 0 50 100 150 200 G1 G2 G3 G4 *** p=0.060
M ean pau se d uratio n
G 1 G 2 G 3 G 4 M ea n p au se du ra tio n (s ec ) PrePost PrePost PrePost PrePost 0.0 0.5 1.0 1.5 2.0 2.5 G1 G2 G3 G4
Total sound d uratio n
* p=0.083
*** *
A
B
C
Sound d uratio n ratioG 1 G 2 G 3 G 4 S o u n d d u ra ti o n ra ti o PrePost PrePost PrePost PrePost 0.0 0.5 1.0 G1 G2 G3 G4
Figure 2: Analysis of vocal sound frequencies recorded during the videos recorded before (Pre) and after (Post) the relaxation period. Box and whiskers plots showing the median of the different sound parameters measured surrounded by the 25-75% quartiles and the minimum-maximum. A- Mean frequency (F0). B- Standard deviation of F0. C- Minimum of F0. D- Maximum of F0. The two-way ANOVA with repeated measures for time and group was not significant except for C (Min F0) for which we found an effect of time but no effect of group and no interaction. Significant p values obtained from the post-hoc paired t tests are indicated on top of the bars. *p<0.05.
We also investigated the possibility of an effect of relaxation on jitter and shimmer. We observed no significant effect of relaxation on these parameters (Figure 3).
F req uen cy G 1 G 2 G 3 G 4 Fr eq ue n cy (H z) PrePost PrePost PrePost PrePost 0 100 200 300 G1 G2 G3 G4
A
B
C
D
SD F 0 G 1 G 2 G 3 G 4 S D F 0 (H z) PrePost PrePost PrePost PrePost 0 20 40 60 80 100 G1 G2 G3 G4 M a x F 0 G 1 G 2 G 3 G 4 M ax F 0 (H z) PrePost PrePost PrePost PrePost 300 350 400 450 500 550 G1 G2 G3 G4 M in F 0 G 1 G 2 G 3 G 4 M in F 0 (H z) PrePost PrePost PrePost PrePost 50 60 70 80 90 G1 G2 G3 G4 * Sh im m er G 1 G 2 G 3 G 4 S hi m m er (% ) PrePost PrePost PrePost PrePost 300 350 400 450 500 550 G1 G2 G3 G4 Jitter G 1 G 2 G 3 G 4 Ji tt er (% ) PrePost PrePost PrePost PrePost 0 1 2 3 4 5 G1 G2 G3 G4A
B
Figure 3: Analysis of vocal sound jitter and shimmer recorded during the videos recorded before (Pre) and after (Post) the relaxation period. Box and whiskers plots showing the median of the different sound parameters measured surrounded by the 25-75% quartiles and the minimum-maximum. A- Jitter. B- Shimmer. The two-way ANOVA with repeated measures for time and group was not significant.
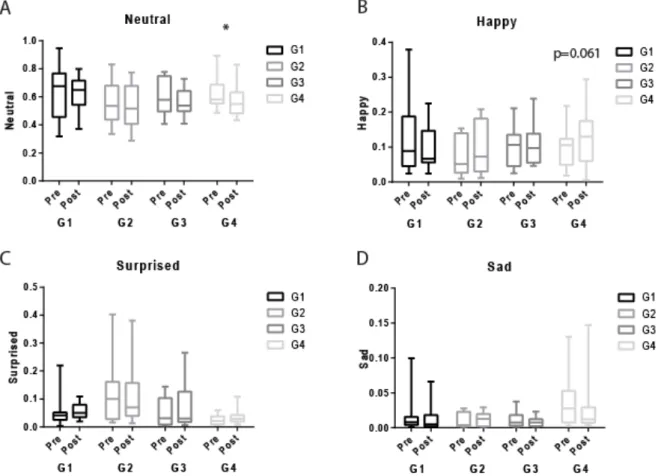
3.2 Facial emotion analysis
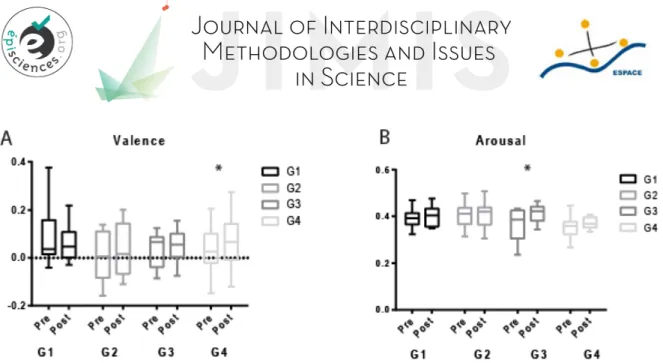
Figure 4 shows the results obtained for the most frequent facial emotions detected by FaceReader in the participants (in order: neutral, happy, surprised and sad). The graphs presenting the least detected facial emotions (angry, discussed, scared, contempt) are depicted in Figure 5. The proportion of their occurrence was very low compared to the previous ones, and no difference was observed between pre and post relaxation regarding those facial expressions. Figure 6 presents the data obtained regarding the valence and the arousal.
Opposite to what we observed on vocal speech where the main effect was observed on G1 and G2, no effects were observed on these groups regarding facial emotion expressions (see Table 1). However, as illustrated in Figure 4A, we observed a significant decrease in the Neutral state in G4 (group experiencing the “Relax room”), that was concomitant with an increase in the happy state (Figure 4B) almost reaching significance (p=0.061) with an effect size of 0.294 (Table 1) and a small decrease in the sad emotional state (effect size: -0.170). Overall, this leads to a significant increase of the valence in this group with an effect size of 0.267 (Figure 6A, Table 1). No significant effect was observed in G3 (experiencing the Be-Breathe chair).
Figure 4: The four emotions that were found the most frequent by Face-Reader during the 3-minute videos recorded before (Pre) and after (post) the relaxation period. A- Neutral, B- Happy, C- Surprised, D- Sad. Box and whiskers plots show the median of the portion of time spent in the different emotional states surrounded
by the 25-75% quartiles and the minimum-maximum (bars) for each group. Two-way ANOVA with repeated measures for time and group revealed a time effect for A and D with no effect of group, an interaction for B (but no time or group effect), and was not significant for C. Paired t test: *p<0.05, p values close to significance are indicated.
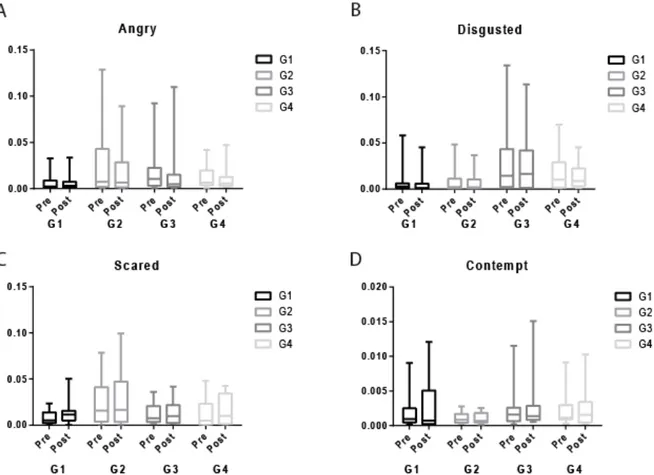
As illustrated in Figure 5, we observed no differences between groups and no effect of the relaxation on angry, disgusted, scared and contempt emotions.
Figure 5: The four emotions that were the least expressed during the 3-minute videos recorded before (Pre) and after (post) the relaxation period. Box and whiskers plots show the median of the portion of time spent in the different emotional states surrounded by the 25-75% quartiles and the minimum-maximum (bars) for each group. A-Angry B- Disgusted C- Scared D- Contempt- A-D: Two-way ANOVA with repeated measures for time and group were not significant.
Interestingly, as illustrated in Figure 6, we observed a significant increase in arousal in G3, the group experiencing the Be-Breathe chair, with an effect size of 0.622 (Table 1). A slight increase in arousal was also observed in G4 (effect size of 0.371), although it did not reach significance.
Figure 6: Valence (A) and arousal (B) measured during the 3-minute videos recorded before (Pre) and after (post) the relaxation period. Box and whiskers plots show the median of the portion of time spent in the different emotional states surrounded by the 25-75% quartiles and the minimum-maximum (bars) for each group. The two-way ANOVA with repeated measures for time and group were not significant but there was an interaction.
Parameter type Parameters Group G1 (Control) G2 (Neural Up) G3 (Be-Breathe) G4 (Relax room) Speech parameters Sound Duration
(sec) Post Pre
Effect size P value 135.10 ± 23.91 110.12 ± 29.71 -0.690 *** 136.25 ± 10.45 125.66 ± 16.90 -0.580 0.060 126.42 ± 24.80 127.89 ± 12.91 -0.059 137.51 ± 20.17 136.99 ± 36.21 -0.014 Mean pause
duration (sec) Post Pre
Effect size P value 1.06 ± 0.31 1.37 ± 0.44 0.625 0.083 0.94 ± 0.16 1.11 ± 0.24 0.632 * 1.03 ± 0.18 1.10 ± 0.19 0.321 1.11 ± 0.23 1.22 ± 052 0.217 Sound duration ratio Pre Post Effect size P value 0.74 ± 0.13 0.60 ± 0.16 -0.691 *** 0.74 ± 0.06 0.68 ± 0.09 -0.584 * 0.70 ± 0.14 0.69 ± 0.08 -0.0148 0.75 ± 0.10 0.75 ± 0.20 0.021 F0 (Hz) Pre Post Effect size P value 163.70 ± 35.17 168.83 ± 34.08 0.122 156.71 ± 33.63 155.56 ± 35.16 -0.028 175.99 ± 40.08 169.96 ±43.61 -0.119 174.20 ±42.5 178.89 ± 46.26 0.087 SD F0 (Hz) Pre Post Effect size P value 39.30 ± 10.56 43.10± 10.59 0.292 37.26 ± 11.40 35.81 ± 8.57 -0.119 54.38 ± 22.43 47.95 ± 12.64 -0.287 39.68 ± 13.12 42.68 ± 16.87 0.164 Min F0 (Hz) Pre Post Effect size P value 70.75 ± 3.80 68.72± 6.17 -0.322 68.86 ± 3.49 69.77± 4.14 0.195 74.56 ± 4.79 70.71± 3.90 -0.661 * 70.41 ± 3.65 69.47± 2.96 -0.234 Max F0 (Hz) Pre Post Effect size P value 458.61 ± 60.11 486.68± 21.96 0.489 490.63 ± 11.42 483.28 ± 18.02 -0.392 495.56 ± 23.84 503.72± 15.9 0.330 466.37 ± 37.89 448.20 ± 63.33 -0.284 Facial emotions Neutral Pre Post Effect size P value 0.64 ±0.19 0.62 ± 0.14 -0.099 0.55 ± 0.16 0.53 ± 0.17 -0.14 0.61 ± 0.14 0.56 ± 0.10 -0.319 0.63 ± 0.14 0.57 ± 0.12 -0.354 * Happy Pre Post Effect size P value 0.12 ± 0.11 0.09 ± 0.06 -0.298 0.07 ± 0.06 0.09 ± 0.08 0.245 0.10 ± 0.06 0.10 ± 0.06 0.091 0.10 ± 0.06 0.12 ± 0.08 0.294 P=0.061 Surprised Pre Post Effect size P value 0.05 ± 0.06 0.06 ± 0.02 0.084 0.12 ± 0.12 0.12 ± 0.12 0.057 0.05 ± 0.05 0.07 ± 0.09 0.185 0.03 ± 0.01 0.04 ± 0.03 0.376 Sad Pre Post Effect size P value 0.017 ± 0.029 0.014 ± .022 -0.1057 0.011 ± 0.011 0.012 ± 0.010 0.093 0.012 ± 0.012 0.008 ± .0007 -0.275 0.037 ± 0.037 0.029 ± 0.044 -0.170 Valence Pre Post Effect size P value 0.09 ± 0.12 0.06 ± 0.07 -0.268 0.01 ± 0.10 0.04 ± 0.11 0.203 0.04 ± 0.07 0.05 ± 0.07 0.139 0.03 ± 0.10 0.07 ± 0.11 0.267 * Arousal Pre Post Effect size P value 0.39 ± 0.04 0.40 ± 0.04 0.205 0.40 ± 0.05 0.40 ± 0.05 0.065 0.37 ± 0.07 0.41 ± 0.038 0.622 * 0.35 ± 0..04 0.37 ± 0.02 0.371
Table 1: Changes in parameters for each group between pre and post-relaxation. Mean values ± standard deviation Pre and Post relaxation are indicated for each group as well as Hedges’g effect sizes (in blue, large effect sizes (absolute value > 0.6) are indicated in bold) and p values of paired t test (in red). * p<0.05, *** p<0.001, paired t-test. P values close to significance are indicated. N=10 per group. Table cells that appeared to us relevant based on the effect size and the statistics are highlighted in grey.
IV CONCLUSION AND REFERENCES 4.1 Discussion
Our study investigated the possibility of using speech processing markers and emotional states automatically extracted from 3-minute videos to contribute to the evaluation of the relaxation effect of a device.
Regarding audio analysis, we found that speech was slowed after relaxation in G1 (control group) and G2 (Neural Up), with a decrease in sound duration, an increase in mean pause duration leading to a significant decrease in sound duration ratio (Figure 1), while we observed no difference of these parameters in G3 and G4. Interestingly, in Gomes et al., 2020 a-b, we have already shown that participants of G1 and G2 benefited from the relaxation: for instance, they showed a decrease in anxiety, nervous and muscular relaxation. It is interesting to note that G1, the control group using no device, showed some relaxation effects, showing that even without a device, a 15-minute rest might be enough to relax. The slowing of the speech observed here could be due to a state of drowsiness of the participants of these two groups after relaxation (Mahato, Regmi et al., 2018). Those two groups were very similar in the relaxing effects observed, since the only difference between them was the additional use of spatialized sound in G2 compared to G1, and indeed, using random forest-based model to identify participants using or not relaxation devices, we could not discriminate between G1 and G2 (Gomes et al. 2020a). This is in accordance with the similar results obtained in those two groups regarding the voice analysis.
Surprisingly, we observed no significant difference in the mean vocal frequency (F0) or its standard deviation between pre and post relaxation in any group (Figure 2A). An increase in voice pitch is the longest and most commonly reported finding in previous studies examining speech under stress (reviewed in Kirchhübel et al., 2011, Giddens et al., 2013). However, many studies have failed to replicate this finding (Streeter et al., 1983, Tolkmitt and Scherer, 1986, Johannes et al., 2000, Dietrich and Verdolini Abbott, 2012). It is likely that the level of stress of our participants before the relaxation might have been too low to observe a difference in F0 between pre-post relaxation. The only significant difference that we found regarding the vocal frequency was a decrease in the minimum of F0 in G3 (Figure 2C). It is interesting to note that G3 participants also showed a decrease in mean blood pressure and an increase in SPO2, and a self-reported muscle and nervous
relaxation (Gomes et al. 2020a). Interestingly, the facial emotion analysis also revealed a concomitant increase in arousal facial expression in G3 after relaxation.
Opposite to what we observed on vocal speech, no effects were observed on G1 and G2 regarding facial emotions (Figure 2) while we observed a significant increase in the valence in G4 (experiencing the 3D video). The 3D video experience thus apparently increased the positive emotions of the participants, while no significant effect on positive emotions was observed in G3 (experiencing the Be-Breathe chair).
Overall, some parameters of the speech analysis (those relative to the prosody and the minimum of F0) and of the facial emotion analysis (neutral, happy, sad, valence, arousal) brought information on the relaxing effect of the different devices and appeared to be interesting tools to evaluate relaxation devices. Others were not useful to evaluate rapid relaxation devices (like for the vocal analysis: F0, SD(F0), Max (F0), jitter and shimmer and for the facial emotion analysis: surprised, angry, disgusted, scared and contempt).
There are some limitations to this study. Given the low sample size and the heterogeneity of the groups in terms of age and gender, the statistical analysis was a concern. The low sample of
participants also prevented a true random allocation. We used repeated measures two-way ANOVA followed by t tests but this approach may induce false negative due to low sample size. The use of effect size, which is supposed to be unaffected by sample size (Huberty and Morris, 1989), allowed us to obtain an estimation of the variation range of the parameters. This analysis revealed that the relaxation treatments were more efficient at modifying certain parameters in some groups compared to others. Due to the sample of participants used in the study (students and teachers from the University), the generalizability of this study with larger sample size may pose problems for replication with other populations. Maybe also just experiencing one only time these relaxation devices was not sufficient to create an effect and it would need several sessions to have a detectable change in participants.
While recording the 3-minute videos, we used different questions pre and post relaxation, which could induce have induced a bias by modifying the emotional state. However, the study did not reveal changes in facial emotions in the control group. When using the automated facial coding software, we used that automatic mode rather than a prior calibration of the software. This could lower the reliability of face recognition. However, the error in that case would be the same for pre and post videos for each participant. In addition, it has been shown that the performance of the software in both conditions are extremely similar (Skiendziel et al., 2019).
Overall, automated analysis of vocal sounds to determine the prosody and the vocal frequency and automated analysis of facial emotions are both efficient at classifying and quantifying the intensity of basic emotional expressions (Fuentes et al., 2018; Schirmer & Adolphs, 2017; Skiendziel et al., 2019). They can be effective in eliminating the putative bias of a human observer (Schirmer & Adolphs, 2017, Skiendziel et al., 2019). However, next to these technologies, the subjective evaluation of the person receiving the intervention remains an important source of measurement of actual effects.
4.2 Conclusion
In conclusion, this pilot study allowed us to evaluate different parameters of the automated vocal and facial emotions analysis that could be of use to evaluate the relaxation effect of different devices. Further studies should involve larger groups while focusing on the parameters that are the most relevant and investigate the putative correlations between the vocal speech and facial emotion data and the other parameters studied previously.
References
Bartlett M. S., Hager J. C. , Ekman P and Sejnowski T. J. (1999). "Measuring facial expressions by computer image analysis." Psychophysiology 36(2): 253-263.
Boersma P. and Weenink D. J. (2001). "Speak and unspeak with PRAAT." Glot International 5 (9/10): 341-347. Brockmann M., Storck C., Carding P.N., Drinnan M.J. (2008). "Voice loudness and gender effects on jitter and shimmer
in healthy adults." J Speech Lang Hear Res 51(5): 1152-1160.
Cohen J. (1994). "The earth is round (p<0.05)." American Psychologist 49: 997-1003.
Culbert T. (2017). "Perspectives on Technology-Assisted Relaxation Approaches to Support Mind-Body Skills Practice in Children and Teens: Clinical Experience and Commentary." Children (Basel) 4(4).
de Jong N. H., Wempe T. (2009). "Praat script to detect syllable nuclei and measure speech rate automatically." Behav Res Methods 41(2): 385-390.
Dietrich M., Verdolini Abbott K. (2012). "Vocal function in introverts and extraverts during a psychological stress reactivity protocol." J Speech Lang Hear Res 55(3): 973-987.
Donato G., Bartlett M. S., Hager J. C., Ekman P., Sejnowski T. J. (1999). "Classifying Facial Actions." IEEE Trans Pattern Anal Mach Intell 21(10): 974.
Ekman P. (1993). "Facial expression and emotion." Am Psychol 48(4): 384-392.
Fuentes S., Gonzalez Viejo C., Torrico D. D., Dunshea F. R. (2018) Development of a Biosensory Computer Application to Assess Physiological and Emotional Responses from Sensory Panelists. Sensors (Basel). 18(9):2958. doi: 10.3390/s18092958.
Giddens C. L., Barron K. W., Byrd-Craven J., Clark K. F., Winter A.S. (2013). "Vocal indices of stress: a review." J Voice 27(3): 390 e321-399.
Gomes N., Iranfar S., Aridhi S., Guyon A. (2020) Physiological and psychological effects of rapid relaxation devices using sensorial immersion: a pilot study. JIMIS Volume 9 (DOI: 10.18713/JIMIS-021120-9-1).
Gomes N., Iranfar S., Maksymenko K., Aridhi S. and Guyon A. (2020) Physiological effects (heart rate, respiration rate and EEG) of rapid relaxation devices with sensorial immersion: a pilot study JIMIS Volume 9 (DOI: 10.18713/JIMIS-021120-9-2).
Hollien H. (2014). "Vocal fold dynamics for frequency change." J Voice 28(4): 395-405.
Huberty C. J., Morris J. D. (1989). "Multivariate analysis versus multiple univariate analyses." Psychological Bulletin 105: 302-308.
Johannes B., Salnitski V. P., Gunga H. C., Kirsch K. (2000). "Voice stress monitoring in space--possibilities and limits." Aviat Space Environ Med 71(9 Suppl): A58-65.
Kirchhübel C., Howard D. M., Stedmon A.W. (2011). "Acoustic correlates of speech when under stress: Research, methods and future directions." The International Journal of Speech, Language and the Law 18(1): 75-98.
Mahato N. B., Regmi D., Bista M., Sherpa P. (2018). "Acoustic Analysis of Voice in School Teachers." JNMA J Nepal Med Assoc 56(211): 658-661.
Pisanski K., Nowak J., Sorokowski P. (2016). "Individual differences in cortisol stress response predict increases in voice pitch during exam stress." Physiol Behav 163: 234-238.
Schirmer A., Adolphs R. (2017) Emotion perception from face, voice, and touch: comparisons and convergence. Trends Cogn Sci. 21(3): 216–228. doi: 10.1016/j.tics.2017.01.001.
Schmidt F. L., Hunter J. E. (1997). Eight common but false objections to the discontinuation of significance testing in the analysis of research data. L. L. Harlow, S. A. Mulaik & J. H. Steiger (Eds.), What if there were no significance tests? . L. L. E. Associates.: 37-64.
Skiendziel T., Rosch A. G., Schultheiss O. C. (2019). "Assessing the convergent validity between the automated emotion recognition software Noldus FaceReader 7 and Facial Action Coding System Scoring." PLoS One 14(10): e0223905. Streeter L. A., Macdonald N. H., Apple W., Krauss R. M., Galotti K. M. (1983). "Acoustic and perceptual indicators of
emotional stress." J Acoust Soc Am 73(4): 1354-1360.
Tolkmitt J. F., Scherer K. R. (1986). "Effect of experimentally induced stress on vocal parameters." J Exp Psychol Hum Percept Perform 12(3): 302-313.
A Acknowledgements
The authors would like to thank all the volunteers that participated in this study. We thank Christian Müller from Ino-Sens for allowing us to use the Be-Breathe chair, Chris Hayot from Icare Science for allowing us to use the Neural Up software, Nicklas Linz and the company ‘ki-elements’ for the audio analysis and Philippe Robert, Renault David and Auriane Gros for welcoming us in Cobtek and allowing us to use the “Relax Room”. We thank Patricia Bouret, Fabienne Colette, Solène Granjeon-Noriot and Thomas Lorivel for their statistical advice. We thank Abby Cuttriss (from the Office of International Scientific Visibility, Université Côte d'Azur) for English corrections. The authors greatly acknowledge the CocoLab (Complexity and Cognition Lab, MSHS Sud-Est (USR3566), Université Côte d’Azur - CNRS) and its staff.
B Data availability
The data that support the findings of this study are available from the corresponding authors on reasonable request. C Author contribution
N.G. and A.G. performed the acquisition and the data analysis. E. E., R.G., A. K., N d C. B. and C. Z. contributed to the data analysis. A. G. took the lead in writing the manuscript. All authors provided critical feedback and helped shape the analyses interpretation and manuscript. All authors approved the final version of this manuscript.
D Financial support
This work was supported by the French government through the UCA-Jedi project managed by the National Research Agency (ANR-15- IDEX-01) and, in particular, by the interdisciplinary Institute for Modeling in Neuroscience and Cognition (NeuroMod) of the Université Côte d’Azur. Norma Gomes was funded by Neuromod institute of UCA. E Conflict of interest
The authors declare they have no conflict of interest. The devices used in this study were kindly loaned by the companies with their agreement to proceed to the experiments. A research collaboration contract was signed between Sensoria Analytics and the CNRS.