HAL Id: ird-00389609
https://hal.ird.fr/ird-00389609
Submitted on 29 May 2009
HAL is a multi-disciplinary open access archive for the deposit and dissemination of sci-entific research documents, whether they are
pub-L’archive ouverte pluridisciplinaire HAL, est destinée au dépôt et à la diffusion de documents scientifiques de niveau recherche, publiés ou non,
models should be used
Francis Laloë
To cite this version:
Francis Laloë. Why and when ”joint exploitation ecosystem dynamics” models should be used. IIFET.International Institute of Fisheries Economics and Trade 2008 : Achieving a Sustainable Future Managing Aquaculture Fishing Trade and Development, 2008, Nha Trang, Vietnam. 8 p. multigr. �ird-00389609�
WHY – AND WHEN – “JOINT EXPLOITATION-ECOSYSTEM DYNAMICS” MODELS SHOULD BE USED
Francis Laloë, IRD,
Institut de Recherche pour le Développement,
UR Dynamiques socio-environnementales et gouvernance des ressources. francis.laloe@ird.fr
ABSTRACT
Fisheries models are generally built to assess the dynamics of a resource with a given fishing mortality which level can be decided by some “decision maker” and/or which can be an observed process, e.g. times series proportional to some observed values of fishing effort. In these cases, the resource dynamics is represented “conditionally to” fishing mortality. This mortality must be therefore primarily defined in reference to the definition of the resource Such models can be used to make stock assessment from historical data and to find which fishing mortality values could lead to some objective that can be some optimal or acceptable situation. If the values of fishing mortality can be decided by some unique institution, this knowledge of “best or acceptable mortality values” is of great interest for decision support. If not, it becomes insufficient to identify which decision of which institution could lead to obtain some given set of fishing mortalities. This situation may arise if there is a high number of fishing units belonging to various fishing fleets that may decide to generate fishing mortalities distributions among several available possibilities, according to their own interest. Examples of such problems will be presented from a Senegalese case study where several fishing fleets harvest on a common multispecies resource. Some other examples will be given from case studies identified in the context of the program ECOST with the development of a generic model which represents the joint dynamics of fishing activity and resource.
Keywords:
Fleet dynamics, multispecies-multifleet model, decision support FROM TWO TO THREE (AT LEAST) TYPOLOGIES;
Models of resource dynamics conditional to fishing activity.
Models representing the dynamics of a fisheries resource generally consider the dynamics of this resource conditionally to a given impact of fishing activity. Given impact means that it is observed (function of standardized fishing effort computed from survey data) or that it may result from a decision in a governance context allowing such a decision. Such models can therefore be written as
D(Resource) = f (S(fishing activity),...)
Where “D(Resource)” is a descriptor of the state of the resource, function of several arguments, one of them being a synthesis “S” of information on fisheries activity… Elements of this equation are processes. The resource may be described with one (e.g. Schaefer production model) or several components (e.g. ecosystem model such as ecopath or ecosim, Pauly et al. 2000). The synthesis “S” is then defined from this description with a dimension directly determined by the dimension of the resource (e.g. one fishing mortality value per component of the resource).
The use of such models impose to have time series of S(fishing activity) and of D(Resource). These series can be available from surveys and used to fit the model in order to estimate its parameters. They can be obtained through the application of the model (for example to show a trend in D(resource) with some fishing activity process leading to a given S(fishing activity) time series in simulation or optimization studies…).
In such cases, all fishing activity processes leading to the same S(fishing activity) time series are equivalent, which means that the use of the model cannot make difference between them. This has two main consequences. The first one is that there is no imperative need to study the differences between these fishing activity processes. More importantly, the second consequence is that it is assumed that a given activity process leads to a unique synthesis “S(fishing activity)”.
This leads to represent fishing activity as a set of values, that are numbers of fishing actions. If each fishing action generates a given impact on each resource component, the synthesis “S(fishing activity)” can exactly be computed from the knowledge of the numbers of fishing actions.
Need for two typologies of resource and fishing actions
In this situation, there is a need of two typologies, a typology of the resource and a typology of the fishing actions. Each typology can be explicitly defined with equivalence relationships for example as follows (Pech et al., 2001):
• the resource is made up of stocks: two elements of the resource (i.e. two biomass units) are equivalent (i.e. belong to the same stock) if they have equal probabilities of being caught and if they exhibit the same productivity;
• fishing actions are described using the concept of tactics: two fishing actions belong to a same tactic if they have, at each given moment, equal probabilities to catch any given part of the resource;
As said above, the model can be used with data from surveys in order to estimate its parameters. These data can be (i) the catches per unit of effort (here catch per fishing action of a given tactic) that are descriptors of the resource components and (ii) the numbers of fishing actions per tactic. Here the assumption of uniqueness of S(fishing activity) is not an absolute need, because the activity has been done and therefore has led to some impact. The problem may simply be that if a given fishing activity can generate different impacts, data on this fishing activity becomes not sufficient to compute the impact and more information will be needed…
The model can then be used for simulation or optimization studies, with addressed questions on the evolution of D(Resource) for some given future process of S(fishing activity). Here uniqueness of S(fishing activity) is assumed by definition. This assumption is straightforward if we consider that the governance context make it possible to fix S(fishing activity). But there is some paradox here because the assumption is not a result of an analysis of the governance context; it results from the choice of a description of the resource… This means that if we adopt a new descriptor of the resource, we change the definition of the description of the fishery, which is a normal thing; but we also change the definition of the set of “possible management decisions”. This could justify further attention…
If for a given fishing activity S(fishing activity) is not unique, the situation becomes more complex and the way the fishing activity results in an impact can also be represented by the model.
Need for third typology of fishing units
The scheme presented in figure 1 represents such a situation where a resource made of 3 components is exploited by three different fleets. The exploitation is represented at two different times. The 2 fishing units of the first fleet always harvest on the same stock. This means that they always do fishing actions of the same type (according the definition of tactic given above). The 3 units of the second fleet have the same behavior. The 13 units of the third fleet have a short operating range and cannot always harvest on the same stock. They must at each given time harvest on a stock accessible at that time. This means that the fishing activity of these fishing units results in variable impact depending on tactical choices of fishermen. These fishing units correspond to “Single multitarget fishery” (Gulland and Garcia, 1984)
Figure 1 (redrawn from Laloë 2006)
Fisheries exploitation harvesting on three stocks with three fishing fleets at times t1 and t2. Two fleets gather fishing units (2 and 3 ) always harvesting on the same stock,
the units of the third fleet (13 with short operating range within the half “circle”) must harvest at each time on one accessible stock.
Such a context may have some indirect perverse consequences. The first one is that observations made on activity and yields of the two first fleets are much more useful for stock assessment because trends in their “CPUE” can be considered as acceptable descriptors of the trends in abundance of exploited stocks. The analysis of trends in CPUE of units of the third fleet is much more complex.
In such a situation, if the main addressed question concerns the dynamics of the resource, data collection effort must mainly be made on the two first fleets. If so, as each “observed” fishing units always do fishing actions of the same type, it is possible to make a confusion between fishing units and fishing actions. But this confusion is potentially dangerous because fishing actions and fishing units are not units of the same nature and for example this confusion cannot be done with fishing units of the third fleet presented in figure 1. There is hence a need for a typology of fishing units. As for the two first typologies of the resource and the fishing actions the definition can be based on an equivalence relationship, for example (Pech et al., 2001):
• fishing units are described using the concept of strategies: two fishing units belong to a same strategy if they have, at given moment, equal probabilities of using a fishing action belonging to a given tactic.
In other word, the transition from two to three can be considered in reference to the elementary fisheries event which is generally seen as:
A quantity Q of fish has been caught during a fishing action A And which can be now completed as:
A quantity “Q” of fish has been caught during a fishing action “A”… undertaken by a fisherman (fishing unit) “P”
From the typologies of resource, fishing actions and fishing units and from the elementary fisheries event, it appears natural to represent how the decisions of the units of fishing, according to their strategies will be concretized in numbers of fishing actions from which the impacts on various stocks constituting the resource will be characterized.
When doing so we consider a joint dynamics of resource and exploitation where the value “S(fishing activity)” is no more given, but results from a model of fishermen decisions. The basic principle of the model is quite simple: a fishing unit has several fishing (or no fishing) actions available and choose at each given time each of them with some probability. Models of qualitative choice behavior (e.g. Random Utility Models) are well adapted to provide such probabilities (see Mac Fadden, 1973, Holland and Sutinen, 1999).
Articulation between typologies; Diagram of Pech
In order to combine such models with usual models of resource dynamics, it is necessary to consider basic articulation between the three typologies. This can be done from the lists of the component of the resource that can be caught by each type of fishing action and from the list of fishing actions that are available for each type of fishing units. This can be schematically presented on a diagram of Pech as shown on figure 2.
"Tactic-stratum" combinations: a bullet indicates that the tactic belongs to the
sampling stratum
"Tactic-stock" Combinations: a bullet indicates
that the stock
is cathable using this tactic
"Tactic-stock" Combinations: a bullet indicates that
a fishing unit having this strategy May choose this tactic
This diagram provides information on one of the nine case studies in the UE program ECOST http://www.ecostproject.org . It is made of 3 panels,
• The bottom panel provides the link between fishing units types (fleets or strategies) and fishing action types (métiers or tactics) for example fishing units of type “inshore_MPA_allowed” (these small scale units may fish inside an MPA) may adopt at each time one of the fishing tactics “Push-net_inshore”, “trawl-nets_inshore”; they may also decide to do something else (tactic “N3”), the units of each fleet may choose a no fishing tactic which can be associated to an opportunity cost specific of the fleet. Since number of actions depend on the probabilities of choices, there is no more uniqueness of the impact of fishing activity of the fishing units.
• The middle panel provides the link between stocks and tactics. For example, tactic “Push-net_inshore” generates catches on shrimps, crabs, trash-fish, demersal fish and top predator. Note that “No fishing ” tactic lead to no catch at all.
• The top panel provides information on the strata of sampling survey (strata correspond to the classes of a fourth typology) from which data are available. In figure 2 this panel indicates that each tactic corresponds to one sampling stratum. This means that we should have for each tactic times series of CPUE for each catchable stock and a time series of number of fishing actions using the tactic (i.e.stratum size). In some cases a stratum may groups several tactics. This may be the case if the criteria used to affect a fishing action to a sampling stratum do not match exactly the definition of tactics. For example, in a study on Senegalese small scale fishery, a stratum is defined as “hand lines from the port of Kayar”, this stratum groups several tactics according the fishing grounds selected by the fishermen… (Pech et al 2001).
Such a diagram provides the basic information needed to build a joint exploitation-resource dynamics model articulating a model of the resource and a model of the exploitation:
• The model of the resource can be a set of derivatives of the resource components (each exploited component corresponds to a row of the diagram). In this model, the impact of the fisheries exploitation during a time step will be a function of S(fishing activity) the numbers of actions with each tactic during this time step. The model can be here some multispecies dynamics biomass model, taking or not into account predator prey relationships. It can also be a more comprehensive ecosystem model, ecosim for example
• The number of fishing actions with one tactic is the sum over the fleets (strategies) of their sizes multiplied by the probabilities of choosing this tactic. These probabilities can typically be obtained with Random Utility Models.
This articulation of two models is the center of the joint exploitation-resource dynamic model. Other components can be added, for example taking into account the trends in fishing powers, fleet sizes, etc. A quite complete application can be found in Pech et al 2001, with a fitting procedure using time series data from a stratified sampling design. The fitted model may be then used for decision support analysis with multicriteria objectives and multidimensional control variables (e.g. Laloë 2007).
ECOST Project case studies
Nine case studies are identified in ECOST Project ( http://www.ecostproject.org ). A general model is in construction for the project, in order to provide a tool for estimation of societal costs resulting from fisheries activity (Pan, Tokrisna, this issue). A diagram of Pech should be built for each case study. The diagram presented on figure 2 represents the Vietnamese case study. At this time it must be considered as a draft, resulting from discussion with Dr. Le Xuan Sinh of Can Tho University (however I am fully
responsible of any misinterpretation). At this stage, the diagram can be considered as a useful tool for a better collective understanding of a fisheries exploitation.
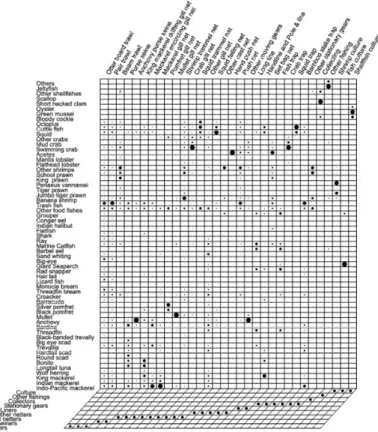
A second example can be presented, from discussions with Prof. Tokrisna of Faculty of Economics of Kasetsart University in Bangkok. A first attempt is presented in figure 3, including all species and fishing gears identified for data collection. Note that there is no top panel with reference to a sampling system; data are a summary of yearly catches per gear and species.
The central panel gives for each gear an indication of catches. Here the circles are of variable size, with for each gear a surface proportional to the catch percent of catch made on the corresponding species. The bottom panel is not achieved and must be seen at this stage as a tool for discussion. On figure 3 we consider for example that a fishing unit can operate all fishing actions involving the use of the same kind of gear (e.g. the trawler fishing unit can operate the three types of action : Otter-board trawl, Pair trawl, Beam trawl; In the same way, purse seiners can operate Purse seine and anchovy purse seine, and so on). This solution is not adequate because most fishing units operate only one gear. Such a situation could be represented with a bottom panel with a number of fleets equal to the number of fishing actions and a diagonal panel (not shown here). The “good” solution lies perhaps between these two extremes
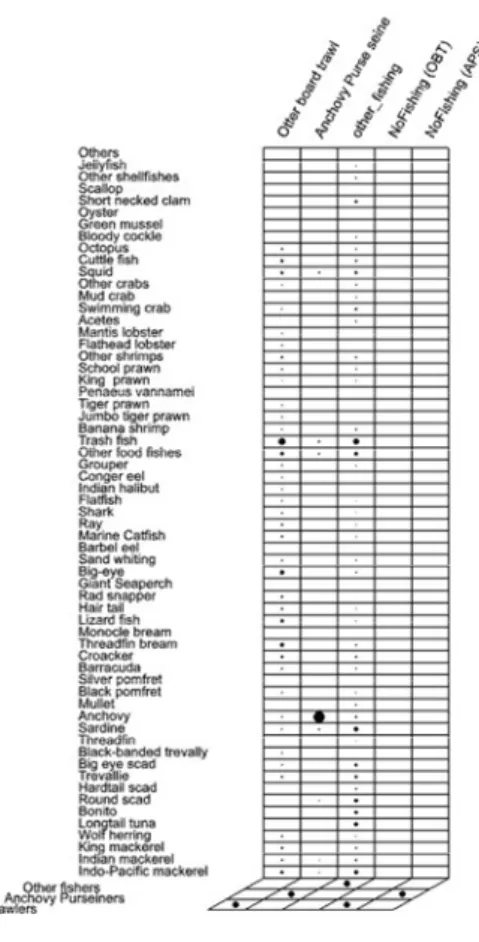
But the construction of the model depends also on the construction of the case studies and the choice made in the ECOST project is to focus on two or three fishing actions types (métiers in the context of ECOST project) selected in function of their importance in terms of environmental, social and economic impacts and in terms of available data. For Thailand case study these selected métiers are “Otter board trawl” and anchovy purse seines. We further assume a quite simple situation where each of these actions corresponds to one fleet. The units of each these two fleets may however choose not to fish. This situation corresponds to the diagram presented in figure 4, where we consider the two métiers. All other catches are confused in a third métier “other fishing”. We therefore consider a third fishing fleet “other fishers” with fishing units having only the third métier available.
Figure 2 second draft (Thailand case study, ECOST Program)
“Addressable” questions
This diagram corresponds to a framework that can be used as a decision support tool to answer some “addressable” questions. Such questions mainly deal with the dynamics of use of the two selected métiers and the consequences of this dynamics on the resource for given levels of activity of other métiers. For the two selected métiers and the two corresponding fleets, it should be possible to consider the consequences on the fishing activity and the socio-economic results of the two fleets of modifications of opportunity costs for the units of these two fleets. It should be also possible to consider the consequences
on the fishing activity and the socio-economic results of the two fleets of given modifications of the impact of the other métiers on the resource.
REFERENCES
Gulland J., S. Garcia, 1984. Observed patterns in multispecies fisheries. In Exploitation of marine communities, R.M. May ed. Dahlem Konferenzen, Springer Verlag, 155-190.
Holland D.S., Sutinen J.G., 1999. An empirical model of fleet dynamics in New England trawl fisheries. Can. J. Fish. Aquat. Sci. 56, 253-264.
Laloë F. 2006 Questions biologiques et jeux complexes de données. Une expérience halieutique p. 65-83. In l’interdisciplinarité dans les sciences de la vie. J.-M. Legay (éd. scient.) Coll. Indisciplines co-édition INRA-Cemagref-Cirad-Ifremer-NSS
Laloë , F., 2007. Information at the interface between supply and demand for indicators: the use of a model with estimated parameter values as a base for indication in multicriteria analyses, Int. J. Sustainable Development, Vol. 10, Nos. 1/2, pp.33±45.
McFadden D., 1973, Conditional logit analysis of qualitative choice behavior. In Zarembka P. (Ed). Frontiers in econometrics, pp. 105-142. Academic Press, New-York.
Pech N., Samba A., Drapeau L., Sabatier R. and Laloë F. 2001. Fitting a model of flexible multifleet-multispecies fisheries to the Senegalese artisanal fishery data. Aquatic Living Resources , 14, 81-98.
Pauly, D., Christensen, V. and Walters, C. 2000. Ecopath, Ecosim, and Ecospace as tools for evaluating ecosystem impact of fisheries. – ICES Journal of Marine Science, 57: 697–706.