HAL Id: hal-01444114
https://hal.archives-ouvertes.fr/hal-01444114
Submitted on 23 Jan 2017HAL is a multi-disciplinary open access archive for the deposit and dissemination of sci-entific research documents, whether they are pub-lished or not. The documents may come from teaching and research institutions in France or abroad, or from public or private research centers.
L’archive ouverte pluridisciplinaire HAL, est destinée au dépôt et à la diffusion de documents scientifiques de niveau recherche, publiés ou non, émanant des établissements d’enseignement et de recherche français ou étrangers, des laboratoires publics ou privés.
Habitat availability and geographic isolation as potential
drivers of population structure in an oceanic dolphin in
the Southwest Indian Ocean
Amélia Viricel, Benoit Simon-Bouhet, Laura Ceyrac, Violaine Dulau-Drouot,
Per Berggren, Omar Amir, Narriman Jiddawi, Philippe Mongin, Jeremy J.
Kiszka
To cite this version:
Amélia Viricel, Benoit Simon-Bouhet, Laura Ceyrac, Violaine Dulau-Drouot, Per Berggren, et al.. Habitat availability and geographic isolation as potential drivers of population structure in an oceanic dolphin in the Southwest Indian Ocean. Marine Biology, Springer Verlag, 2016, 163 (219), �10.1007/s00227-016-2999-3�. �hal-01444114�
Habitat availability and geographic isolation as potential drivers of population
1
structure in an oceanic dolphin in the Southwest Indian Ocean
2
3
Amélia Viricel1, Benoit Simon-Bouhet 1,7, Laura Ceyrac2, Violaine Dulau-Drouot3, Per 4
Berggren4, Omar A. Amir5, Narriman S. Jiddawi6, Philippe Mongin8, Jeremy J. Kiszka1,2,7,9* 5
6
1
LIttoral ENvironnement et Sociétés (LIENSs), UMR 7266 CNRS-Université de la Rochelle. 7
Institut du Littoral et de l‟Environnement, 2 rue Olympe de Gouges, F-17000 La Rochelle, 8
France. 9
2
Institut de Recherche pour le Développement (IRD), UMR 212 EME (Exploited Marine 10
Ecosystems). Centre de Recherche Halieutique Méditerranéenne et Tropicale, BP 171, F-34203, 11
Sète cedex, France. 12
3
Globice Réunion, 30 chemin Parc Cabris, Grand Bois, F-97410 Saint Pierre, La Réunion, 13
France. 14
4
School of Marine Science and Technology, Newcastle University, NE1 7RU, UK 15
5
Ministry of Livestock and Fisheries, P. O. Box 295, Nyangumi House, Maruhubi Street, 16
Zanzibar, Tanzania. 17
6
Institute of Marine Sciences, P.O. Box 668, Zanzibar, Tanzania. 18
7
Centre d‟Etudes Biologiques de Chizé (CEBC), UMR 7372 CNRS-Université de la Rochelle. 19
Institut du Littoral et de l‟Environnement, 2 rue Olympe de Gouges, F-17000 La Rochelle, 20
France 21
8
Brigade Nature Ocean Indien, Parc de la Providence, 97400 Saint-Denis, La Réunion, France 22
9
Current affiliation: Department of Biological Sciences, Florida International University, 3000 23
NE 151st Street, North Miami, FL33181, USA 24
25
26
*corresponding author: Jeremy Kiszka, jeremy.kiszka@gmail.com, Tel: +1 305 919 4104 27 28 29 30 31 32 33 34 35 36 37 38 39 40 41 42 43 44 45 46
ABSTRACT
47
Delphinid populations show highly variable patterns of genetic diversity and population structure. 48
Previous studies indicate that habitat discontinuities and geographic isolation are major drivers of 49
population division in cetaceans. Spinner dolphins (Stenella longirostris) are distributed in all 50
tropical oceans, but they are particularly common around islands and atolls. This species occurs 51
in shallow waters at daytime to rest and socialise, and feeds on offshore mesopelagic prey 52
overnight. Here we investigated the genetic population structure of spinner dolphins in the 53
Southwest (SW) Indian Ocean along a west-east geographical gradient, from eastern Africa to the 54
Mascarene archipelago. We combined analyses of 12 microsatellite loci, mtDNA control region 55
sequences, and sighting data to assess genetic differentiation and characterise habitat preferences 56
of these populations. Significant genetic structure among the three sampled sites (Zanzibar, 57
Mayotte and La Réunion) was observed using both types of molecular markers. Overall, our 58
results indicate that geographic isolation, and potentially other factors such as shallow water 59
habitats to rest and socialise, may be important drivers of the genetic population structure of 60
insular spinner dolphins in this region. 61
62
Keywords: spinner dolphin, Stenella longirostris, genetic structure, microsatellites, mtDNA, East 63 Africa. 64 65 66 67 68 69
71
72
INTRODUCTION
73
74
Understanding factors influencing population connectivity has been a central and long-standing 75
research avenue in marine ecology (e.g. Cowen et al. 2000; 2007; Selkoe et al 2008). Past studies 76
have shown that the genetic structure of marine populations is driven by a number of processes, 77
including water currents, sea floor topography, water temperature and life history (e.g., Fullard et 78
al. 2000; Fontaine et al. 2007; Pelc et al. 2009; Ciannelli et al. 2010; Mendez et al. 2011; 2013). 79
In cetaceans, factors that can lead to discontinuous relationships between genetic and geographic 80
distance include habitat characteristics, intra-species niche partitioning (e.g. foraging 81
specialization) and kinship, combined with demographic processes (e.g., Hoelzel 2009; Möller et 82
al. 2007, 2011, Louis et al. 2014a,b; Viricel and Rosel 2014). 83
84
Beside its fundamental importance in marine ecology, understanding the spatial structure and 85
genetic connectivity of marine populations is also critical for conservation and management 86
purposes. Indeed, while no marine ecosystem is completely unaffected by human activities, 87
threats to populations of marine organisms vary geographically (Halpern et al. 2008). In the 88
Southwest (SW) Indian Ocean for instance, the importance of marine mammal bycatch is 89
spatially variable and it seems to primarily affect inshore species, including coastal delphinids 90
(Kiszka et al 2008). Thus, delimiting biologically meaningful conservation units (i.e., based on 91
population structure assessments) will be a crucial step toward preserving the marine megafauna 92
of this region. 93
The spinner dolphin (Stenella longirostris) is one of the most abundant and widely distributed 95
tropical delphinids (Perrin 2009). Four subspecies are currently recognised, based on 96
morphological and ecological differences (Perrin and Gilpatrick 1994; Perrin et al. 1999). The 97
Gray‟s spinner dolphin (S. longirostris longirostris), hereafter the spinner dolphin, is primarily an 98
insular subspecies, and its distribution includes the Atlantic, Indian and Pacific Oceans (Perrin 99
and Gilpatrick 1994). In French Polynesia, Hawaii and the Maldives, spinner dolphins enter 100
atolls, sheltered bays and lagoons through reef channels in the morning and leave in the afternoon 101
to feed offshore overnight (Würsig et al. 1994; Anderson 2005; Gannier and Petiau 2006), 102
essentially on mesopelagic prey (Perrin et al. 1973; Dolar et al. 2003). Around the lagoon of 103
Mayotte, in the Mozambique Channel (SW Indian Ocean), spinner dolphins primarily inhabit the 104
outer slope of the barrier reef to rest and socialise, and rarely enter the lagoon (Kiszka et al. 105
2010a, 2011). During the past 20 years, extensive work has been conducted on the movements, 106
behaviour, social, and genetic population structure of insular spinner dolphins, particularly in the 107
Pacific Ocean (Norris et al. 1994; Karczmarski et al. 2005; Oremus et al. 2007; Andrews et al. 108
2010). These studies highlight that spinner dolphins may form “fission-fusion” societies, with 109
groups forming and separating over short periods of times, such as around the big island of 110
Hawaii (Karczmarski et al. 2005; Andrews et al. 2010). However, social structure may vary 111
according to habitat characteristics and geographical isolation. Indeed, at the remote Midway 112
atoll (Hawaii), spinner dolphins form stable groups with high level of site fidelity, limited 113
emigration/immigration and strong inter-individual associations (Karczmarski et al. 2005). In this 114
region, gene flow is more restricted among populations showing a fluid social structure (the Kona 115
Coast of the island of Hawaii) than among populations with stable social groups (Midway and 116
Kure Atolls) (Andrews et al. 2010). 117
In the southwestern Indian Ocean, the spinner dolphin is one of the most common small cetacean 119
species in tropical and subtropical waters, particularly around islands and reef complexes off 120
Zanzibar (Amir et al. 2002), Mayotte (Kiszka et al. 2010a, 2011) and the Comoros archipelago 121
(Kiszka et al. 2010c), La Réunion (Dulau-Drouot et al. 2008, Condet and Dulau-Drouot, 2016), 122
Madagascar (Rosenbaum 2003) and Mauritius (Webster et al. 2015). Spinner dolphins 123
(particularly the S. l. longirostris form) are rarely observed in open ocean waters (> 2,000 m), but 124
can occur for short periods of time between islands (particularly in island chains), mostly when 125
undertaking overnight foraging trips (e.g. Kiszka et al. 2011, Mannocci et al. 2013, Thorne et al. 126
2012). As this species occurs in coastal and reef-associated waters, spinner dolphins are impacted 127
by human activities, including past hunting and bycatch off Zanzibar (Stensland et al. 1998, Amir 128
et al. 2012), direct hunting and bycatch in south-western Madagascar (Razafindrakoto et al. 2008) 129
and disturbance from dolphin-watching activities such as on the west coast of Mauritius (Webster 130
et al. 2015). However, the geographical extent of the influence of such direct and indirect effects 131
on populations is unknown. 132
133
This study aims to characterise genetic diversity and population structure of spinner dolphins in 134
the SW Indian Ocean, particularly from Zanzibar (Tanzania), Mayotte (Comoros archipelago) 135
and La Réunion (Mascarene archipelago) (Fig. 1). These islands were selected because they are 136
located along a west-east gradient, from continental waters of Africa (Zanzibar) to the most 137
isolated and remote oceanic islands (La Réunion). We also characterise depth preferences of 138
spinner dolphins at these sites to evaluate their reliance on shallow-water habitat and to estimate 139
habitat size around the two oceanic islands. Resting habitat availability has been suggested to 140
influence population size and dispersal in other island-associated spinner dolphin populations 141
(Andrews et al. 2010). We evaluate the relationship between our estimations of genetic diversity 142
and habitat size: islands with more suitable habitats are expected to sustain greater population 143
sizes, which would maintain greater genetic diversity. Geographic distances separating the coasts 144
of the three sites are greater than 900 km. Considering previous knowledge gathered in the 145
Pacific (Andrews et al. 2006; Oremus et al. 2007; Andrews et al. 2010), we hypothesised that 146
geographic isolation is a major driver of the genetic population structure of spinner dolphins in 147
this region, and that sampled islands should contain genetically distinct populations. 148
149
150
MATERIAL AND METHODS
151
152
Sample collection and DNA extraction 153
In total, tissue samples collected from 69 individual spinner dolphins off Zanzibar (n=21), 154
Mayotte (n=29) and La Réunion (n=19) were available for this study (Fig. 1). For Zanzibar, 155
muscle tissues were collected from bycaught animals in drift gillnets between 2000 and 2004 and 156
were stored frozen at -20°C. Samples from Mayotte and La Réunion were collected during 157
dedicated biopsy surveys undertaken in territorial waters from 2006 to 2011 from small boats. 158
Biopsy attempts were made opportunistically, when groups and individuals were easily 159
approachable and when conditions were optimal (Beaufort < 2, dolphins closely approaching the 160
boat). Optimal weather conditions allowed stability of the research boat and better chances to 161
sample the animals successfully and safely (Kiszka et al. 2010b). Blubber and skin biopsies were 162
collected using a crossbow (BARNETT Veloci-Speed® Class, 68-kg draw weight and 163
BARNETT Panzer V Class, 68-kg draw weight) with Finn Larsen (Ceta-Dart, Copenhagen, 164
Denmark) bolts and tips (dart 20-mm long, 7-mm-diameter). Biopsy samples were preserved 165
conducted under French scientific permit #78/DAF/2004 (September 10, 2004) and permit 167
#032/DAF/SEF/2008 (May 16, 2008) for Mayotte and MC/2009/336 for La Réunion. Genomic 168
DNA was extracted from ~ 25 mg of tissue (muscle or skin) using a Nucleospin Tissue kit 169
(Macherey-Nagel) following the manufacturer‟s protocol. 170
171
Microsatellite genotyping and mitochondrial DNA (mtDNA) sequencing 172
Twelve microsatellite loci previously optimized for S. longirostris were genotyped (Table 1). 173
PCR reactions included 20 ng of genomic DNA, 0.5 U Taq polymerase, 0.25 mM dNTPs, 1.5 174
mM MgCl2, 1X PCR Buffer, 0.125 M of each primer in a 20 L final volume. PCR profiles
175
were as follows: initial 5 min denaturation step at 94C followed by 35 cycles of 30 s at 94C, 30 176
s at a specific annealing temperature (see Table 1), 45 s at 72C, and by a final 7-min extension 177
step at 72C. All PCRs were conducted in a Techne TC-5000 thermocycler. PCR products were 178
visualized using polyacrylamide gels on the LICOR 4300 DNA Analyser. Allele sizes were 179
determined by eye using a size standard, and by two different researchers to ensure consistency in 180
scoring. 181
182
A portion of the mtDNA control region was amplified using primers Dlp-1.5 (5‟-183
TCACCCAAAGCTGRARTTCTA-3‟) (Baker et al. 1998) and Dlp-8G (5‟-184
GGAGTACTATGTCCTGTAACCA-3‟) (Dalebout et al. 2005). PCR reactions included 0.5 U 185
Taq polymerase, 0.25 mM dNTPs, 1.5 mM MgCl2, 1X PCR Buffer, 0.125 M of each primer and
186
50 ng of genomic DNA in a 50 L reaction volume. PCRs were conducted in a Techne TC-187
5000 thermocycler using the following profile: initial 5 min denaturation step at 94C followed 188
by 35 cycles of 30 s at 94C, 30 s at 54C, 45 s at 72C, and by a final 7-min extension step at 189
72C. PCR products were purified and sequenced by Genoscreen (Lille, France). Sequences were 190
edited in Chromas sequence viewer v. 2.33 (Chromas Technelysium) and were aligned using 191 BioEdit v.5.0.6 (Hall 1999). 192 193 Microsatellite analyses 194
We tested for departures from Hardy-Weinberg or linkage equilibrium within each sampled site 195
using Genepop v. 4.2 (Raymond and Rousset 1995) with 10,000 dememorizations, 1,000 batches 196
and 10,000 iterations per batch. The sequential Bonferroni technique (Holm 1979) was applied to 197
correct for multiple tests. The presence of null alleles and scoring errors was assessed using 198
Micro-checker v. 2.2.3 (van Oosterhoot et al. 2004) within each site. We searched for potential 199
duplicates within biopsied animals by comparing their multi-locus genotypes (i.e., searching for 200
identical genotypes in the dataset, and for genotypes with less than three different alleles overall) 201
using Genalex v. 6.41 (Peakall and Smouse 2006). The mitochondrial haplotypes of samples with 202
matching microsatellite genotypes were compared to confirm they were duplicates of the same 203
individual. We investigated whether related individuals were included in the dataset by 204
calculating maximum-likelihood estimates of pairwise relatedness using ML-Relate (Kalinowski 205
et al. 2006). To avoid biases in population inferences that could result from family structure 206
(Anderson and Dunham 2008), we removed one individual from each pair of potential relatives, 207
i.e., individuals showing a pairwise relatedness value greater than 0.45 (as in Viricel and Rosel 208
2014). Allele richness, observed and expected heterozygosity were calculated using FSTAT v. 209
2.9.3.2 (Goudet 1995) and Arlequin v. 3.5.1.2 (Excoffier and Lischer 2010), respectively. These 210
molecular diversity indices were calculated for the whole dataset and for each site separately. 211
Population structure was assessed using a Bayesian approach implemented with Structure v. 2.3.4 213
(Pritchard et al. 2000), which infers the number of populations (K) present in a dataset based on 214
assumptions of Hardy-Weinberg and linkage equilibria within populations. Analyses were 215
conducted using the admixture and correlated allele frequencies models, with and without prior 216
information on individual location (option “LOCPRIOR”). Including prior information on sample 217
locations can improve population inferences, particularly when the level of population 218
differentiation is weak or recent (Hubisz et al. 2009). To verify that using prior information did 219
not artificially result in distinct clusters, we conducted additional Structure runs with the 220
LOCPRIOR option after randomizing the sample location information in the input file. Three 221
randomized input files were created. All Structure runs included 300,000 Markov chain Monte 222
Carlo iterations and a 50,000 step burn in. Ten replicate runs were performed for K values 223
between 1 and 5. Convergence was assessed by examining alpha and likelihood plots, and by 224
comparing individual membership probabilities across replicate runs. The best K was chosen by 225
comparing mean log probabilities among K values, and when K = 1 was ruled out, by applying 226
Evanno‟s method using K (Evanno et al. 2005).
227
228
To assess genotypic variation among individuals and among the three locations, we applied a 229
principal component analysis (PCA) to the microsatellite data using the package adegenet 230
(Jombart 2008) in R v. 3.1.2 (R Core Team, 2015). In the PCA, allele frequencies were scaled 231
using the centring option. An analysis of molecular variance (AMOVA, Excoffier et al. 1992) 232
was conducted in Arlequin v. 3.5.1.2. (Excoffier and Lischer 2010) to estimate genetic 233
differentiation among the three islands. Pairwise FST estimates were calculated and significance
234
was assessed using 10,000 permutations. We tested for isolation by distance (IBD) by conducting 235
a Mantel test comparing pairwise genetic distances (FST/(1-FST), Rousset 1997) with
log-236
transformed (base 10) geographic distances among sampling locations. Geographic distances 237
between population pairs were calculated as the Euclidean distance between the approximate 238
centres of the areas where samples were collected. The Mantel test was performed using IBDWS 239
v. 3.23 (Jensen et al. 2005) with 10,000 randomizations. Finally, we investigated the occurrence 240
of private alleles in each population identified using Genalex v. 6.41. 241
242
MtDNA sequence analyses 243
Diversity indices (haplotype and nucleotide diversities) were calculated for each site using 244
Arlequin. We used JModeltest v. 0.1.1 (Guindon and Gascuel 2003; Posada 2008) and the Akaike 245
Criterion to determine the most appropriate model of substitution given our sequence alignment. 246
AMOVAs comparing the populations identified using Structure were performed in Arlequin. 247
Genetic differentiation was measured using both FST and ST. For ST, distances between
248
haplotypes were calculated using the model of substitution selected with JModeltest. Significance 249
was assessed using 10,000 permutations. We evaluated IBD as described above for microsatellite 250
data. A median-joining network was constructed using Network v.4.6.1.2 (Bandelt et al. 1999) 251
with default parameters to represent relationships among haplotypes. 252
253
Habitat size 254
In order to relate patterns of genetic structure and availability of habitat used by spinner dolphins, 255
we created spinner dolphin habitat maps based on their depth preferences around Zanzibar, 256
Mayotte and La Réunion. From 2004 to 2008, sighting data were collected around Mayotte (n = 257
168 sightings in 224 days of survey) and La Réunion (n = 51 sightings in 278 days of survey) 258
during small-boat dedicated surveys (see Dulau-Drouot et al. 2008; Kiszka et al. 2011 for 259
sampling protocols). For surveys undertaken around Mayotte and La Réunion, the sampling 260
effort did not follow predefined transects and was not homogeneous. However, both surveys 261
covered shallow inshore waters, the outer slope of the reef and deep oceanic habitats (depth > 262
500 m around Mayotte: Kiszka et al. 2011 and depth > 1,000 m around La Réunion: Dulau-263
Drouot et al. 2008). For Zanzibar, as sighting data were unavailable, we used geographic 264
locations of bycatch events that were recorded during a bycatch monitoring program coordinated 265
by the Institute for Marine Sciences, University of Dar es Salaam, based on Zanzibar between 266
2000 and 2007 (n = 27 records). These data were used to determine habitat preferences of spinner 267
dolphins using depth as the main variable. We chose to focus habitat analyses on depth as it was 268
previously identified as one of the main explanatory variables explaining spinner dolphin 269
distribution patterns in this region (Kiszka et al. 2011, Condet & Dulau-Drouot 2016) and in 270
other parts of the world (e.g. Thorne et al. 2012). Depth data were extracted from the 271
GEBCO_2014 Gridded bathymetric dataset (30 arcsecond resolution) hosted on the British 272
Oceanographic Data Center (http://www.bodc.ac.uk). We considered that the preferred habitat 273
corresponded to the depth range where 95% of spinner dolphin observations were made. Thus, 274
we excluded 2.5% of the deepest and 2.5% of the shallowest observations to determine i) the 275
preferred depth range for Mayotte and La Réunion separately (we did not include Zanzibar in this 276
comparison as observations from Zanzibar come from bycatch events and are thus not directly 277
comparable to sighting data from the other two islands), ii) the overall preferred depth range for 278
the three islands together. For the second calculation, group size information available for 279
sightings around Mayotte was taken into account. Our reasoning was that using group size 280
information (when available) better reflects the preferred habitat of these populations (i.e. 281
observing large groups in an area carries more weight than observing a single individual). We 282
computed the total area available within the depth range limits obtained for the three islands 283
together, and mapped these areas for Mayotte and La Réunion. It was not computed for Zanzibar 284
since available habitat within this depth-range is virtually infinite along the East African 285
continental shelf relative to the two islands. The retrieval of individual depths, the computation of 286
projected surfaces and the mapping were all performed with the marmap package v0.9.2 (Pante 287 and Simon-Bouhet 2013) in R v3.1.2. 288 289 290 RESULTS 291 292 Microsatellite data 293
Each sample was genotyped at 8 to 12 loci. No significant departure from Hardy-Weinberg or 294
linkage equilibrium was observed (after sequential Bonferroni correction) in the three sampled 295
sites. Furthermore, no scoring errors were identified using Micro-checker. Possible null alleles 296
were detected for loci EV94 and 415/416 in Mayotte; however, since this issue was restricted to 297
one site, we kept these two loci in all analyses. A duplicate sample was identified (100% 298
matching genotypes and haplotype) in La Réunion, where the same individual was biopsied 299
twice. Five pairs of potential relatives were detected using ML-Relate: two pairs in La Réunion, 300
one pair in Zanzibar, and two pairs in Mayotte. Only one individual from each pair was kept in 301
population analyses conducted with both types of markers (mtDNA and microsatellites) to avoid 302
the potential bias of including relatives. The final microsatellite dataset included 63 individuals 303
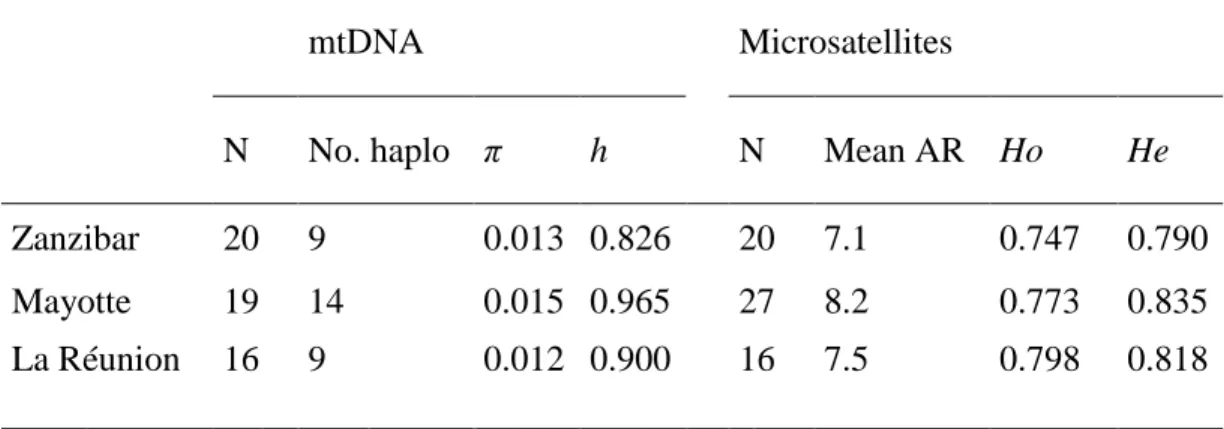
(Table 2). The number of alleles per locus ranged from six to 25 (Table 1). Observed 304
heterozygosity and mean allele richness were similar among the three sites (Table 2). 305
No population subdivision was found when Structure was run without prior information (Fig. 2a). 307
Conversely, genetic structure was detected when individual location was used as prior 308
information. The most likely number of populations present in the dataset was three based on 309
comparison of the mean log probabilities and K (Fig. 2b), and corresponded to the three
310
sampled sites (Fig. 2c): within each site, all individuals were assigned to the same cluster with 311
high ancestry proportions (q > 0.8, mean q = 0.95). Randomizing sample locations in the 312
Structure input file and applying the LOCPRIOR option resulted in no structure being detected 313
by the program (most likely K = 1; see Appendix 1). 314
315
The first principal component of the PCA separated individuals from Mayotte from the other two 316
locations, while the third principal component showed two separate clusters for individuals from 317
La Réunion and Zanzibar (Appendix 2). Some overlap in the PC space was observed among the 318
three clusters. Together, the first three principal components explained 12.7% of the total 319
genotypic variation. The AMOVA conducted among the three populations revealed relatively 320
weak, but significant genetic differentiation (Overall FST = 0.020 p < 0.0001; Table 3). The
321
Mantel test conducted to examine IBD was not significant (r = 0.21, R2 = 0.04, p = 0.51). Private 322
alleles were detected within each of the three sites (Mayotte: 31; La Reunion: 9; Zanzibar: 11). 323
324
MtDNA data 325
The final control region sequence alignment was 720 bp-long and included 28 unique haplotypes 326
(Genbank accession # XXXXXXXX-XX). The sequence alignment included 42 substitutions and 327
no indels. The model selected using JModeltest was Tamura-Nei (Tamura and Nei 1993) with a 328
gamma correction ( = 0.726). Analyses of mitochondrial sequences supported the population 329
structure detected using microsatellite loci: significant differences in mitochondrial haplotype 330
frequencies (after sequential Bonferroni correction) were observed among all sites using FST
331
(Overall FST = 0.084 p < 0.0001; Table 4). However, none of the pairwise comparisons were
332
significant when distances among haplotypes were incorporated in the AMOVA (i.e., using ST,
333
Table 4). The test for IBD was not significant (r = 0.96, R2 = 0.93, p = 0.17). There was one 334
shared haplotype between La Réunion and Zanzibar, and three shared haplotypes between 335
Mayotte and Zanzibar. Mayotte and La Réunion had no haplotypes in common (Fig. 3). No 336
obvious phylogeographic structure was observed on the haplotype network. 337
338
Habitat size 339
Comparing the depth distribution data of the two oceanic islands revealed that the preferred depth 340
range of spinner dolphins around La Réunion (16 to 935 m) was larger than the one calculated for 341
Mayotte (5 to 175 m). When all observation data are combined, the locations used by 95% of the 342
individuals sighted around Zanzibar, Mayotte and La Réunion have a depth range of 9 to 162 m. 343
The total surface available around Mayotte and La Réunion within this depth-range (9 to 162 m) 344
was 1,036 and 327 km², respectively (Figure 4). The habitat surface corresponding to spinner 345
dolphins‟ depth preferences is thus three times larger in Mayotte than in La Réunion. 346 347 348 DISCUSSION 349 350
Marine organisms with high dispersal capacities can show weak genetic structure across large 351
geographic distances. For instance, the short-beaked common dolphin (Delphinus delphis) and 352
the Portuguese dogfish (Centroscymnus coelolepis) each form a single panmictic population 353
across the eastern Atlantic (Veríssimo et al. 2011; Moura et al. 2013). However, even low levels 354
of genetic differentiation can correspond to restricted levels of dispersal in a demographic sense 355
and can be associated with adaptive divergence (e.g., Knutsen et al. 2011; Aykanat et al. 2015), 356
and therefore represent important findings in terms of conservation and management. 357
In highly dispersive marine organisms, incorporating spatial information as prior information in 358
genetic analyses can help reveal genetic differentiation (Selkoe et al. 2008), as illustrated in the 359
present study. Indeed, we did not detect any structure when using a Bayesian approach to detect 360
the number of genetically distinct populations based on microsatellite data alone. Including prior 361
information about sample location in the Bayesian analysis allowed retrieving three populations, 362
corresponding to the distinct islands that were sampled. Our results are in accordance with 363
expectations of Latch et al. (2006) and Hubisz et al. (2009), as the FST estimates we obtained
364
from analysis of microsatellite data fell right in the range where genetic structure can remain 365
undetected without prior information (0.01 < FST < 0.03). This approach (Structure with
366
LOCPRIOR: Hubisz et al. 2009) does not seem to falsely inflate genetic structure as shown in 367
previous studies (e.g. Christie et al. 2010; Russello et al. 2012; Viricel 2012). Results from the 368
three randomizations we conducted indicate the genetic clusters we observed using prior 369
information are biologically significant (Appendix 1). Furthermore, the Mantel test comparing 370
pairwise genetic and geographic distances was not significant, suggesting IBD did not confound 371
our Structure results. The three distinct populations inferred from Structure and observed in the 372
PCA based on nuclear data were supported by the significant genetic differentiation estimated 373
with mitochondrial DNA sequences using FST. Possible explanations for the lack of significant
374
differentiation observed using ST are that the observed genetic differentiation is recent and that
not enough time has passed for new mutations to accumulate within populations; or that 376
migration rates among these populations are greater than the mutation rate of the mitochondrial 377
DNA control region. In these cases, incorporating distances among haplotypes in the AMOVA 378
can increase noise in the analysis (Bird et al. 2011), rendering ST less informative than FST.
379
380
The preferred depth range of spinner dolphins we inferred from sighting and bycatch data (i.e., 381
for the three locations analysed together) confirmed that the species is associated with relatively 382
shallow-water habitat at these locations, which corresponds to their resting grounds. The wider 383
depth range observed for the population of La Réunion (also described in Dulau-Drouot et al. 384
2008) may reflect the very narrow continental shelf of the island, with depth increasing rapidly 385
from the shore, compared to Mayotte. In fact, a recent habitat modelling study showed that 386
despite the wide depth range of spinner dolphin observations aroung La Réunion, most sightings 387
occur between 51 and 63 m of depth, within a “core habitat” also characterised by flat and light-388
colored seabeds (Condet & Dulau-Drouot 2016). Geographic isolation and the reliance of spinner 389
dolphins on appropriate shallow-water resting habitat during daytime are likely factors causing 390
and/or maintaining divergence between populations occupying Mayotte and La Réunion. 391
Although we cannot tease apart the relative role of each of these two factors, hypotheses can be 392
made based on what has been observed in other small delphinid species. Indeed, large 393
geographic distance from continental waters does not seem to be a sufficient driver to cause 394
restricted gene flow in pelagic dolphins found around oceanic islands as illustrated by population 395
structure studies on Atlantic spotted dolphin (Stenella frontalis) and common bottlenose dolphin 396
(T. truncatus) populations from the Azores: the pelagic morphotypes within these two species 397
form panmictic populations over large distances, from the Azores to offshore waters of the 398
northwestern Atlantic at least 4500 km away (Quérouil et al. 2007; Viricel & Rosel 2014). On the 399
other hand, some pelagic island-associated delphinids show restricted gene flow across short 400
distances within an archipelago such as common bottlenose dolphin populations around Hawaii 401
(Martien et al. 2012), or the rough-toothed dolphin (Steno bredanensis), which displays long-402
term site fidelity around the Society Islands (French Polynesia), and fine-scale genetic 403
differentiation between two islands only 170 km apart (Oremus et al. 2012). Thus, daily reliance 404
on near-shore, insular habitats may be a predominant driver of population structure in pelagic 405
delphinids, even more so than geographic isolation. 406
407
The genetic subdivision we observed is consistent with other studies conducted on S. longirostris 408
in the Pacific Ocean, which indicated that insular populations are generally discrete. Levels of 409
genetic differentiation were similar to those observed among Society (French Polynesia) and 410
Hawaii archipelago (Oremus et al., 2007; Andrews et al. 2010). Spinner dolphins found around 411
islands of the Society Archipelago (French Polynesia) form relatively closed communities 412
showing strong island fidelity (Oremus et al. 2007). Gene flow among these communities is 413
restricted, despite the short geographic distances separating some of these islands (i.e. tens of 414
kilometers). Oremus et al. (2007) suggest that these communities are characterised by a 415
metapopulation dynamics, which would explain the high genetic diversity and large island 416
effective population sizes estimated from their molecular data. In the Hawaiian archipelago, fine-417
scale genetic structure is also observed, but patterns of gene flow vary according to social 418
structure and habitat availability (Andrews et al. 2010). Overall, both the genetic and social 419
structure of this species seems to be influenced by the availability and extent of resting areas 420
(Karczmarski et al. 2005; Andrews et al. 2010). In Hawaiian populations, genetic differentiation 421
increased with geographic distance among islands. In the present study, the tests for IBD we 422
conducted for both types of markers were not significant. We have to note, however, that these 423
tests had low statistical power since only three populations were sampled. Thus, future studies 424
analyzing samples from additional islands in the SW Indian Ocean would better allow testing for 425
IBD. Additionally, photo-identification data would complement present findings, as site fidelity 426
may constitute another factor driving population structure in spinner dolphins from the SW 427
Indian Ocean. 428
429
The genetic diversity we measured (Table 2) was similar to what has been reported for this 430
subspecies in French Polynesia (Oremus et al. 2007), and was greater than the diversity observed 431
in Hawaii (Andrews et al. 2010). Despite the genetic differentiation of spinner dolphins from La 432
Réunion and Mayotte, the genetic diversity of these two populations is similar to the diversity of 433
spinner dolphins from the coast of Zanzibar. Factors influencing their population genetic 434
diversity include effective population size (linked to drift) and immigration rates. Given the 435
differences in habitat size among the three sites we compared, the respective local population size 436
of the populations occupying these sites may differ. Thus, we hypothesize that the similar levels 437
of genetic diversity we observe in these populations likely reflect low but recurrent gene flow, 438
which may be sufficient to maintain genetic diversity within island communities. Spinner 439
dolphins from the SW Indian Ocean could thus be under a metapopulation dynamics, similarly to 440
what findings from Oremus et al. (2007) indicate for populations in the Society Archipelago. 441
Alternatively, the genetic divergence we measured could be recent, and these populations may 442
have so far retained ancestral polymorphisms. 443
444
The present study constitutes the first population structure assessment for the spinner dolphin in 445
habitat preferences and patterns of restricted gene flow we identified suggest spinner dolphin 447
populations found off Mayotte and La Réunion are demographically independent from each 448
other. Their differentiation makes them potentially vulnerable if directly impacted by human 449
activities, and spinner dolphins found off these two islands should therefore be treated as two 450
distinct conservation units at the national level. Analysing samples from other islands (e.g. 451
Madagascar, Mauritius) within this region would allow further evaluating the genetic isolation of 452
these populations. Bycatch levels of spinner dolphins in gillnets off Zanzibar (Amir et al. 2002) 453
should be considered as a cause of concern, and this issue highlights the need of a population 454
structure assessment along the east coast of Africa. Protecting important resting habitat is an 455
important step toward the conservation of insular spinner dolphin populations. Dedicated surveys 456
help assessing whether current marine protected areas encompass such habitats (e.g. in la 457
Réunion: Dulau-Drouot et al. 2008) and habitat modelling studies (e.g. Thorne et al. 2012, 458
Condet & Dulau-Drouot 2016) allow identifying key areas where new conservation efforts 459 should be focused. 460 461 Acknowledgements 462
At Mayotte, samples and data from July 2004 to June 2006 were collected during a dolphin 463
research project conducted by the Office National de la Chasse et de la Faune Sauvage (ONCFS, 464
Game and Wildlife Service) and the Agriculture and Forestry Office (Direction de l’Agriculture 465
et de la Forêt). From May 2007 to April 2009, data were collected during a joined programme of
466
the University of La Rochelle, the Office National de la Chasse et de la Faune Sauvage and the 467
Collectivité Départementale de Mayotte. DNA samples were prepared at the Molecular Core
468
Facility at the University of La Rochelle. We would like to thank the Associate Editor and four 469
anonymous reviewers for constructive comments on the manuscript. 470
471
Compliance with ethical standards
472
473
Funding: Funding was provided by the Conseil Général de Mayotte, the Ministère de l’Energie,
474
l’Ecologie, le Développement Durable et de la Mer (MEEDDM), the University of La Rochelle
475
and the Office National de la Chasse et de la Faune Sauvage. The samples and data collected in 476
Zanzibar was supported by funding grants from SIDA/Sarec. In Reunion, sampling was co-477
funded by DEAL-Reunion, BNOI and IRD, as part of the Southwestern Indian Ocean Fisheries 478
Project (SWIOFP). 479
Confict of Interest: The authors declare that they have no conflict of interest.
480
Ethical approval: All applicable international, national, and/or institutional guidelines for the
481
care and use of animals were followed. 482
References
484
485
Amir OA, Berggren P, Jiddawi NS (2002) The incidental catch of dolphins in gillnet fisheries in 486
Zanzibar, Tanzania. WIO J Mar Sci 1:155-162 487
Amir OA, Berggren P, Jiddaw NS (2012) Recent records of marine mammals in Tanzanian 488
waters. J. Cetacean Res. Manage. 12:249–253 489
Amos B, Schlötterer C, Tautz D (1993) Social structure of pilot whales revealed by analytical 490
DNA profiling. Science 260:670-672 491
Anderson RC (2005) Observations of cetaceans in the Maldives, 1990-2002. J Cet Res Manag 492
7:119-135 493
Anderson EC, Dunham KK (2008) The influence of family groups on inferences made with the 494
program structure. Mol Ecol Resour 8:1219-1229 495
Andrews KR et al (2006) Patterns of genetic diversity of the Hawaiian spinner dolphin (Stenella 496
longirostris). Atoll Res Bull 543:65-73
497
Andrews KR et al (2010) Rolling stones and stable homes: social structure, habitat diversity and 498
population genetics of the Hawaiian spinner dolphin (Stenella longirostris). Mol Ecol 499
19:732-748 500
Aykanat T, Johnston SE, Orell P, Niemelä E, Erkinaro J, Primmer CR. 2015. Low but significant 501
genetic differentiation underlies biologically meaningful phenotypic divergence in a large 502
Atlantic salmon population. Mol Ecol 24:5158-5174 503
Baker C et al (1998) Mitochondrial DNA variation and maternal gene flow among humpback 504
whales of the southern hemisphere. Mar Mamm Sci 14:721-737. 505
Bandelt HJ, Forster P, Rohl A (1999) Median-joining networks for inferring intraspecific 506
phylogenies. Mol Biol Evol 16:37-48. 507
Bérubé M, Jorgensen H, McEwing R, Palsbøll PJ (2000) Polymorphic di-nucleotide 508
microsatellite loci isolated from the humpback whale, Megaptera novaeangliae. Mol Ecol 509
9:2181-2182 510
Bird CE, Karl SA, Smouse PE, Toonen RJ (2011) Detecting and measuring genetic 511
differentiation. In: Koenemann S, Held C, Schubart CD (ed) Crustacean Issues: 512
Phylogeography and Population Genetics in Crustacea, 1st edn. CRC Press, Boca Raton, pp 513
31-55 514
Caldwell M, Gaines MS, Hughes CR (2002) Eight polymorphic microsatellite loci for bottlenose 515
dolphin and other cetacean species. Mol Ecol Notes 2:393-395 516
Christie MR, Johnson DW, Stallings CD, Hixon MA (2010) Self-recruitment and sweepstakes 517
reproduction amid extensive gene flow in a coral-reef fish. Mol Ecol 19:1042-1057 518
Ciannelli L et al (2010) Small-scale genetic structure in a marine population in relation to water 519
circulation and egg characteristics. Ecology 91(10):2918-2930 520
Condet M, Dulau-Drouot V (2016) Habitat selection of two island-associated dolphin species 521
from the south-west Indian Ocean. Cont Shelf Res 125:18-27 522
Cowen RK, Lwiza MMK, Sponaugle S, Paris CB, Olson DB (2000) Connectivity of marine 523
populations: Open or closed? Science 287:857-859 524
Cowen RK, Gawarkiewicz G, Pineda J, Thorrold SR, Werner FE (2007) Population connectivity 525
in marine systems: An overview. Oceanography 20:14-21 526
Dalebout ML et al (2005) Worldwide structure of mtDNA diversity among Cuvier‟s beaked 527
whales (Ziphius cavirostris): implications for threatened populations. Mol Ecol 14:3353-528
3371 529
Dolar MLL, Walker WA, Kooyman GL, Perrin WF (2003) Comparative feeding ecology of 530
spinner dolphins (Stenella longirostris) and Fraser‟s dolphins (Lagenodelphis hosei) in the 531
Sulu Sea. Mar Mamm Sci 19:1-1 532
Dulau-Drouot V, Boucaud, V, Rota B (2008) Cetacean diversity off La Réunion Island (France). 533
J M Biol Ass UK 88:1263-1272 534
Evanno G, Regnaut S, Goudet J (2005) Detecting the number of clusters of individuals using the 535
software STRUCTURE: a simulation study. Mol Ecol 14:2611-2620 536
Excoffier L, Lischer HE (2010) Arlequin suite ver 3.5: a new series of programs to perform 537
population genetics analyses under Linux and Windows. Mol Ecol Resour 10:564-567 538
Excoffier L, Smouse P, Quattro J (1992) Analysis of molecular variance inferred from metric 539
distances among DNA haplotypes: Application to human mitochondrial DNA restriction 540
data. Genetics 131:479-491 541
Fontaine MC et al (2007) Rise of oceanographic barriers in continuous populations of a cetacean: 542
the genetic structure of harbour porpoises in Old World waters. BMC Biol 5:30 543
Fullard KJ, Early G, Heide-Jørgensen MP, Bloch D, Rosing-Asvid A, Amos W (2000) 544
Population structure of long-finned pilot whales in the North Atlantic: a correlation with sea 545
surface temperature? Mol Ecol 9:949-958 546
Gannier A, Petiau E (2006) Environmental variables affecting the residence of spinner dolphins 547
(Stenella longirostris) in the Bay of Tahiti (French Polynesia). Aquat Mamm 32:202-211 548
Goudet J (1995) FSTAT (version 1.2.): a computer program to calculate F-statistics. J Hered 549
86:485-486 550
Guindon S, Gascuel O (2003) A simple, fast, and accurate algorithm to estimate large 551
phylogenies by maximum likelihood. Syst Biol 52:696-704 552
Hall T (1999) BioEdit: a user-friendly biological sequence alignment editor and analysis program 553
for Windows 95/98/NT. Nucl Acid S 41:95-98 554
Halpern BS et al (2008) A global map of human impact on marine ecosystems. Science 319:948-555
952 556
Hoelzel AR (2009) Evolution of population genetic structure in marine mammal species. In: 557
Bertorelle G, Bruford MW, Hauffe HC, Rizzoli A, Vernesi C (eds) Cambridge University 558
Press, New York, pp 294-318 559
Hoelzel AR, Dahlheim M, Stern SJ (1998) Low genetic variation among killer whales (Orcinus 560
orca) in the eastern North Pacific and genetic differentiation between foraging specialists. J
561
Hered 89:121-128 562
Holm S (1979) A simple sequentially rejective multiple test procedure. Scand J Stat 6:65-70 563
Hubisz MJ, Falush D, Stephens M, Pritchard J (2009) Inferring weak population structure with 564
the assistance of sample group information. Mol Ecol Resour 9:1322-1332 565
Jensen JL, Bohonak AJ, Kelley ST (2005) Isolation by distance, web service. BMC Genetics 566
6:13. V.3.23 http://ibdws.sdsu.edu/ 567
Jombart T. (2008) adegenet: a R package for the multivariate analysis of genetic markers. 568
Bioinformatics 24:1403-1405 569
Kalinowski ST, Wagner AP, Taper ML (2006) ML-Relate: a computer program for maximum-570
likelihood estimation of relatedness and relationship. Mol Ecol Notes 6:576-579 571
Karczmarski L, Würsig B, Gailey G, Larson KW, Vanderlip C (2005) Spinner dolphin in a 572
remote Hawaiian atoll: social grouping and population structure. Behav Ecol 16:675-685 573
Kiszka J et al (2008) Marine mammal bycatch in the Southwest Indian Ocean: Review and need 574
for a comprehensive status assessment. Western Indian Ocean J Mar Sci 7:119-136 575
Kiszka J, Ersts PJ, Ridoux V (2010a) Structure of a toothed cetacean community around a 576
tropical island (Mayotte, Mozambique Channel). Afr J Mar Sci 32(3):543-551 577
Kiszka J, Simon-Bouhet B, Charlier F, Pusineri C, Ridoux V (2010b) Individual and group 578
behavioural reactions of small delphinids to remote biopsy sampling. Anim Welfare 19:411-579
417 580
Kiszka J, Breysse O, Vely M (2010c) Preliminary account of cetacean diversity and humpback 581
whale (Megaptera novaeangliae) group characteristics around the Union of the Comoros 582
(Mozambique Channel). Mammalia 74:51-56 583
Kiszka J, Simon-Bouhet B, Martinez L, Pusineri C, Richard P, Ridoux V (2011) Ecological niche 584
segregation within a community of sympatric dolphins around a tropical island. Mar Ecol 585
Prog Ser 433:273-288 586
Knutsen H, Olsen EM, Jorde PE, Espeland SH, André C, Stenseth NC. 2011. Are low but 587
statistically significant levels of genetic differentiation in marine fishes „biologically 588
meaningful‟? A case study of coastal Atlantic cod. Mol Ecol 20:768-783 589
Krützen M, Valsecchi E, Connor RC, Sherwin WB (2001) Characterization of microsatellite loci 590
in Tursiops aduncus. Mol Ecol Notes 1:170-172 591
Latch EK, Dharmarajan G, Glaubitz JC, Rhodes OE Jr (2006) Relative performance of Bayesian 592
clustering software for inferring population substructure and individual assignment at low 593
levels of population differentiation. Conserv Genet 7:295-302 594
Louis M et al (2014a) Ecological opportunities and specializations shaped genetic divergence in a 595
highly mobile marine top predator. Proc R Soc B 281:20141558 596
Louis M et al (2014b) Habitat-driven population structure of bottlenose dolphins, Tursiops 597
truncatus, in the North-East Atlantic. Mol Ecol 23:857-874
Mannocci L et al (2014) Predicting top predator habitats in the Southwest Indian Ocean. 599
Ecography 37(3):261-278 600
Martien KK et al (2012) Population structure of island-associated dolphins: evidence from 601
mitochondrial and microsatellite markers for common bottlenose dolphins (Tursiops 602
truncatus) around the main Hawaiian Islands. Mar Mamm Sci 28:E208-E232
603
Mendez M et al (2013). Integrating multiple lines of evidence to better understand the 604
evolutionary divergence of humpback dolphins along their entire distribution range: a new 605
dolphin species in Australian waters? Mol Ecol 22: 5936-5948. 606
Mendez M et al (2011) Molecular ecology meets remote sensing: environmental drivers to 607
population structure of humpback dolphins in the Western Indian Ocean. Heredity 107:349-608
361. 609
Möller LM, Valdez FP, Allen S, Bilgmann K, Corrigan S, Beheregaray LB (2011) Fine-scale 610
genetic structure in short-beaked common dolphins (Delphinus delphis) along the East 611
Australian Current. Mar Biol 158:113-126 612
Möller LM, Wiszniewski J, Allen SJ, Beheregaray LB (2007) Habitat type promotes rapid and 613
extremely localised genetic differentiation in dolphins. Mar Freshwat Res 58:640-648 614
Moura AE, Natoli A, Rogan E, Hoelzel AR (2013) Atypical panmixia in a European dolphin 615
species (Delphinus delphis): implications for the evolution of diversity across oceanic 616
boundaries. J Evol Biol 26:63-75 617
Norris KS, Würsig B, Wells RS, Würsig M (1994) The Hawaiian Spinner Dolphin, University of 618
California Press, Berkeley, 408 pp. 619
van Oosterhoot C, Hutchinson W, Wills D, Shipley P (2004) MICRO-CHECKER: software for 620
identifying and correcting genotyping errors in microsatellite data. Mol Ecol Notes 4:535-621
Oremus M, Poole MM, Steel D, Baker CS (2007) Isolation and interchange among insular 623
spinner dolphin communities in the South Pacific revealed by individual identification and 624
genetic diversity. Mar Ecol Prog Ser 336:275-289 625
Oremus M, Poole MM, Albertson GR, Baker CS (2012) Pelagic or insular? Genetic 626
differentiation of rough-toothed dolphins in the Society Islands, French Polynesia. J Exp Mar 627
Biol Ecol 423-433:37-46 628
Palsbøll PJ, Bérubé M, Larsen AH, Jørgensen H (1997) Primers for the amplification of tri- and 629
tetramer microsatellite loci in baleen whales. Mol Ecol 6:893-895 630
Pante E, Simon-Bouhet B (2013) marmap: A package for importing, plotting and analyzing 631
bathymetric and topographic data in R. PLoS ONE 8(9): e73051. 632
doi:10.1371/journal.pone.0073051 633
Peakall R, Smouse PE (2006) GENALEX 6 : genetic analysis in Excel. Population genetic 634
software for teaching and research. Mol Ecol Notes 6:288-295 635
Pelc RA, Warner RR, Gaines SD (2009) Geographical patterns of genetic structure in marine 636
species with contrasting life histories. J Biogeogr 36:1881-1890 637
Perrin WF (2009) Spinner dolphin Stenella longirostris. In: Perrin WF, Würzig B, Thewissen J 638
(ed) Encyclopedia of Marine Mammals, 2nd edn. Academic Press, San Diego, pp 1100-1103 639
Perrin WF, Dolar M, Louella L, Robineau D (1999). Spinner dolphins (Stenella longirostris) of 640
the western Pacific and Southeast Asia: pelagic and shallow-water forms. Mar Mamm Sci 641
15(4):1029-1053 642
Perrin WF, Gilpatrick JW Jr. (1994) Spinner dolphin Stenella longirostris (Gray, 1828). In: 643
Ridway SH and Harrison R (eds) Handbook of marine mammals, Academic Press, London, 644
pp 99-128. 645
Perrin WF, Warner RR, Fiscus CH, Holtz DB (1973) Stomach content of porpoise, Stenella spp., 646
and yellowfin tuna, Thunnus albacares, in mixed-species aggregations. Fish Bull 71:1077-647
1092 648
Posada D (2008) jModelTest : Phylogenetic model averaging. Mol Biol Evol 25:1253-1256 649
Pritchard JK, Stephens M, Donnelly P (2000) Inference of population structure using multilocus 650
genotype data. Genetics 155:945-959 651
Quérouil S et al (2007) High gene flow in oceanic bottlenose dolphins (Tursiops truncatus) of the 652
North Atlantic. Conserv Genet 8:1405-1419 653
R Core Team (2015) R: A language and environment for statistical computing. R Foundation for 654
Statistical Computing, Vienna, Austria. URL http://www.R-project.org/
655
Raymont M, Rousset F (1995) Genepop (version 1.2), population genetics software for exact 656
tests and ecumenicism. J Hered 86:248-249 657
Razafindrakoto Y, Andrianarivelo N, Cerchio S, Rasoamananto I, Rosenbaum H (2008) 658
Preliminary assessment of cetacean incidental mortality in artisanal fisheries in Anakao, 659
southwestern region of Madagascar. WIO J Mar Sci 7(2):175-184 660
Rosel PE, France SC, Wang JY, Kocher TD (1999) Genetic structure of harbour porpoise 661
Phocoena phocoena populations in the northwest Atlantic based on mitochondrial and
662
nuclear markers. Mol Ecol 8:541-554 663
Rosenbaum HC (2003) Marine mammals of Madagascar. In: Godman S, Bengston J (eds), The 664
natural history of Madagascar, University of Chicago Press, Chicago, pp 213-216 665
Rousset F (1997) Genetic differentiation and estimation of gene flow from F-statistics under 666
isolation by distance. Genetics 145:1219-1228 667
Russello MA, Kirk SL, Frazer KK, Askey PJ (2012) Detection of outlier loci and their utility for 668
Selkoe KA, Henzler CM, Gaines SD (2008) Seascape genetics and the spatial ecology of marine 670
populations. Fish Fish 9:363-377 671
Stensland E, Berggren P, Johnstone R, Jiddawi N (1998) Marine mammals in Tanzanian waters: 672
urgent need for status assessment. Ambio 27: 771-774 673
Tamura K, Nei M (1993) Estimation of the number of nucleotide substitutions in the control 674
region of mitochondrial DNA in human and chimpanzees. Mol Biol Evol 10:512-526 675
Thorne LH et al (2012) Predictive modeling of spinner dolphin (Stenella longirostris) resting 676
habitat in the main Hawaiian Islands. PLoS One 7(8) :e43167 677
Valsecchi E, Amos W (1996) Microsatellite markers for the study of cetacean populations. Mol 678
Ecol 5:151-156 679
Veríssimo A, McDowell JR, Graves JE (2011) Population structure of a deep-water squaloid 680
shark, the Portuguese dogfish (Centroscymus coelolepis). ICES J Mar Sci 68:555-563 681
Viricel A (2012) Using genetics to assess population structure in three cetacean species and to 682
investigate the etiology of cardiomyopathy in Kogia breviceps. Dissertation, University of 683
Louisiana at Lafayette 684
Viricel A, Rosel PE (2014) Hierarchical population structure and habitat differences in a highly 685
mobile marine species: the Atlantic spotted dolphin. Mol Ecol 23:5018-5035 686
Webster I, Cockcroft VG, Cadinouche A (2015) Spinner dolphins Stenella longirostris off south-687
west Mauritius: abundance and residency. Afr J Mar Sci 37(1):115-124 688
Würsig B, Wells RS, Norris KS, Würsig M (1994) A spinner dolphin‟s day. In: Norris KS, 689
Würsig B, Wells RS, Würsig M (eds) The Hawaiian Spinner Dolphin London, University of 690
California Press, pp 65-102 691
692
694
695
Tables
697
Table 1. Twelve microsatellite loci genotyped in this study. PCR annealing temperature (Ta), 698
reference, number of alleles, observed (Ho) and expected (He) heterozygosity are given for 699
each locus. 700
Locus Ta (°C) Reference Number of alleles Ho He
415/416 45 Amos et al. 1993 12 0.772 0.889 GT575 60 Bérubé et al. 2000 10 0.679 0.778 GT6 60 Caldwell et al. 2002 6 0.635 0.676 AAT44 55 Caldwell et al. 2002 10 0.770 0.710 KWM12a 46 Hoelzel et al. 1998 10 0.889 0.844 MK5 50 Krützen et al. 2001 13 0.786 0.912 MK6 50 Krützen et al. 2001 18 0.879 0.931 GATA98 54 Palsbøll et al. 1997 9 0.655 0.804 PPHO142 50 Rosel et al. 1999 9 0.804 0.810 PPHO131 57 Rosel et al. 1999 12 0.755 0.834 EV1
EV94
47 54
Valsecchi and Amos 1996 Valsecchi and Amos 1996
16 25 0.868 0.772 0.902 0.925 701
Table 2. Mitochondrial DNA (mtDNA) and microsatellite diversity indices for Stenella 702
longirostris from each site: N, sample size; No. haplo, number of haplotypes; π, nucleotide
703
diversity; h, haplotype diversity; AR, allele richness; Ho, observed heterozygosity; He,
704
expected heterozygosity 705
mtDNA Microsatellites
N No. haplo π h N Mean AR Ho He
Zanzibar 20 9 0.013 0.826 20 7.1 0.747 0.790 Mayotte 19 14 0.015 0.965 27 8.2 0.773 0.835 La Réunion 16 9 0.012 0.900 16 7.5 0.798 0.818
Table 3. AMOVA results obtained from analysis of microsatellite data from 63 S. longirostris 706
individuals. Pairwise FST values are shown below diagonal and corresponding p-values
707
above diagonal. 708
709
Zanzibar Mayotte La Réunion
Zanzibar NA <0.001* <0.001*
Mayotte 0.024 NA 0.009*
La Réunion 0.025 0.013 NA
*significant p-value after sequential Bonferroni correction 710
711
Table 4. AMOVA results for mitochondrial DNA sequences. Pairwise FST and ST values are
712
shown below and above diagonal, respectively. 713
714
Zanzibar Mayotte La Réunion
Zanzibar NA 0.050 0.014
Mayotte 0.058* NA 0.066
La Réunion 0.130* 0.067* NA
*significant p-value after sequential Bonferroni correction 715
716
Figure Legends
718
Figure 1. Study area and sample locations. Sample sizes are indicated for each site. The 200 m
719
and 1,000 m isobaths are represented by darker lines. 720
Figure 2. Bayesian clustering analysis (Structure) results obtained from analysis of 12
721
microsatellite loci (a) without any prior information and (b) using prior information about 722
sample location (“LOCPRIOR” option). The mean log probability (LnP(K)) is given for each 723
K tested and the K from Evanno‟s method is shown between successive K values. (c) The
724
barplot represents individual ancestry proportions for the three populations obtained using 725
the “LOCPRIOR” option. 726
Figure 3. Median-joining network of 28 mitochondrial control region haplotypes observed in 63
727
S. longirostris individuals. Filled circles represent haplotypes and their size is proportional to
728
their frequency in the dataset. Circles are shaded in colours proportionally to the number of 729
individuals from each population (Mayotte: blue; La Reunion: green; Zanzibar: red). 730
Unsampled or extinct intermediate haplotypes are shown as black dots. Each line 731
corresponds to one mutational step, except when a number of mutations is adjacent to it. 732
Figure 4. Maps showing the surface available for daytime resting for spinner dolphins around
733
Mayotte (top) and La Réunion (bottom). These surfaces were estimated based on the 734
preferred depth-range of spinner dolphins in the SW Indian Ocean. Maps include all 735
sightings, including outlier observations that were not used to determine the preferred depth 736
range (see Material and Methods). 737
Figures
739
Figure 1. 740
Figure 2 742 K LnP(K) K -2885 na 2 1 -3579 3.4 3 -3078 2.2 4 -3007 5.7 5 -3086 na
a)
c)
b)
K LnP(K) K -2885 na 2 1 -2856 3.0 3 -2808 19.4 4 -2841 0.2 5 -2877 na 1.00Mayotte La Réunion Zanzibar
1.00 0.80 0.60 0.40 0.20 0.00 a n c e s tr y p ro p o rt io n 743
Figure 3 744 2 5 5 5 2 2 2 3 2 2 2 2 6 4 5 2 2 745
Figure 4 746
747