HAL Id: hal-00486484
https://hal.archives-ouvertes.fr/hal-00486484
Submitted on 2 Dec 2020
HAL is a multi-disciplinary open access
archive for the deposit and dissemination of
sci-entific research documents, whether they are
pub-lished or not. The documents may come from
teaching and research institutions in France or
abroad, or from public or private research centers.
L’archive ouverte pluridisciplinaire HAL, est
destinée au dépôt et à la diffusion de documents
scientifiques de niveau recherche, publiés ou non,
émanant des établissements d’enseignement et de
recherche français ou étrangers, des laboratoires
publics ou privés.
Statistical analysis of the Syracuse 3 satellite EHF
propagation experiment
T. Marsault, Louis de Montera, J.D. Hermant, Cécile Mallet, Laurent
Barthès, Peter Golé
To cite this version:
T. Marsault, Louis de Montera, J.D. Hermant, Cécile Mallet, Laurent Barthès, et al.. Statistical
anal-ysis of the Syracuse 3 satellite EHF propagation experiment. 3rd European Conference on Antennas
and Propagation, 2009 (EuCAP 2009), Mar 2009, Berlin, Germany. pp.3611-3615. �hal-00486484�
Statistical analysis of the Syracuse 3 satellite EHF
propagation experiment
T. Marsault*, L. De Montera
#, J.D. Hermant*, C. Mallet#, L. Barthes
#, P. Gole
#* DGA CELAR, B.P. 7, 35 998 Rennes Armées, France
Email: [email protected]
# LATMOS/CETP,10-12 avenue de l'europe, 78140 VELIZY, France,
Email: [email protected]
Abstract— An Earth-to-satellite propagation experiment
operating at EHF band was set up within the framework of the Syracuse 3 program. Syracuse 3 satellites are the new generation of French military SATCOM system. This experiment is a good opportunity to make attenuation measurements and increase our knowledge of tropospheric propagation effects on EHF links at a low elevation angle (17°). At these frequencies (20 & 44 GHz), the attenuation due to the troposphere can be very strong. This paper presents yearly statistics concerning attenuation level, frequency scaling ratio and fade durations. A comparison with ITU models is given.
I. INTRODUCTION
In order to improve propagation knowledge in Q band and to prepare future military European telecommunication systems, DGA has decided to use the payload of Syracuse 3 to carry out an EHF propagation experiment.
The first part of the paper describes briefly the experimental setup. A number of statistical analyses performed over a period of two years are then presented. Analysis of cumulative attenuation at 20 and 44 GHz will be presented and a comparison with ITU model will be discussed.
The statistical analysis of instantaneous frequency scaling coefficients is then presented, comparisons with existing models are made and the influence of gas and clouds on the scaling coefficients is investigated.
An analysis of fade duration statistics is then presented. The influence of the size of the moving average window used to remove scintillation is discussed.
Based upon the rain rate measurements performed by means of the disdrometer comparisons are presented between beacon attenuation and the attenuation estimated from rain measurements at a fine time scale. Equivalent rain length are deduced from these measurements. The obtained statistics are compared to the ITU model.
II. EXPERIMENTAL SET-UP
The EHF propagation experiment is carried out by CELAR and will extend over a three-year period (2006-2009). Three independent earth stations transmit toward the Syracuse 3A satellite in the 44-45 GHz frequency band. The 44/20 GHz repeater onboard the satellite down-converts these signals to
the 20.2-21.2 GHz band and after amplification retransmit them to the earth stations. The EHF spot covers the French metropolitan territory. The three ground stations are represented in fig. 1: M1 is located at CELAR near Rennes in Western France, M3 is located at Chartres near Paris and M4 is located near Carcassonne in the South of France. The three stations transmit simultaneously an EHF signal and receive the three signals (their own and the two other ones). In addition, a 20 GHz beacon onboard the satellite is received by each station. The data are recorded at a 1 Hz sampling rate. The measurements were stopped since August 2007 in M4 station. On the CELAR site, a second receiving station named ESOPE is measuring the beacon level and one of the three received signals from M1 with a higher sampling rate (from 10 to 1000 samples per second). The dynamic range is nearly 30 dB for the 20 GHz channel and 35 dB for 44/20 GHz channel. For each earth station, radiowave measurements are associated with ground meteorological measurements such as temperature, humidity, pressure, wind, rain, etc. Other meteorological data are provided by the French weather service Meteo-France or by a Permanent GPS Network (RGP) which gives the Integrated atmospheric Water Vapour content (IWV) estimated from a network of GPS receivers (for further information see [1] [2]).
On the CELAR site, a dual-frequency radiometer measures sky brightness temperatures at 21 GHz and 30 GHz in the direction of Syracuse 3A. This allows liquid and vapor water contents to be determined in order to calculate gaseous and cloud attenuation. Under clear sky conditions, this attenuation is used to calculate the 0-dB reference level. A dual-beam infrared disdrometer is installed near the station and provides data about the fine structure of rain (size of droplets, fall velocity and times of arrival) but also rain rate. These measurements are useful to study the effects of the microphysical structure of rain.
The attenuation at 20 GHz is estimated directly from the beacon onboard the satellite whereas the estimation of the attenuation at 44 GHz is a little more complex: the 20 GHz signal received by the ground stations undergoes combined attenuation on the 44 GHz uplink and the 20 GHz downlink
As a consequence, it is necessary to subtract the contribution to attenuation at 20 GHz to obtain the 44 GHz attenuation.
Figure 1: Diagram of the Syracuse experiment
III. STATISTICAL RESULTS
A. Attenuation statistics
Figure 2 illustrates attenuation excess probabilities defined as the percentage of total measurement time during which any given level of attenuation is exceeded. The 20 GHz and 44 GHz measurements at CELAR station during year 2007 and 2008 are considered. The availability of the data is equal to 75% for both channels in 2007 and respectively equal to 71% and 60% for 20 GHz and 44 GHz in 2008. Concerning the 20 GHz channel, the obtained statistics are consistent with the ITU model (see Fig. 2) [3], although a small annual variability between 2007 (dashed black curve) and 2008 (solid black curve) can be noted. For the 44 GHz channel the measured statistics are still consistent with the ITU model. Note that the presence of rain droplets sticked on the radome of the antenna induced an over-estimation of 3 dB at 44 GHz during year 2007. This problem has been addressed in [2]. Thereafter a blower was added on the antenna of M1 station to remove these droplets, thus the 2008 measurement have not been affected by this problem. Red curves show monthly attenuation statistics (from November 2007 to November 2008) and illustrate the high variability of the attenuation process.
B. Frequency scaling
Two different kinds of frequency scaling ratio can be considered:
Long term frequency scaling ratio describes the relationship between attenuations for the same probability level:
)
(
)
(
)
(
20 44P
A
P
A
P
K
equ=
(1)Where
A
f(P)
corresponds to the attenuation exceeded at frequency f for a given probability P (Figure 2).Figure 2: Attenuation statistics at 20 (top) and 44 GHz (bottom) in Rennes for 2007 (dashed black curve),2008 (solid black curve). Red curves are monthly statistics from Nov. 2007 to Nov. 2008 and blue curves are ITU model.
Short term frequency scaling or instantaneous frequency scaling ration describes the relationship between simultaneous attenuations at different frequencies.
K
inst(t) =
A
44(t)
A
20(t)
(2)
Where
A
f(t)
corresponds to the attenuation at frequency fand time t.
Theses empirical ratios are compared with frequency scaling ratio models. As the various atmospheric contributions (rain, gas and clouds) behave differently as a function of frequency, each one generates a different frequency scaling ratio. When one contribution is more significant than the others (typically, during strong rain events), the total scaling ratio is determined essentially by that relevant contribution. Consequently, in the case of very strong attenuation, the total scaling ratio can be approximated by the scaling ratio due to rain. For smaller rain events the effect of the atmospheric
Uplink 44GHz Downlink 20 GHz Beacon 20 GHz SYR-3-A M1-E M1-S M1 & Esope (Rennes) M4 (Carcassonne) M3 (Chartres) Repeater 44-20GHz
gases (oxygen and water vapor) and clouds can not be neglected as they can cause attenuation up to 7 dB for 17° elevation link at 44 GHz. Therefore a separation of the physical effects has to be performed.
A neural network has been developed at the CETP for this purpose [4][5]. The input data are the 20 GHz attenuation and ground meteorological data that are shown to improve the performances of the neural network (pressure, temperature and humidity). The output of the neural network provides an estimation of the contributions of each component to the overall measured attenuation. They are called the normalized contributions (Wgas, Wclouds and Wrain) and correspond to the
relative contribution of the different components to the total attenuation.
Once the separation of the effect is realized, the frequency scaling can be performed. The frequency scaling ratio can be written as follow when using the component weights given by the output of the neural network:
K
mod= W
gas.K
gas+ W
clouds.K
clouds+ W
rain.K
rain (3)Where Kgas, Kclouds and Krain are the specific scaling ratios of
each component (see [6] for more details). The calculation of the total scaling ratio Kmod is made easier by the fact that the
unknown equivalent length of the link is eliminated in the ratio. The specific attenuations of the gases are estimated with the ITU-R model that uses ground meteorological data and standard atmospheric profiles models. The cloud specific attenuations are also given by the ITU-R model [7]. The ratio eliminates the unknown cloud water content and the scaling ratio of the attenuation cloud only depends on the ratio of the frequencies with a second order dependency on temperature. The scaling factor of the rain component is given in ITU-R (2007) and is noted KITU in the following. The specific 20/44
GHz scaling frequency ratios given by the tree models range between 1.5 to 2 for Kgas, 4.5 for Kcloud and 3.8 to 3 for KITU.
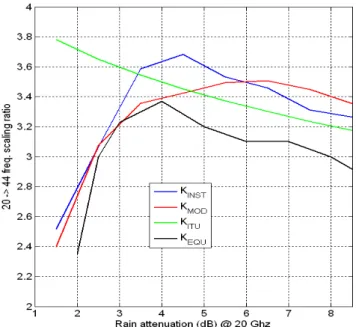
Figure 3 shows a comparison between mean empirical (Kinst,
KEQU) and estimated (Kmod, KITU) frequency scaling ratios as a
function of the 20 GHz attenuation. For low attenuation gases give the main contribution and the instantaneous scaling frequency ratio Kinst is closed to 2.5. Kmod is in accordance
with this latter value whereas due to the weak contribution of rain, KITU overestimates Kinst. For higher attenuation Kinst
increases with the contribution of clouds and reaches 3.65 for an attenuation of 4.5 dB. Beyond this latter value rain contributes more and more and Kinst tends toward the
frequency scaling ratio of rain (Krain) which is lower than
Kcloud. Kinst is therefore decreasing. As it can be seen on Fig. 3,
KMOD remains closed to Kinst and KITU tends toward Kinst as
expected. As to KEQU, its value is always lower than Kinst
whatever the attenuation.
Figure 3 : Frequency scaling ratio versus 20 GHz attenuation. Black curve represents long term scaling ratio (KEQU), blue
curve is the instantaneous ratio (Kinst), green curve is the
(rain) ITU model (KITU), and red curve is the combination of
gas, cloud and rain ITU frequency scaling models (Kmod , see
Eq. 3).
C. Fade duration
Fade duration, denoted d, indicates the time length how long the attenuation will exceed a certain threshold value T. The fade duration depends on threshold, frequency, elevation angle and on how the data are filtered. Fade duration statistics were extracted from Syracuse measurements at 20 GHz in CELAR near Rennes. The data were low pass filtered with four different average moving windows (L=1, 10, 50 and 100 seconds). Fig 4 displays cumulative fade duration distributions
)
/
(
d
D
A
T
F
>
>
for the period from February 2007 to December 2008 with a 4 dB threshold. Blue curves were obtained with the different filters and red curve shows the ITU1623 model [8]. When a 50 seconds moving average filter is used the obtained CDF looks like a log-normal law and is very similar to the ITU model. Such a low pass filter (0.02 Hz cut-off frequency) is often used to remove scintillations. However it can be seen on fig. 4 that if a different cut-off frequency 1/L is used a break at L seconds appears but the CDF slope beyond this point remains the same. This indicates that the filtering of scintillations might not be relevant since it introduces an unnecessary complexity. When a classical one second moving average filter is used, the CDF can be represented by a simple power law which is presented on figure 5 for 3 different thresholds (T=2, 4 and 8 dB). The power law is valid over 5 decades and more precisely to 1 second to 55 hours. The exponent of the power law is threshold dependant and the following model is proposed:66 . 0 57 . 1
53
.
0
)
/
(
d
D
A
T
D
TF
>
>
=
− × (4)Additional data in the near future should allow verifying the accuracy of this model for D > 105 seconds and extending the model for any frequencies and elevations.
Figure 4 : CDF of fade durations obtained at 20 GHz for different averaging windows (blue curves) compared with ITU1623 model (red curve)
Figure 5 : CDF of fade durations obtained at 20 GHz for three different thresholds (T=2, 4, 8 dB) using the raw data (1 second averaged).
D. Equivalent rain length (Longueur de pluie équivalente de la liaison)
Un disdromètre colocalisé avec la station de réception permet de mesurer l'intensité de pluie R. L'objectif de l'étude ci-après est d'estimer la longueur effective de la liaison sous la pluie Leff. Le principal problème est que les mesures de pluie
réalisées au sol par le disdromètre sont locales alors que l'affaiblissement sur une liaison met en jeu une zone pluvieuse plus importante de l'ordre de quelques kilomètres. Afin de tenter de représenter aux mieux à partir des mesures locales de pluie le comportement d'une liaison, nous avons
supposé que compte tenu du vent horizontal le disdromètre 'voyait' défiler au bout d'un certain laps de temps l'ensemble de la zone pluvieuse. Nous avons donc cherché à savoir quel est le temps d'intégration du disdromètre qui permet de représenter au mieux l'affaiblissement. Pour cela, nous avons cherché quel était le temps d'intégration qui permet d'estimer un affaiblissement linéïque le mieux corrélé avec l'affaiblissement de la balise à 20 GHz. Finalement nous avons trouvé qu'un temps d'intégration de 5 minutes est nécessaire pour obtenir le meilleur coefficient de corrélation (0.7). Il convient toutefois de noter que ce temps d'intégration est une valeur moyenne et qu'il varie avec les conditions météorologiques notamment en fonction de la vitesse du vent.
La formule ci-dessous préconisée par la recommendation ITU-618 permet de déduire l'affaiblissement linéique à 20 GHz:
)
(
20aR
dB
km
K
b=
(5)L'affaiblissement total est donné par:
eff
L
K
A
20=
20×
(6)La mesure simultanée de l'affaiblissement à 20 GHz et de l'intensité de pluie permet d'estimer la longueur équivalente effective Leff. La figure ci-dessous représente l'histogramme
des longueurs équivalentes, on peut remarquer que la longueur la plus probable se situe aux alentours de 8 km. Une estimation de Leff a été réalisée par la méthode des moindres
carrés dans le plan (K20, A20) et donne une valeur de 6.5 km.
Cette valeur est très proche de celle fournie par le modèle ITU (6.7 km).
Figure 6 : Histogram of equivalent rain length
IV. CONCLUSIONS
An Earth-to-satellite propagation experiment operating at 20 and 44 GHz with a low elevation angle (17°) has been set up within the framework of the Syracuse 3 program. Two years of data have been collected between 2007 and 2008. Despite the specificities of the experience attenuation statistics are consistent with ITU model within inter annual variability.
Concerning frequency scaling, the ITU model designed specifically for the rain contribution cannot be used directly since at 44 GHz, gases and clouds contributions can not be neglected. A model that includes separation of the effects has been tested and fit correctly the empirical instantaneous frequency scaling ratio. Fade durations statistics has been found to be dependant on how data are filtered. In particular the filtering leads to an unnecessary complexity whereas the analysis of unfiltered data yields a simple power law.
REFERENCES
[1] T. Marsault, L. de Montera, J.D. Hermant, J.C. Penn, L. Barthes, C. Mallet, P. Golé : "EHF propagation experiment with Syracuse 3 satellite: first results", Proceed. of the European Conference on Antennas and Propagation (EUCAP), Ediburgh, UK, November 2007. [2] De Montera Louis, C. Mallet, L.Barthès and P. Golé "Short-term
prediction of rain attenuation level and volatility in Earth-to-Satellite links at EHF band. Nonlin. Processes in Geophys, 15, 631-643 [3] ITU-R 618-9, International Telecommunication Union
Radiocommunication Bureau, Geneva, 2007.
[4] Mallet, C.; L. Barthès, Validation of a neural network model for the separation of atmospheric effects on attenuation, EUCAP 2006, Nice. [5] Barthès L., C. Mallet; O. Brisseau., A Neural network model for the
separation of atmospheric effects on attenuation: Application to frequency scaling, Radio Science, volume n°41, doi:10.1029/ 2005RS003310, 2006.
[6] O. Brisseau, C. Mallet, L. Barthes, Frequency Scaling of rain attenuation based on microphysical characteristics for SatCom link, IEE Proc. Microwaves, Antennas & Propagation, Dec. 2006,Vol 153, Issue 6, p 523-532.
[7] Liebe H.J.: MPM - An atmospheric millimeter-wave propagation model, Int. J. Infr. Mill. Waves 10, 631-650, 1989
[8] ITU-R P. 1623, “Prediction method of fade dynamics on Earth-space paths”, ITU, Geneva, Switzerland, 2003.
[9] A.D. Rocha, R. Teixeira and J. Neves, One Year Fade Dynamics Statistical Results for an Earth-Satellite Path at 20GHz, COST Action 280, Propagation Impairment Mitigation for Millimetre Wave Radio Systems, 3rd International Workshop, June 2005.
[10] Balázs Héder, Róbert Singliar, and János Bitó, Fade Dynamics Investigation applying Statistics of Fade Duration and Level Crossing Rate, Proceedings of World Academy of Science, Engineering and technology, vol. 7 august 2005, ISSN 1307-6884.