Detection of Exocometary CO within the 440
Myr Old Fomalhaut Belt: A Similar CO+CO₂ Ice
Abundance in Exocomets and Solar System Comets
The MIT Faculty has made this article openly available.
Please share
how this access benefits you. Your story matters.
Citation
Matrà, L. et al. “Detection of Exocometary CO Within the 440 Myr
Old Fomalhaut Belt: A Similar CO+CO₂ Ice Abundance in Exocomets
and Solar System Comets.” The Astrophysical Journal 842, 1 (June
2017): 9 © 2017 The American Astronomical Society
As Published
http://dx.doi.org/10.3847/1538-4357/aa71b4
Publisher
IOP Publishing
Version
Final published version
Citable link
http://hdl.handle.net/1721.1/112147
Terms of Use
Article is made available in accordance with the publisher's
policy and may be subject to US copyright law. Please refer to the
publisher's site for terms of use.
12
Astronomy Technology Centre, Royal Observatory Edinburgh, Blackford Hill, Edinburgh EH9 3HJ, UK
13
School of Physics and Astronomy, University of Leeds, Woodhouse Lane, Leeds, LS2 9JT, UK
14
Steward Observatory, University of Arizona, 933 North Cherry Avenue, Tucson, AZ 85721, USA Received 2017 January 24; revised 2017 May 7; accepted 2017 May 8; published 2017 June 7
Abstract
Recent Atacama Large Millimeter/submillimeter Array observations present mounting evidence for the presence of exocometary gas released within Kuiper Belt analogs around nearby main-sequence stars. This represents a unique opportunity to study their ice reservoir at the younger ages when volatile delivery to planets is most likely to occur. We here present the detection of CO J=2-1 emission colocated with dust emission from the cometary belt in the 440 Myr old Fomalhaut system. Through spectrospatial filtering, we achieve a 5.4σ detection and determine that the ring’s sky-projected rotation axis matches that of the star. The CO mass derived (0.65 42 ´10-7M
Å
( – ) ) is the lowest of any circumstellar disk detected to date and must be of exocometary origin. Using a steady-state model, we estimate the CO+CO2mass fraction of exocomets around Fomalhaut to be
between 4.6% and 76%, consistent with solar system comets and the two other belts known to host exocometary gas. This is thefirst indication of a similarity in cometary compositions across planetary systems that may be linked to their formation scenario and is consistent with direct interstellar medium inheritance. In addition, we find tentative evidence that 49( 27)% of the detectedflux originates from a region near the eccentric belt’s pericenter. If confirmed, the latter may be explained through a recent impact event or CO pericenter glow due to exocometary release within a steady-state collisional cascade. In the latter scenario, we show how the azimuthal dependence of the CO release rate leads to asymmetries in gas observations of eccentric exocometary belts.
Key words: circumstellar matter – comets: general – molecular processes – planetary systems – stars: individual (Fomalhaut A) – submillimeter: planetary systems
1. Introduction
Icy comets originating from the Kuiper Belt or the Oort cloud are believed to be the most pristine bodies in our own solar system, relics of the environment where the planets formed and evolved (see Mumma & Charnley 2011, and references therein). The unambiguous detection of exocome-tary volatiles in extrasolar debris disks, young Kuiper Belt analogs around main-sequence stars, has recently given us the opportunity to expand such compositional studies to planetary systems beyond our own. Crucially, these volatile-bearing systems are observed at a very dynamically active phase of evolution (ages of about tens of megayears), when terrestrial planet formation is at its final stages and volatile delivery is most likely to take place(Morbidelli et al.2012, and references therein). Moreover, a comparison of volatile compositions in systems across a range of ages and host-star properties may yield important clues on the formation of these belts within the protoplanetary disk(for a review, see Wyatt et al.2015).
Compositional studies of volatiles in exocometary belts have been carried out in terms of elemental abundances from
observations of daughter atomic species(as done in β Pictoris, e.g., Roberge et al.2006; Brandeker et al. 2016). In addition,
metallic gas originating from sublimation or collisional evaporation of refractory elements has been detected and characterized in a few systems (e.g., Redfield 2007; Nilsson et al. 2012; Hales et al. 2017). More recently, we have also
been able to use observations of CO gas emission at millimeter wavelengths, where this is likely produced either as a parent molecule or through the photodestruction of CO2 (Dent
et al. 2014; Matrà et al. 2015, 2017; Marino et al. 2016).
While detection of exocometary parent molecules is the most direct route to the composition of exocometary ices, it is challenging due to the generally short survival timescale of gas molecules against stellar and interstellar UV photo-dissociation. This means that detection(so far limited to the CO molecule) has only been achievable with the extreme increase in sensitivity brought by the Atacama Large Millimeter/ submillimeter Array (ALMA). On the other hand, atomic daughter products from molecular photodestruction are long-lasting (e.g., Fernández et al. 2006; Brandeker 2011; Kral et al.2017) and may viscously expand over time to form an
atom-dominated accretion disk, a picture that is consistent with all far-infrared and millimeter observations of exocometary gas in theβ Pictoris system to date (Kral et al.2016).
The nearby(7.7 pc, van Leeuwen2007), 440±40 Myr old
(Mamajek2012), A3V (Gray & Garrison1989) star Fomalhaut
is the 18th brightest star at visible wavelengths beyond our own Sun. The star hosts a planetesimal belt producing dust first detected through its excess emission above the stellar photo-sphere at infrared wavelengths (e.g., Aumann1985) and later
imaged in thermal (Holland et al. 1998, 2003) and scattered
(Kalas et al.2005,2013) light. These revealed that the belt is
confined to a ring of ∼15 au width at a distance of ∼140 au from the star, and that it has a significant eccentricity of ∼0.1. The latter causes pericenter glow at infrared wavelengths, due to material being significantly closer to the central star with respect to the apocenter, causing it to be hotter and brighter (Wyatt et al. 1999; Stapelfeldt et al.2004; Marsh et al. 2005; Acke et al. 2012). This eccentricity and the sharpness of the
belt’s inner edge were attributed to a shepherding planet-mass companion(Kalas et al. 2005). The subsequent Hubble Space
Telescope (HST) discovery of the very low mass companion Fomalhaut b (Kalas et al.2008) appeared consistent with the
hypothesis that a planet could sculpt the inner edge (Quillen 2006; Chiang et al. 2009), until further observations
showed that Fomalhaut b’s orbit is highly eccentric (Kalas et al.
2013; Beust et al. 2014; Pearce et al.2015). The existence of
Fomalhaut b has been independently replicated (Currie et al. 2012; Galicher et al. 2013), but its physical properties
continue to be investigated (Marengo et al.2009; Kennedy & Wyatt 2011; Janson et al. 2012, 2015; Kenyon et al. 2014; Tamayo2014; Kenyon & Bromley 2015; Lawler et al.2015; Neuhäuser et al. 2015).
ALMA 850μm imaging of part of the belt (near the northwest(NW) ansa) confirmed the steepness of the inner and outer edge of the parent body distribution (Boley et al.2012).
Further, higher resolution 1.3 mm imaging(White et al.2017),
though only covering the region along the ring’s minor axis, tightened the constraints on the ring’s width, as well as confirming the slope of the size distribution previously obtained through Australian Telescope Compact Array 7mm observations (Ricci et al. 2012). However, only complete
millimeter imaging of the ring can constrain its azimuthal morphology and eccentricity. We achieved the latter through a new 1.3 mm mosaic obtained with ALMA and described in MacGregor et al. (2017); in particular, we confirm that
the geometry of the parent body ring resembles that of the smaller grains, and we achieve the first conclusive detection of apocenter glow, caused by the higher surface density expected at apocenter with respect to pericenter, due to particles on eccentric orbits spending more time at apocenter (Pan et al.2016).
In parallel to the latest observations of the dust ring, recent deep searches for molecular CO J=3-2 emission around the belt’s NW ansa at 345 GHz with ALMA (Matrà et al.2015), as
well as searches for atomic ionized carbon (CII) and neutral
oxygen (OI) through far-infrared Herschel spectroscopy
(Cataldi et al.2015), yielded null results. The CO nondetection
was used to set an upper limit to the CO ice content in the planetesimals, but this was still consistent with(and close to the upper boundary of) the range of CO abundances observed in solar system comets. On the other hand, the nondetection of atomic gas, tracing the bulk of the gas in an exocometary origin
scenario, was used to derive a low upper limit to the gas/dust ratio; being well below 1, this ruled out gas–dust interactions as the origin for the narrow eccentric ring in the Fomalhaut system.
In this work, we present deeper ALMA CO J=2-1 observations of the entirety of the Fomalhaut belt, yielding thefirst detection of gas in the system. In Section2we describe the observations, focusing on the CO imaging procedure. A description of the detection through the spectrospatialfiltering techniquefirst applied in Matrà et al. (2015) is in Sections3.1
and 3.2, followed by the constraints this detection sets on the ring’s rotation axis (Section 3.2) and total CO mass
(Section 3.3) and the consistency of the detection with the
previous observation of the CO J=3-2 transition (Section3.4).
Finally, we analyze the radial and azimuthal morphology of the CO emission(Section3.5).
We then go on to discuss the implications of this result, including proving the exocometary origin of the gas (Sections 4.1–4.3), drawing the first comparison between the
ice content of extrasolar and solar system comets(Section4.4),
and discussing the possible origin of the observed similarity with a particular emphasis on interstellar medium (ISM) volatile inheritance (Section 4.5). At the same time, we
investigate the possible cause of the tentative CO enhancement observed at the belt’s pericenter, focusing on a general prediction of CO pericenter or apocenter glow in eccentric exocometary belts such as Fomalhaut (Section 4.6). We
conclude by summarizing the outcomes of this study in Section5.
2. Observations
We observed the Fomalhaut belt with the ALMA array using Band 6 receivers, allowing simultaneously a wide bandwidth for 1.3 mm dust continuum imaging and a native spectral resolution of 1.27 km s−1around the rest frequency of the CO J=2-1 transition (230.538 GHz). The observational setup and the calibration, data reduction, and continuum imaging processes are described in detail in MacGregor et al. (2017).
Within the spectral window containing the CO line, we carried out continuum subtraction on the combined visibility data set using theuvcontsub task within the CASA software package (version 4.5.2, McMullin et al.2007). We image the visibility
data set using the CLEAN task. We do not apply any image deconvolution, but carry out our analysis(next section) on the primary beam-corrected dirty CO data cube. To enhance detectability of low CO surface brightness, we apply a taper within CLEAN to achieve an imaging resolution that better matches the width of the ring(2. 36 ´ , as opposed to the2. 13 1. 52 ´ 1. 12 resolution achieved from natural visibility weights). These imaging steps should not affect our results significantly compared to using the visibilities directly, since our u-v coverage yields a well-behaved dirty beam with little sidelobe emission, never above the∼4% level. Our final data cube has a root mean square (rms) noise level of 0.7 mJy beam−1 in a 1.3 km s−1 channel for a beam size of 18.2´16.4 au at the distance of the Fomalhaut system. The expected systematicflux calibration accuracy is of order ∼10% (Fomalont et al.2014).
3. Results and Analysis
3.1. Spatial Filter: CO J=2-1 Detection
Figure1(top right) shows the CO J=2-1 moment-0 map of
the Fomalhaut ring, spectrally integrated within±3.5 km s−1 around the expected radial velocity of the star(v,LSR=5.8 0.5 km s−1; Gontcharov 2006). No statistically significant
emission is observed above a noise distribution that is well approximated by a Gaussian and that has an rms of 4 mJy km s−1 beam−1. The few 3–4σ peaks observed are in line with the expectation from the Gaussian noise distribution and the large number of resolution elements in the image. The contour lines indicate the sky region where continuum emission is detected above the 4σ level (MacGregor et al. 2017),
corresponding to an area comprising a number of beams of
Nbeams~40. As done for previous Band 7 CO observations of the Fomalhaut system(Matrà et al.2015), we now proceed by
assuming that any CO present in the system should be of secondary origin and colocated with the dust from which it is produced, and later on we test these assumptions(Sections3.5
and 4.1). This allows us to apply a spatial filter, that is, to
spatially integrate the CO data cube over this region where the continuum is detected, yielding an improvement on the signal-to-noise ratio(S/N) equal to Nbeams ~6.4. The obtained 1D
spectrum, shown in Figure1 (left), presents a 3.3σ peak at a
velocity consistent with the expected v,LSR.
3.2. Spectral+ Spatial Filter: S/N Boost and Kinematics In order to test the robustness and improve the significance of the detection, we make the further assumption that the CO gas lies in a verticallyflat disk in Keplerian rotation around a star of 1.92 Me, with the same orbital parameters as the dust ring, obtained from dust continuum imaging (MacGregor et al.2017) and consistent with scattered light imaging (Kalas
et al. 2013). Then, for each pixel location x( sky,ysky), where
0, 0
( ) is the accurately known location of the star(detected in the continuum data set), we can determine the expected radial velocityfield v xz( sky,ysky) of the gas, both for the case in which
the NW ansa is moving away from us(Figure1, center right) or toward us (Figure 1, bottom right). Using this predicted velocityfield, we apply a spectral filter; that is we shift the 1D spectrum at each x( sky,ysky) pixel location by - (v xz sky,ysky),
moving any CO emission from the predicted disk velocity to the stellar velocity v,LSR. If we then sum together the
contributions from all pixels where the dust continuum is detected(or in other words, if we apply the spatial filter), we obtain a spectrum that is free from noise originating from spectral channels as well as spatial locations where no CO
Figure 1.CO J=2-1 (nrest=230.538GHz) spectra of the Fomalhaut system obtained using different filtering techniques to achieve maximum S/N. Top: spectrum obtained through a spatialfilter, by spatially integrating emission over the area where the dust continuum from the ring is detected at a level 4s> (shown by contours overlaid on the moment-0 image displayed on the right). Center: spectrum obtained by applying a spectrospatial filter. The same spatial filter as above is applied after shifting the 1D spectrum at each spatial location by an amount equal to the opposite of its expected Keplerian radial velocity(see corresponding velocity map on the right). Bottom: spectrum obtained by applying the same spectrospatial filter, but assuming a reversed velocity field, with the NW ansa coming toward us (again, see corresponding velocity map on the right). A 3.3s peak at a velocity consistent with that of the star (gray shaded region) is obtained using the spatial filter (top) and is boosted to 5.4s using the spectralfilter with the NW ansa moving away from us (center). The red shaded region is the spectrally unresolved Gaussian that best fits the filtered data.
emission is expected. As shown in Figure1(center left, for the
velocityfield in center right), this method boosts the S/N of the peak to 5.4s.
The spectral filter yields kinematic information on the orbiting gas, since the S/N of the CO line is maximized only for the correct velocity field. This is because, for an incorrect velocity field, the spectral filter spreads CO emission over a larger number of velocity channels, reducing the S/N (see Figure1, bottom left and right). This proves that CO gas in the NW ansa is moving away from us, while gas in the southeast (SE) ansa is coming toward us (Figure 1, center right). This is consistent with the kinematics of the star, whose SE part was also found to be moving toward us (Le Bouquin et al. 2009).
We note that this information is still insufficient to derive the sense of rotation of the ring on-sky (clockwise or counter-clockwise), and in turn which side of the ring is closer to Earth and forward scattering(see discussion in Min et al.2010; Kalas et al. 2013). This is because both the star and the CO only
inform us on the sky-projected rotation axis, which is perpendicular to the sky-projected major axis of the ring and points in the northeast (NE) direction. However, the crucial missing piece of information is whether the ring’s rotation axis is pointing toward us(i.e., inclination of~+ to the plane of65 the sky) or away from us (~- inclination). Therefore, the65 current data are insufficient to determine whether the ring is rotating in a clockwise or counterclockwise direction on-sky, and whether the brighter NE side observed by HST is in front of or behind the sky plane.
3.3. Total Flux and CO Mass
In order to measure the integrated CO J=2-1 line flux and the velocity centroid, wefit a Gaussian to the spectrospatially filtered spectrum derived above and shown in Figure1(center
left). The best-fit Gaussian width is consistent with the line being unresolved, as expected from the application of our filtering method, and the best-fit velocity is 6.1±0.2 km s−1,
consistent with the expected stellar velocity of 5.8± 0.5 km s−1. The best-fit integrated line flux is 68± 16 mJy km s−1 (including the absolute flux calibration uncer-tainty, added in quadrature to the uncertainty from the Gaussian fit), or 5.2( 1.2)´10-22Wm−2.
Assuming that the CO is optically thin to the line of sight at the observed frequency (which we verify in the next paragraph), we use a nonlocal thermodynamic equilibrium molecular excitation analysis (Matrà et al. 2015) to derive
constraints on the total CO mass in the system. The derived mass value depends on two unknown parameters, the kinetic temperature of the gas and the density of the main collisional partners. We take the main colliders to be electrons, since these are most likely to be the dominant species for which CO collision rates are known if the gas is of exocometary origin (Matrà et al. 2015). We cover the full electron density
parameter space between the radiation-dominated and local thermodynamic equilibrium regimes, and we probe a wide range of kinetic temperatures between 10 and 1000 K. The CO mass derived is in the range 0.65 42 ´10-7M
Å
( – ) , where the boundaries were obtained from the1slimits on the integrated line flux. This is the lowest CO mass detected in any circumstellar disk to date, which is readily understood by noting that Fomalhaut, at a distance of 7.7 pc, is the nearest circumstellar disk where CO has been searched for by ALMA
to date. We will discuss the implication of this mass measurement in Section4.1.
We note that the CO excitation model does not yet account for the effect of infrared or UV pumping, that is, transitions between vibrational and electronic levels within the molecule. These are excited in the presence of a strong infrared or UV radiation field, as may be the case around an A star such as Fomalhaut. As molecules relax to the ground electronic or vibrational levels, higher rotational levels may be more populated than predicted through CMB radiation alone, affecting the rotational level populations. Nonetheless, this would only influence the molecule in the radiation-dominated regime, or in other words it would only change our upper limit on the derived range of CO masses. Since less mass would be needed to produce the sameflux in the presence of significant UV/IR pumping, our derived CO mass range can be taken as a conservative estimate and is likely narrower than derived above.
We now carry out a check to probe the optical thickness of the CO line. We assume that the CO density is uniform in a disk with inner radius at R=136.3 au and D =R 13.5 au wide, with a constant aspect ratio h=H/R (height above the midplane divided by the radius) equal to the best-fit mean proper eccentricity of the planetesimals from continuum observations(0.06, MacGregor et al.2017). This way, we can
derive the ring volume and hence measure an average CO number density for our range of CO masses, obtaining a range of number densities in the range ( –2 75)´10-2 cm−3. We
then estimate the maximum column density using the longest path length along the line of sight passing through our simple model ring described above. We neglect any column density enhancement expected at the two ansae due to projection effects (see Section4.6). For the range of number
densities above, this yields maximum column densities of 0.04 1.67 ´1014
( – ) cm−2 for a maximum line-of-sight path length of∼15 au. Finally, we calculate the maximum optical thickness through its definition (Equation (3) in Matrà et al.
2017) for the full range of electron densities and kinetic
temperatures probed above, and for an intrinsic line width taken to be equal to the Doppler broadening expected from each of the temperatures considered. The maximum, worst-case-scenario optical thickness we obtain is t0.18 (with values ranging down to 10−4 depending on the parameters), which confirms our optically thin assumption and our CO mass measurement.
3.4. Consistency with Archival Band 7 Observations We now check that our detection of the CO J=2-1 line is consistent with the CO J=3-2 upper limit available from previous ALMA Band 7 observations(Matrà et al.2015). For a
well-characterized millimeter radiationfield such as that around Fomalhaut (see Figure 3 in Matrà et al. 2015), line ratios of
optically thin molecular transitions only depend on two free parameters determining the level populations of the upper level of each transition. These are the gas kinetic temperature Tkand
the density of collisional partners ne-. Taking our J=2-1
integrated lineflux of 5.2( 1.2)´10-22 Wm−2 and the 3σ
upper limit of 18×10−22Wm−2on the J=3-2 line flux from Matrà et al. (2015), we obtain an upper limit on the average
3-2/2-1 line ratio in the Fomalhaut ring of 3.5 or 6.7, depending on whether we consider our J=2-1 measurement or its 3σ lower limit. This line ratio upper limit of 3.5 in
Fomalhaut will therefore trace a line in Tk–ne-space(Figure2),
the latter two quantities being degenerate. For comparison, we show the average line ratio measured in the β Pictoris disk (Matrà et al. 2017). While strictly speaking we can only
exclude 3-2/2-1 line ratios higher than 6.7, we find that the archival nondetection of the J=3-2 transition is in agreement with a β Pictoris-like gaseous environment (average line ratio of 1.9± 0.3) and fully consistent with the new J=2-1 detection. While this is purely a consistency check, we remind the reader that there is no reason to assume that the electron density or CO excitation conditions in the Fomalhaut belt should be the same as aroundβ Pictoris. Furthermore, we note once again that the introduction of UV/IR pumping in our model may influence Figure 2 by increasing the minimum possible line ratio in the radiation-dominated regime of excitation (left-hand side in the figure).
3.5. Radial and Azimuthal Morphology
In order to extract information on the spatial distribution of CO, we relax the assumption that it must be colocated with the dust millimeter continuum. In particular, we apply the spectral filter method to the entire data cube, shifting spectra in each spatial pixel to align CO emission with the stellar velocity. Instead of spatially integrating across the area where the continuum is detected, we examine the channel map corresp-onding to the stellar velocity (as shown in Figure 3). As
expected, due to spatial dilution of the emission, no obvious significant emission is seen along the whole dust ring. For a given semimajor axis in the ring’s orbital plane, taking once again the orbital parameters from dust continuum fitting, we can obtain a sky-projected orbit, and we average all azimuthal contributions along it to obtain an intensity profile as a function of ring semimajor axis. The black line in Figure 4 shows the semimajor axis profile between 50 and 220 au obtained by
azimuthally averaging around all true anomalies, showing a CO detection at the semimajor axis and width consistent with the dust continuum ring. This confirms that CO is indeed colocated with dust in the Fomalhaut belt.
Finally, we test for any indication of azimuthal asymmetry in the CO emission. To begin with, we construct the same
Figure 2. Color map of the CO J=3-2/J=2-1 line ratios expected for a wide range of kinetic temperatures Tk and electron densities ne-. The
disk-averaged upper limit we estimate in the Fomalhaut belt is consistent with the value found for theβ Pic disk, implying that similar excitation conditions in the two disks are still possible and explaining the CO J=3-2 Fomalhaut nondetection in Matrà et al.(2015).
Figure 3.The color scale shows the CO S/N map obtained after spectral filtering. For each pixel, given some orbital parameters (see main text), emission from the velocity channel corresponding to the expected Keplerian velocity is shown. The thin white contours represent regions where the dust continuum is detected above the 4σ level. Wedges of different colors represent regions used to obtain the radial profiles displayed through the same colors in Figure4. A significant enhancement is seen in the southern (S) wedge and is located near the best-fit pericenter location (plus sign) as determined from ALMA dust continuum imaging(MacGregor et al.2017).
Figure 4. Radial profiles obtained through azimuthal averaging of the spectrallyfiltered CO map. Lines of different colors show profiles averaged within each of the wedges in Figure3. The blue shaded region represents the
1s
confidence interval as a function of radius within the south wedge. This interval is similar for other wedges, not shown for clarity. The black line and gray shaded region(shifted vertically by −2 mJy beam−1per channel) are the same profile and confidence interval obtained through azimuthal averaging over all azimuths.
semimajor axis profile for each of six azimuthal regions, or “wedges,” as displayed through different colors in Figure 3. These profiles are shown by the corresponding colors in Figure 4. For a perfectly axisymmetric on-sky surface bright-ness distribution of the ring, due to averaging across only about one-sixth of the azimuths, we expect the S/N in each wedge to decrease by a factor of~ 6 =2.45compared to the profile averaged across all azimuths and to lie at the 1 2s– level. However, the majority of CO emission appears to originate from the south (S) wedge (blue), where CO is detected at the 6.2s level. The latter is also apparent in Figure3, where we see that this region of emission is located near the ring’s pericenter location, as determined by ALMA dust continuum fitting (w =22 . 5 , black cross in Figure4 . 3 3; MacGregor et al. 2017). We find that the flux in the S wedge contributes
to 49( 27)% of theflux integrated across all azimuths; given the low S/N levels, we cannot distinguish whether all of the emission originates from this wedge or whether other regions also contain CO emission, as however hinted at by the low levels of positive emission observed across all wedges.
To analyze this azimuthal variation in more detail, Figure 5
shows the azimuthal profile obtained by integrating emission between semimajor axes of 120 and 150 au for all true anomalies f. We recover the enhancement at pericenter (true anomaly f= ) and another 2.6s peak of emission at0
f~45, also evident in Figure 3. We then fit a cosine function to this azimuthal profile; this is a good representation of the expectation from our steady-state release model discussed in Section 4.3, for the case where a pericenter enhancement of the CO mass with respect to apocenter is predicted. We use Levenberg–Marquardt least-squares mini-mization to find the best-fit phase, mean intensity, and pericenter-to-apocenter intensity enhancement (1 -Iapo Iperi)
of our model cosine function. The phase obtained with respect to pericenter(20 25) is consistent with the model having a maximum near pericenter. The mean(0.68 ± 0.16 mJy beam−1 per 1.3 km s−1channel) being significantly different from zero is further confirmation of our detection at a level consistent with the radial profile in Figure 4, bottom, and with the spectrum in Figure 1, center left. This cosine fit leads to an
estimate of a pericenter enhancement with respect to apocenter of 88( 25)%. We will compare such an enhancement to model predictions in Section4.6.
4. Discussion
Through spectral and spatialfiltering applied to new ALMA observations, we detected low levels of CO J=2-1 emission colocated with dust in the Fomalhaut ring, and we measured the CO gas mass to be between 0.65 and42´10-7M
Å. We then
used line velocities to show that the ring’s sky-projected rotation axis points to the NE, matching that of the star; in other words, the SE ansa is moving toward us, and the NW away from us. Finally, we presented tentative evidence that most of the detected emission originates near the ring’s pericenter, as determined by ourfitting of the ALMA dust continuum image (MacGregor et al.2017).
In this section, we investigate the origin of the CO observed, proving its exocometary nature and discussing its origin in either a recent impact or a steady-state release. Then, we use a steady-state collisional cascade model to derive exocometary ice compositions. This allows us to compare Fomalhaut with other planetary systems, including the solar system, and to make the prediction of CO pericenter or apocenter glow in eccentric exocometary rings.
4.1. The Exocometary Nature of the Gas
The origin of gas remains to be found for most of the known gas-bearing debris disks. A primordial versus secondary origin dichotomy has emerged in the past years, due to the youth ( 40 Myr ) of the detected systems (see Section1). Aside from
a tentative detection of CO emission in the 1–2 Gyr old η Corvi system (Marino et al.2017), which is not colocated with the
outer dust belt and remains to be confirmed, Fomalhaut is the most evolved debris belt to host CO gas, at an age of (440 ± 40) Myr.
Can the observed CO have survived since the protoplanetary phase of evolution? CO survival requires shielding from the interstellar UV radiation field, which otherwise rapidly photodissociates the molecule on a timescale tphdof 120 years.
This shielding can be produced by CO itself and other molecules such as H2, where the latter dominates the gas mass
in the primordial origin scenario. In Section 3.3, through a simplified model, we estimated an average number density of CO in the ring of order( –2 75)´10-2cm−3. In this model, a
CO molecule sitting in the radial and vertical center of the ring will therefore have a CO column density of order 1012–1014cm−2 surrounding it and, assuming a low CO/H
2
abundance ratio of 10−6(similar to that found in the old TW Hya protoplanetary disk; Favre et al. 2013), a H2 column
density of order 1018–1020cm−2. Since these CO and H
2
column densities are insufficient to shield CO over the system’s lifetime(Visser et al.2009), we conclude that the observed CO
cannot have survived since the protoplanetary phase. We note that freeze-out onto grains is also negligible, due to the relatively low density of grains in the ring and their temperature being much above the CO freeze-out temperature(Matrà et al.
2015). The observed CO must therefore be of secondary origin,
that is, recently produced through either continuous, steady-state replenishment or a recent stochastic event. We analyze both possibilities below.
Figure 5.Radially integrated intensity between 120 and 150 au(blue line) as a function of true anomaly from the spectrallyfiltered CO map in Figure3. The shaded region represents the1sconfidence interval. The red line is the cosine function that bestfits the data; the red shaded region is the 1s interval of its best-fit mean, confirming our detection. The vertical thin gray lines are the locations of the on-sky ansae.
belt, alone, produced all of the observed CO mass.
However, this conclusion is subject to the assumption that bodies of the required 6.5´10-7M
Å mass for CO release,
which would be∼100 km in size, lose mass at the same rate as other bodies participating in the collisional cascade. This implicitly assumes an extrapolation of the size distribution from small, observable grains up to bodies of this size. Although ∼100 km is consistent with observations of the Kuiper and asteroid belts in the solar system (Bottke et al. 2005; Fraser et al. 2014), as well as other planetesimal growth models
(Johansen et al. 2015; Shannon et al.2016), it remains to be
determined whether such large bodies in the Fomalhaut belt exist and participate in the collisional cascade. If we extrapolate the power-law size distribution of Wyatt & Dent(2002) to large
sizes(n D( )µD2 3- qwith q=11 6, Figure 8 in their paper),
wefind that there should be 7×10⁷objects with this or larger mass within the Fomalhaut ring. Then, the collision timescale of one supercomet is ~1.0 3.8 Gyr– , which is longer than the ∼440 Myr age of the system. This indicates supercomets would have seldom collided over the age of the system, and their size distribution would therefore have been set by growth processes during planet formation, where the latter is completely unconstrained observationally. In addition, if the extrapolation of the size distribution to these sizes were valid, the total mass of the belt (∼0.4 Jupiter masses) would be ∼4 times higher than the 29 M⊕ that an initial minimum-mass solar nebula (MMSN) planetesimal disk would have had between 120 and 150au (Kenyon & Bromley2008). In general, these required
high belt masses challenge the validity of our extrapolation and point to a likely steeper size distribution for the large primordial bodies (as is the case for Kuiper Belt objects, e.g., Schlichting et al. 2013).
Overall, this caveat would make our estimated high collision rate for large bodies an upper limit. To conclude, it is therefore possible that the destruction of a large icy body released all the CO observed in the Fomalhaut ring, although a reasonable likelihood for this event to happen requires the Fomalhaut belt to be massive, of order of a few times higher than the expectation from an MMSN-like disk.
4.3. Origin of the Gas: Steady-state Release and Ice Composition
On the other hand, we can consider the total gas release expected from the steady-state collisional cascade in the framework described in Matrà et al.(2015) and already applied
MDmin.Assuming that all of the CO+CO2ice is lost through the cascade before reaching the smallest-sized grains(see discus-sion in next section), we have M˙CO CO+ 2=fCO CO+ 2M˙Dmax, meaning that we can measure the CO+CO2ice mass fraction in
exocomets fCO CO+ 2 through f M M 1 1 D . 1 CO CO CO CO 2 min 2 = + + + ˙ ˙ ( )
In a steady state, the outgassing rate of CO+CO2molecules
equals their destruction rate(where the latter is known) through
M˙CO CO+ 2=MCOobs tphd. Additionally, the mass loss rate M˙Dmin of CO+CO2-free particles at the small size end of the
collisional cascade can be estimated by considering the collision timescale of particles just above the minimum size in the distribution (Appendix B). The latter is well
constrained by observations and can be calculated as shown in Equation(21).
Overall, the CO+CO2ice mass fraction of exocomets can
therefore be estimated through
f R R f L M t M 1 1 0.0012 , 2 CO CO 1.5 1 2 0.5 phd CO1 2 obs = + D + - - - ( )
where R andD are in au, LR åand Måare in Leand M,tphdis
in years, and MCOobs in M⊕. The CO+CO2ice mass fraction in Fomalhaut is therefore in the range 4.6%–76% (taking the observed belt parameters quoted in AppendixB).
4.4. Comparison with Other CO-bearing Systems: An Overall Similarity to Solar System Comets
Our compositional measurement in exocomets within the Fomalhaut ring adds to the other two measurements of the CO +CO2exocometary ice mass fraction obtained through ALMA
observations of second-generation CO gas, β Pictoris (Matrà et al. 2017) and HD 181327 (Marino et al. 2016). For
consistency, we also apply our updated, more accurate estimation of the ice mass fraction presented here to these systems, using the same belt and stellar parameters as in the original works. We find that the CO+CO2 ice mass fraction
becomes<32%forβ Pictoris (using the 3σ upper limit on the CO mass) and in the range 0.8%–3.7% for HD 181327 (using the 1s range of the CO mass). These two systems both belong to the β Pic moving group at an estimated age of 23±3 Myr (Mamajek & Bell 2014) and are much younger
than Fomalhaut, but they nonetheless present compositions that are within an order of magnitude of one another(Figure6). For
example, the weak detection in Fomalhaut compared toβ Pic is easily explained by the fact that Fomalhaut is much less collisionally active. Indeed, the mass loss rate through the cascade is 20 times higher for the β Pictoris disk, and the higher amounts of CO also mean that some self-shielding takes place, increasing the photodissociation timescale by a factor of ∼2.5 (Matrà et al. 2017). Overall, for the same CO+CO2ice
content, this indicates that the CO gas mass would be at least 50 times higher in β Pic with respect to Fomalhaut, in agreement with the observations. On the other hand, we note that our new Fomalhaut measurement is at least marginally inconsistent with that in the HD 181327 debris ring, potentially suggesting an intrinsic difference in composition or gas release mechanism between these two systems.
Despite the rather large error bars on the measurements obtained so far, Figure 6 also shows that the CO+CO2mass
fraction in exocomets is consistent with that of solar system comets. A caveat to keep in mind in this comparison is that mass fractions in solar system comets are derived from measurements of the relative abundance of CO and CO2
compared to H2O. On the other hand, their
refractory-to-volatile mass ratio, required to derive the CO+CO2 mass
fraction, is only poorly(if at all) known, due to the difficulty in remote measurements of dust production rates. The only comet for which this is measured robustly in situ is comet 67P/ Churyumov–Gerasimenko (67P), where the dust-to-ice mass ratio is 4±2 in the coma (Rotundi et al.2015) and consistent
with(though not directly constrained by) density measurements of the interior of its nucleus(Pätzold et al.2016). We therefore
assumed all solar system comets to have an equal refractory-to-volatile mass ratio of 4, though note that this may be subject to scatter across comet families and individual objects.
Another underlying assumption is that we are using observation-based estimates of the gas production(outgassing) rates of CO and CO2(as well as H2O for solar system comets)
as a probe for their relative solid abundance; in other words, we are assuming that CO+CO2ice and refractories are removed at
rates that reflect their internal composition. In solar system
comets, linking outgassing rates in the comae and nuclei abundances depends not only on a comet’s distance from the star(as clearly seen, e.g., for Hale–Bopp; Biver et al.2002), but
also on its detailed thermal and structural properties(Marboeuf et al.2012). However, CO/H2O and CO2/H2O outgassing rate
ratios are generally measured near a comet’s perihelion, where the process is dominated by water sublimation, which carries along CO and CO2trapped within it. Then, for a comet with a
mostly homogeneous composition and dominated by clathrates (as shown to hold for 67P; Luspay-Kuti et al.2016), outgassing
ratios are expected to be a good representation of its ice abundance(see, e.g., Marboeuf & Schmitt 2014).
As with solar system comets, our exocometary abundance derivation also assumes that CO and CO2 ice, as well as
refractories, are released at rates that reflect their composition; in the context of our steady-state model, this is valid as long as two conditions apply:
1. No CO or CO2is removed as ice by way of the smallest
blow-out grains in the cascade, which is of order∼10 μm in the Fomalhaut belt(though it can vary depending on grain composition). In other words, these ices are only removed as gas. This applies if ices are completely lost further up the collisional cascade, that is, if either the sublimation or photodesorption timescale is shorter than the collision timescale for grains larger than the blow-out size. Taking as an example a pure water ice grain 20mm in size, the results of Grigorieva et al. (2007) can be
used to show that its photodesorption timescale is ∼13,700 years. On the other hand, its collisional lifetime is ∼4×10⁵years (Wyatt & Dent 2002), meaning that
water ice cannot survive on the surface of grains at the bottom of the collisional cascade. A similar argument applies for a pure CO2ice grain, whose photodesorption
timescale will be very similar to that of water, due to a similar photodesorption yield of ∼10−3 molecules photon−1 (Grigorieva et al.2007; Öberg et al.2009).
The next question is whether CO gas or CO2ice can
remain trapped within refractories all the way down to the smallest sizes in the cascade. Due to its low sublimation temperature(∼20 K), CO is trapped already in gas form at the blackbody temperature of a dust grain within the Fomalhaut belt(∼48 K), and for small grains at the bottom of the cascade, it is likely to diffuse through the refractory layer. On the other hand, CO2 has a higher sublimation
temperature of∼80 K (Collings et al.2004). The hottest
grains will be those near the blow-out limit (∼10 μm), which will have a temperature close to that observed in the spectral energy distribution (SED, ∼74 K; Kennedy & Wyatt2014). Further heating is likely to take place through
collisions themselves(e.g., with accelerated high-β grains, as proposed by Czechowski & Mann2007), increasing the
likelihood of CO2 sublimation and subsequent release
through diffusion. In conclusion, while further detailed modeling is necessary, we deem it very unlikely for any CO to be retained within grains down to the smallest sizes in the cascade, but on the other hand we cannot exclude that a fraction of CO2ice may instead be retained
within a refractory mantle. The latter would cause an underestimate of the CO+CO2exocometary mass fractions
presented here.
2. CO and CO2production is not dominated by resurfacing
collisions, which preferentially occur for large bodies at the
Figure 6. CO+CO2 mass fraction (%) in solar system comets where both
measurements are present(red, assuming a dust-to-ice ratio of ∼4 as measured in comet 67P; Rotundi et al.2015) and in exocometary belts observed so far
(blue, derived in the steady-state framework). The tick labels on the top x axis indicate the spectral type of the host star. Compositions were derived from Matrà et al. (2017) (β Pic), Marino et al. (2016) (HD 181327), this work
(Fomalhaut), and Le Roy et al. (2015) and references therein for solar system
comets. Shaded regions represent the ranges of mass fractions expected from direct inheritance of ISM compositions(assuming 100% CO trapping within comets and no grain surface chemistry), in the cases where comets formed outside (darker gray) or inside (lighter gray) the CO ice line within the protoplanetary disk.
comets). Overall, it remains to be established whether gas released through resurfacing collisions can dominate the released mass, though such a study is beyond the scope of this paper.
4.5. Possible Origins for This Similarity and Comparison to a Simple ISM Inheritance Model
We find that CO+CO2 mass fractions in exocomets are
similar to each other and are of the same order(within about an order of magnitude) as observed for solar system comets (Le Roy et al. 2015 and references therein). As shown in Figure6, this similarity appears to apply around host stars of a range of ages and spectral types. In terms of distance to the host star, exocometary gas is observed at 50–220 au around an 8.7 Le star(β Pic, Matrà et al.2017), ∼81 au around a 3.3 Lestar(HD 181327, Marino et al.2016), and ∼135 au around a 16.6 Lestar (this work, stellar luminosity from SED fit in Kennedy & Wyatt
2014). Assuming blackbody-like bodies, the equilibrium
temp-erature in these belts would be equivalent to distances of 17–75, 45, and 33 au from the Sun in the solar system, meaning that the temperature of these exocomets should be of the same order as observed for the solar system’s comet reservoir in the Kuiper Belt (30–50 au; e.g., Stern & Colwell 1997). Then,
similar compositions and temperature environments for comets may indicate similar comet-formation conditions in younger protoplanetary disks, including the solar nebula.
Another aspect to consider is whether these cometary fractions of mass locked in CO and CO2 are globally
representative of the chemical heritage from the ISM (see Pontoppidan et al. 2014 for an extensive discussion of such inheritance). In the ISM, we know that the [CO/H2] abundance
ratio in the gas is of order 10−4, where H2dominates the gas
mass, and the gas/dust ratio is of order ∼100. This yields a
MCO gas,ISM Mtotal,solids,ISM~14%. On the other hand, the CO abundance in ISM ices is in the range [CO/H2O]ice,ISM
∼ 9%–36% compared to H2O(Mumma & Charnley2011, and
references therein). The CO2 content is dominated by its ice
phase(e.g., van Dishoeck et al.1996), with a [CO2/H2O]ice,ISM
abundance of ∼15%–44% (again, see Mumma & Charn-ley2011and references therein). This means that ISM material that is accreted in the outer regions of the protoplanetary disk will contain CO+CO2 already in the ice form, with
MCO CO ice,ISM+ 2 MH O ice,ISM2 ~0.51 1.64– , and CO in the gas form, with MCO gas,ISM Mtotal,solids,ISM~0.14.
M M 1 1 1 1 4 M M M M CO CO ,ice ISM total,solids comet comet ISM 1 2 dust ice CO CO2,ice H2O,ice = + + + -+
(
)
( )
( ) ( ) ( ) and M M 1 1 . 5 M M CO,gas ISM total,solids comet ISM 1 CO,gas total,solids = +(
)
-( ) ( ) ( )Given CO gas and CO+CO2 ice abundances in the ISM,
assuming a range of dust-to-ice ratios between the1s values measured in comet 67P, we obtain an expected CO+CO2
cometary mass fraction of ∼17%–33% (darker shaded region in Figure6). The growth of grains to comet-sized bodies allows
CO ice originally on grain mantles to become trapped in other ices and refractories; this ensures that CO (and thus the CO +CO2 mass fraction derived) can be retained once the
protoplanetary disk is dispersed and the CO ice line moves farther out than the cometary belt location.
In the second formation scenario, where the cometary belt formed inside the CO ice line in the protoplanetary disk, no extra CO from ISM-like gas would be incorporated in the ice phase; this would imply a CO+CO2cometary mass fraction of
∼5%–21% (lighter shaded region in Figure 6). As well as
assuming that all of the CO can remain trapped within other ices or refractories inside its ice line, this simplified evolutionary model ignores any grain surface chemistry, which is likely ongoing through the ISM, protoplanetary, and cometary phases of evolution. We expect that such chemistry will act to deplete the CO and CO2ice abundances, creating not
only more complex volatiles (which are not dominant in cometary ice), but also organic refractories. Strictly speaking, we should therefore consider these ranges as upper limits to the CO+CO2 cometary mass fractions derived in this ISM
inheritance model.
While the large error bars in the solar system and exocometary measurements do not allow us to draw significant conclusions with regard to enhancement or depletion compared to ISM-inherited abundances, we show that such a comparison should be possible with increasingly accurate observations. For example, measuring the depletion of CO+CO2abundance with
respect to ISM-inherited values would allow us to estimate the amount of CO or CO2 that has been lost either due to
sublimation during or immediately after dispersal of the protoplanetary disk (due to consequent outward movement of the CO ice line location) or due to grain surface chemistry and production of more complex organics. As well as achieving more accurate measurements over a larger sample of exo- and solar system comets, pinpointing the formation location of cometary belts within the protoplanetary disk with respect to the CO ice line will be crucial in allowing us to distinguish between the two possible ranges of ISM-inherited abundances discussed above.
4.6. Pericenter/Apocenter Glow of CO Released from a Steady-state Collisional Cascade
In Section 3.5 we presented tentative evidence of an enhancement in CO emission near the planetesimal belt’s pericenter. Here, we examine its possible physical origin in the framework of our steady-state model described in Section 4.3. Once again, we assume that the CO gas produced is a fraction of the solid mass lost as part of a steady-state collisional cascade, giving us access to the CO+CO2ice abundance. The
total solid mass loss rate M D˙ ( ) is calculated by multiplying the mass Msolid( ) in any given size bin with the collision rateD Rcol( ) of bodies in that size bin.D
In AppendixA, we quantify how this mass loss rate within an eccentric cometary belt depends on the true anomaly f, for two possible regimes of grain sizes releasing CO. For the small grains, under the condition D<Dmin( 0.5 vrel Q
2
D1 3
) , wefind that the collision rate is independent of the true anomaly; this in turn means that the mass loss rate should be enhanced at the apocenter due to the expected enhancement in solid mass at this location(due to particles spending more time there). For larger grains(D>Dmin( 0.5 vrel2 QD)1 3), the azimuthal dependence
of the mass loss rate is set by six parameters, namely the slope of the size distribution in the collisional cascade q, the mean proper eccentricity of material orbiting within the belt ep, the
stellar mass M, the belt semimajor axis a, the forced
eccentricity of the belt efrc, and the specific incident energy
required for a catastrophic collision, QD. For the case of the
Fomalhaut belt, we have observational constraints on q ~1.83 (Ricci et al.2012, where we assume it to be independent of true anomaly), M~1.92Me(Mamajek2012), a~136.3 au, and
efrc~0.12(MacGregor et al.2017), meaning that our only free parameters are the mean proper eccentricity epand the specific
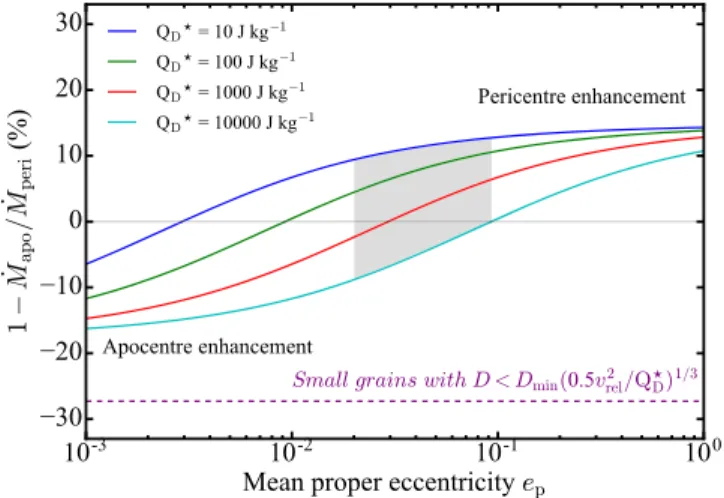
strength QD of the planetesimals. We can then quantify the fractional difference in mass loss rate at pericenter with respect to apocenter (1-M f˙ ( =180) M f˙ ( = 0 )) using Equations (12) and (13) in Appendix A, shown for a wide range of ep and QD values in Figure7.
As expected, for low proper eccentricities and high planetesimal strengths, the effect of a higher mass at apocenter dominates over the effect of easier collisional disruption at pericenter. Vice versa, for high proper eccentricities and low planetesimal strengths, we see a pericenter enhancement in the mass loss rate due to the effect of easier collisional disruption at pericenter dominating over the effect of having a higher mass at apocenter. The upper and lower horizontal asymptotes of the curves correspond to the limits ep0 and ep ¥ as
calculated by setting efrc=0.12 in Equations (14) and (15) (Appendix A) and are independent of both ep and QD. This
implies a ∼15% maximum pericenter-to-apocenter enhance-ment in the mass loss rate of the Fomalhaut belt. For the1s range of proper eccentricities derived from continuum imaging
(MacGregor et al. 2017) and QD values in the range 10–10,000 J kg−1, expected for weak ice grains of a wide range of sizes within the collisional cascade (Wyatt & Dent
2002; assuming the results of Benz & Asphaug 1999), we
predict the fractional difference in mass loss rate between pericenter and apocenter in the range−9% to 12%. Then, given that the CO photodissociation rate is independent of true anomaly, and assuming that the CO+CO2ice fraction is too,
the steady-state mass loss rate enhancement at pericenter directly translates into a CO mass enhancement.
Whether a CO mass enhancement translates into a COflux enhancement at pericenter/apocenter, or in other words CO pericenter/apocenter glow, also depends on the excitation of the CO molecule (see Section 3.4), and particularly on the
radial dependence of the gas kinetic temperature and electron density. This is because for example in Fomalhaut, CO emitted at the ring’s pericenter will be closer to the star than the CO at apocenter, by a factor of(1+e) (1 -e)~1.27. Making the simple assumption of a β Pic-like environment for CO excitation, with an electron density varying with radius as
R
300 100 au 1
~ ( )- cm−3(Matrà et al.2017), the expected flux
at pericenter would be 2.5%–6.1% larger than that at apocenter, making the CO flux enhancement even larger than expected from a mass enhancement only. Therefore, we expect excitation effects to favor a COflux enhancement at pericenter. We cautiously note that such a contribution from CO excitation will depend on the gaseous environment of the Fomalhaut belt; this may significantly differ from that of β Pic, though it may be characterized in the future using optically thin line ratio observations.
Finally, we need to take into account projection effects due to the viewing geometry; in particular, the observed pericenter-to-apocenter ratio will depend on the combined effect of the ring’s vertical thickness, its inclination to the line of sight, and the on-sky angular distance between the ring’s pericenter and the nearest ansa. This is because the azimuthal intensity distribution for a significantly inclined ring with a
Figure 7.Solid mass loss rate(and hence CO mass) enhancement predicted at pericenter with respect to apocenter in the Fomalhaut ring, for CO released by small grains of sizes D<Dmin( 0.5 vrel2 QD)1 3(purple dashed line), or by
larger grains of sizes D>Dmin( 0.5 vrel2 QD)1 3(colored solid lines). In the
larger size regime, given the observationally constrained M, , ,q a efrc (see
text), the enhancement is only a function of the unknown proper eccentricity ep
of the planetesimals and of their threshold specific strength needed for catastrophic collisions QD. The shaded region represents a wide range of QDas
explored by Wyatt & Dent(2002) and the 1s interval of epobtained from
nonnegligible vertical thickness should present two enhance-ments at the location of the two ansae(see Marino et al.2016
for the dependence of the azimuthal intensity distribution on a ring’s scale height). To fully take this effect into account and demonstrate its impact on the measured pericenter or apocenter glow, we produce a simple model of CO in the Fomalhaut ring and produce a sky-projected model image using the RADMC-3D15
radiative transfer code. In doing this, we first construct an eccentric CO ring model with radial mass distribution, inclination to the line of sight, position angle, forced eccentricity, and argument of pericenter equal to those of the dust ring. Then, we introduce the dependence of the CO surface density on the true anomaly as described above and derived in Appendix A. We assume the maximum possible pericenter versus apocenter CO mass enhancement for the best-fit ep~0.06 from the continuum observations, corresponding to ∼12% (for a QD of 10 J kg−1). Furthermore, we make the
simple assumptions that the gas kinetic temperature is equal to the blackbody temperature of the planetesimals and that the electron density follows the same radial dependence as found in β Pictoris.
In our model(see the spectrally integrated image in Figure8),
we assume a radially constant CO vertical aspect ratio equal to the average proper eccentricity of the planetesimals(h~0.06), but we also consider extreme cases of a very small aspect ratio (h~0.0001) and a larger one (h~0.14, corresponding to the 3σ upper limit found for the HD 181327 ring; Marino et al. 2016). We find that in the infinitesimally vertically thin
limit we recover the pericenter enhancement with respect to apocenter expected from our CO steady-state model from both
(Dent et al.2014), though this was recently ruled out through
higher-resolution observations(Matrà et al.2017).
Either way, a conclusive detection of this enhancement would allow us to determine the direction of orbital motion of the belt, and in turn whether its east or west side is nearest to Earth. This is because thefinite lifetime of CO (∼120 years in such an optically thin environment) would cause either a tail in the direction of motion(in case of a stochastic event; see, e.g., Dent et al.2014) or a ∼19° offset of the peak location (with
respect to pericenter/apocenter, also in the direction of motion) due to CO pericenter/apocenter glow. Therefore, future, deeper ALMA observations of pericenter and apocenter are warranted to confirm this tentative evidence for asymmetry.
5. Conclusions
This work presented observations of CO J=2-1 230 GHz emission in the Fomalhaut ring. Through spectrospatialfiltering of the ALMA data cube, we detected line emission with an integrated lineflux of 68±16 mJy km s−1at a radial velocity consistent with that of the star. We report the following findings:
1. The spectrospatialfiltering method shows that the ring’s sky-projected rotation axis matches that of the star (Le Bouquin et al. 2009), with the material at the SE
ansa moving toward us. This however remains insuf fi-cient to determine the sense of rotation and in turn whether the NE side of the ring(observed to be brighter in HST scattered light imaging; Kalas et al. 2005) is in
front of or behind the sky plane.
2. The radial location of the emission is consistent with that of the millimeter dust ring (as presented in MacGregor et al. 2017), indicating that both the observed CO and
dust originate from the cometary belt at a distance of ∼136 au from the star.
3. CO J=2-1 emission is optically thin and originates from a total CO gas mass of 0.65 42 ´10-7M
Å
( – ) . This is consistent with the previous ALMA nondetection of the J=3-2 transition (Matrà et al. 2015) and is in line
with the CO excitation conditions observed in the β Pictoris disk.
4. At an age of 440 Myr, Fomalhaut hosts the oldest debris belt where gas emission colocated with dust emission has been detected to date. The amount of CO and the potential high amounts of H2(more typical of primordial
protoplanetary disks) are insufficient to shield CO and
Figure 8. Model image for the maximum CO J=2-1 flux enhancement expected at pericenter with respect to apocenter through steady-state CO production in the Fomalhaut ring. The model predicts a flux density enhancement of ∼14.5% at the pericenter (w =22 . 5 ) with respect to the apocenter location. However, this is for an infinitesimally short CO lifetime, much shorter than an orbital timescale; for thefinite expected CO lifetime of 120 years, the peak is shifted by∼19° in the direction of motion, which we here assumed to be clockwise. This shifts the peak to a true anomaly of
f~ , or very close to the SE ansa. This model example assumes the best-3 . 5 fit orbital elements and ring width from the dust continuum fit, β Pictoris-like electron densities, a gas temperature equal to the blackbody temperature of ∼50K at the ring’s distance to the star, a planetesimal strength QD=10, and a radially constant vertical aspect ratio of 0.06.
15
allow it to survive over the system’s lifetime. This implies that the observed CO is of secondary origin and originates from exocometary ices within the belt. 5. We evaluate the possibility of CO being produced from
either stochastic destruction of a large icy body or steady-state release through the collisional cascade. We deem a stochastic collision possible but reasonably likely only for high total belt masses. On the other hand, in the steady-state scenario(as first described in Matrà et al.2015), we
combine the mass loss rate from the collisional cascade (producing CO) with the known CO photodissociation rate (destroying CO) to infer a CO+CO2 exocometary
mass fraction of 4.6%–76%. This is consistent with the other two debris belts where gas has been confirmed to be of exocometary origin,β Pictoris (Matrà et al.2017) and
HD 181327 (Marino et al.2016).
6. As well as being similar to one another, exocometary CO +CO2mass fractions are consistent with observations of
solar system comets, where this may be explained by similar blackbody temperatures and may indicate similar formation conditions in the original protoplanetary disk. We present a simple ISM inheritance model, showing that the CO+CO2 mass fractions in exo- and solar system
comets are consistent with all of the CO+CO2 having
been directly inherited from the ISM’s CO+CO2ice and
CO gas content. Increasingly accurate cometary abun-dance measurements are needed to distinguish between comet formation scenarios and to estimate the amount of CO+CO2 that was lost through grain surface chemistry
forming more complex organics or through gas release during the main-sequence phase of evolution, as observed here.
7. We report tentative evidence that most of the detected CO emission(49 ± 27)% originates near the ring’s pericenter location derived by ALMA and HST high-resolution dust imaging. This may be due to a recent impact event that took place near pericenter, or to CO pericenter glow caused by the combined effect of(A) a steady-state mass loss rate enhancement at pericenter for an eccentric ring (for sufficiently high values of proper eccentricities ep or
sufficiently low planetesimal strengths QD) and (B) molecular excitation effects due to the pericenter being closer to the central star.
8. We presented a model of CO pericenter or apocenter glow expected for exocometary CO released in eccentric belts. For a well-characterized dust belt such as Fomalhaut, the expected CO mass ratio at apocenter with respect to pericenter is only a function of the planetesimal strength QD and the mean proper
eccen-tricity ep. The model presented is general and indicates
that we should expect asymmetric exocometary emission in eccentric gas-bearing debris disks, a prediction that may be tested by future ALMA observations. The highest possible CO flux enhancement at pericenter versus apocenter predicted in the Fomalhaut belt (∼14.5%) is at the limit of being marginally consistent with our observations; if confirmed, a pericenter enhancement much higher than this prediction would rule out a steady-state scenario, proving instead that the observed CO must have originated from a recent impact between very large comets.
The authors are grateful to the referee for his or her thorough review of the paper, leading to significant and valuable improvements. In addition, we would like to thank S. Marino and A. Bonsor for useful discussions on thefiltering method and the cometary release mechanism. L.M. acknowledges support by STFC through a graduate studentship and, together with M.C.W. and A.S., by the European Union through ERC grant number 279973. M.A.M. acknowledges support from a National Science Foundation Graduate Research Fellowship (DGE1144152) and from NRAO Student Observing Support. P.K., J.R.G., and G.D. thank NSF AST-1518332, NASA NNX15AC89G, and NNX15AD95G. This work benefited from NASA’s Nexus for Exoplanet System Science (NExSS) research coordination network sponsored by NASA’s Science Mission Directorate. G.M.K. is supported by the Royal Society as a Royal Society University Research Fellow. A.M.H. gratefully acknowledges support from NSF grant AST-1412647. M.P. acknowledges support from NASA grants NNX15AK23G and NNX15AM35G. A.S. is partially sup-ported by funding from the Center for Exoplanets and Habitable Worlds. The Center for Exoplanets and Habitable Worlds is supported by the Pennsylvania State University, the Eberly College of Science, and the Pennsylvania Space Grant Consortium. This paper makes use of the following ALMA data: ADS/JAO.ALMA#2015.1.00966.S. ALMA is a partner-ship of ESO(representing its member states), NSF (USA) and NINS(Japan), together with NRC (Canada), NSC and ASIAA (Taiwan), and KASI (Republic of Korea), in cooperation with the Republic of Chile. The Joint ALMA Observatory is operated by ESO, AUI/NRAO, and NAOJ.
Facility: ALMA.
Appendix A
Dependence of Mass Loss Rate on the True Anomaly in a Steady-state Collisional Cascade
Here, we aim to derive the dependence of the solid mass loss rate M D f˙ ( , )=M D f R( , ) col(D f, ) on the true anomaly f in an element of length along the ring ds and in a size bin between D and D+dD. Following Wyatt & Dent (2002), and explicitly
marking the dependence of parameters on the true anomaly f, the collision rate of planetesimals of sizes in the range Dim to Dim+ dDim on a planetesimal of size D is
Rcol(D D, im,f)=F D D( , im) ( )s f vrel( )f , ( )6 where s ( ) is the cross-sectional area per unit volume off
planetesimals of all sizes, vrel( ) is the relative velocity of thef
impactor and the target, and F D D( , im) is the collisional cross
section of impactors of size Dim on the target of size D.
Neglecting gravitational focusing, which in Fomalhaut becomes important only for bodies that are too large to participate in the collisional cascade(Wyatt & Dent2002), the
latter is expressed as F D D D D D , im im 1 , 7 im 2 s = ⎛ + ⎝ ⎜ ⎞ ⎠ ⎟ ( ) ¯ ( ) ( ) where D D D dD D D im im min max
ò
s¯ ( )=s( ) s( ) is the normalized cross section of the impactor, with Dmin and Dmax being theminimum and maximum size of solids participating in the collisional cascade.
Lissauer & Stewart 1993), and that the mean planetesimal
inclinations I»ep, where epis the mean proper eccentricity of
planetesimals in the belt. This differs from the forced eccentricity efrc in that the forced component can be seen as
that imposed on all particle orbits through secular interaction with an unseen perturber, whereas the proper component can be interpreted as the “intrinsic” eccentricity of the particle and defines the width of the torus formed by particles orbiting the star with the same semimajor axis(see, e.g., Figure 2 in Wyatt et al. 1999). Therefore, while the mean proper eccentricity ep
determines the extent of orbit crossing and changes the relative velocity of collisions equally at any true anomaly, it is the forced eccentricity efrcthat introduces a dependence on the true
anomaly on the Keplerian velocity, and hence on the relative velocity of collisions (see Equation (13)).
Following Pan et al. (2016), the linear number density, and
hence the cross-sectional area density s ( ) and the massf M D f( , ) in an element of length ds, depend on the inverse of the Keplerian velocitys( )f µ1 vKep( ). This means that thef
product s ( )f vrel( ) in Equationf (8) is independent of the
Keplerian velocity vKep and hence of the true anomaly f.
However, the collision rate Rcol( ) remains dependent on fD
through the minimum size Dcc(f D, ) of impactors causing a catastrophic collision, which depends on the relative collision velocities vrel( ).f
As shown in Wyatt et al.(1999), assuming that the
steady-state size distribution follows the expression n D( )µD2 3- q
from Dmin to Dmax (Dohnanyi 1969), the integral in
Equation(8) can be solved to obtain
F D D dD X f D D q q X f q q X f , 1 6 10 3 4 3 5 3 3 , 10 D f D D D q max , , im im min 5 3 2 cc min max
ò
= ´ + -- + -⎛ ⎝ ⎜ ⎞ ⎠ ⎟ ⎡ ⎣ ⎢ ⎤ ⎦ ⎥ ( ) ( ) ( ) ( ) ( ) ( ) ( ) { ( ) } where X f Dcc f D, D 2QD vrel e,f 2 p 1 3 = = ( ) ( ) ( ( )) for Dcc f D, >Dmin( ) and X f( )=Dmin D for Dcc(f D, )<Dmin.
One can immediately notice that for sizes where all impactors above the minimum size always cause a catastrophic collision
Dcc f D, <Dmin ,
( ( ) ) the integral becomes simply the expres-sion in the square brackets above, and its dependence on the true anomaly is lost. This has implications for the smallest particles in the size distribution, which we will come back to later. For(larger) sizes where D f Dcc( , )>Dmin,assuming that the smallest and largest sizes Dmin and Dmax as well as the
dependence of the mass loss rate on vKep:
M D f e v f Q e v f Q e v f , 2.25 1 2 3 2 2.25 1 5 2 2.25 , 12 p Kep D p Kep D p Kep 1 3 2 3 1 3 2 3 2 3 4 3 µ ´ + + -⎡ ⎣⎢ ⎤ ⎦⎥ ˙ ( ) ( ) ( ) ( ) ( ( )) ( ) ( ( )) ( )
where the Keplerian velocity in the eccentric planetesimal belt can be expressed as(following Pan et al.2016)
v f GM a e f e e 1 2 cos 1 , 13 Kep frc frc2 frc2 = + + -( ) ( )
where G is the gravitational constant, Må is the stellar mass, and a is the semimajor axis of the belt.
Equations(12) and (13) have implications for the predicted
enhancement of pericenter with respect to apocenter (or vice versa), which we express as 1-M f˙ ( =180) M f˙ ( = 0 ) and show in Figure7. In particular, it can be shown that
e M f M f v f v f e e 0 0 180 0 180 1 1 1 14 p Kep Kep frc frc 2 3 2 3 = = = = = + - < -⎛ ⎝ ⎜ ⎞ ⎠ ⎟ ⎛ ⎝ ⎜ ⎞ ⎠ ⎟ ˙ ( ) ˙ ( ) ( ) ( ) ( ) and e M f M f v f v f e e 0 180 0 180 1 1 1, 15 p Kep Kep frc frc 2 3 2 3 ¥ = = = = = + - > + + ⎛ ⎝ ⎜ ⎞ ⎠ ⎟ ⎛ ⎝ ⎜ ⎞⎠⎟ ˙ ( ) ˙ ( ) ( ) ( ) ( )
meaning that a pericenter mass loss rate enhancement is expected for high proper eccentricities(since the high relative collision velocities at pericenter dominate over the mass enhancement at apocenter), whereas an apocenter mass loss rate enhancement is expected for low proper eccentricities (since the mass enhancement at apocenter dominates over the increase in collision velocities at pericenter). We note that in the limit of small proper eccentricities(ep ), the minimum0 impactor size Dcc(f D, ) to cause a catastrophic collision on a target D is much larger than the target itself(D f Dcc( , )D).