HAL Id: hal-00022852
https://hal.archives-ouvertes.fr/hal-00022852
Submitted on 14 Apr 2006
HAL is a multi-disciplinary open access
archive for the deposit and dissemination of
sci-entific research documents, whether they are
pub-lished or not. The documents may come from
teaching and research institutions in France or
abroad, or from public or private research centers.
L’archive ouverte pluridisciplinaire HAL, est
destinée au dépôt et à la diffusion de documents
scientifiques de niveau recherche, publiés ou non,
émanant des établissements d’enseignement et de
recherche français ou étrangers, des laboratoires
publics ou privés.
Phase noise inter-laboratory comparison preliminary
results
Patrice Salzenstein, Frederic Lefebvre, Roland Barillet, Jan Čermak, Wolfgang
Schaefer, Gilles Cibiel, Gérard Sauvage, Olivier Franquet, Olivier Llopis,
François Meyer, et al.
To cite this version:
Patrice Salzenstein, Frederic Lefebvre, Roland Barillet, Jan Čermak, Wolfgang Schaefer, et al.. Phase
noise inter-laboratory comparison preliminary results. 20th European Frequency and Time Forum,
Braunschweig, Deutschland,. 27-30 March 2006, 2006, France. pp.147-151. �hal-00022852�
Phase noise inter-laboratory comparison preliminary results
P. Salzenstein1, F. Lefebvre2, R. Barillet3, J. Čermak4, W. Schaefer5, G. Cibiel6, G. Sauvage7, O. Franquet8, O.
Llopis9, F. Meyer10, N. Franquet1, X. Vacheret1, A. Kuna4, L. Šojdr4, G. Hejc5 and S. Gribaldo9 1FEMTO-ST, CNRS, Associated to LNE, 32 av. Obs., F25044 Besançon Cedex, France
Phone: +33(0)381853974 Fax: +33(0)381853998
2
OSCILLOQUARTZ, rue des Brévards 16, CH-2002 Neuchâtel 2, Switzerland
3
Observatoire de Paris, CNRS, LNE-SYRTE, Bât B, 61 av. Obs., F75014 Paris, France
4
Czech Academy of Science, Dpt of Standard Time & Frequency, Chaberska 57, 18251 Praha 8, Czech Republic
5
TimeTech GmbH, Curiestrasse 2, D70563 Stuttgart, Germany
6
CNES (Centre national d’Etudes Spatiales), 18 av. E. Belin, F31404 Toulouse Cedex France
7
AEROFLEX, 5 Place du Général De Gaulle, F78990 Elancourt, France
8
AR Electronique, rue du Bois de la Courbe, F25870 Châtillon-le-Duc, France
9 LAAS CNRS, 7 av. du Colonel Roche, F31077 Toulouse France 10
Observatoire de Besançon, CNRS, Associated to LNE, 41bis av. de l’Obs., BP1615, F25010 Besançon, France
1
Electronic address: [email protected]
ABSTRACT
Some phase noise benches used and developed by different research and commercial laboratories have to be tested. The problem is not to compare the performances of several oscillators, but to compare and to make an evaluation of the uncertainties, and of course, to compare the resolution and the reproducibility of the measurements, which are of interest for manufacturers. This comparison allows us to determine the ability to get various systems traceable together in order to increase the trust that one can have in phase noise measurements. Standards to be characterized during this comparison are 5 MHz, 100 MHz and microwave commercial oscillators. Obtained spectra can be affected by the
Environmental conditions: temperature, hygrometry, electromagnetic radiations, voltage supplies of oscillators under test and measurement instrumentation, but they also depend on starting conditions of the oscillators and due to their intrinsic nature, and to the time they have been stocked after being switched-off and to the benches themselves. The problem consists in evaluating the possible different contributions. These goals are ambitious, so it is preferable to investigate in priority the inter-laboratory reproducibility in using comparable benches or benches that use equivalent methods, but also measurements resulting from various methods, while we stay in the context of measurements performed in a laboratory. It began in October 2005 and will be finished in april 2006. Preliminary results are now available.
1. INTRODUCTION
An international comparison of phase noise was organized in 1993 and its results published in Germany during EFTF in 1994 [1]. More than ten years later, the new benches developed by different laboratories and commercial benches have to be tested. LNE (Laboratoire National de Métrologie et d’Essai, that now plays the role that BNM owns in the past) asked FEMTO-ST institute, as it is an LNE associate laboratory, (COFRAC accredited under number 2.13), to organize a comparison of phase noise with 5 MHz, 100 MHz and microwave oscillators. The problem is not to compare the performances of several oscillators, but to compare and to make an evaluation of the
uncertainties, and the resolution and the reproducibility of the measurements. The aim of this comparison is not to lead a competition between different means of measurements but have the ability to get several systems traceable together in order to increase the trust that one can have for phase noise measurements. Oscillators to be characterized during this comparison are commercial oscillators. At 5 MHz, BVA oscillators are provided by Oscilloquartz company and FEMTO-ST. For 100 MHz oscillators, FEMTO-ST institute provides AR Electronique commercial oscillators. A commercial MITEQ Dielectric Resonator Oscillator (DRO) provided by LAAS-CNRS is to be used for 3.5 GHz microwave characterization. Ten laboratories from four different countries participate in this comparison.
II. GENERALITIES CONCERNING SPECTRAL MEASUREMENTS
Frequency stability can be characterized in the frequency domain by studying spectrum (FFT), or in time domain by means of a statistical processing of the frequency data (for example Allan variance). It allows characterization of the frequency stability versus integration time. Near the carrier, an oscillator presents flicker frequency noise, i.e. 1/f in the frequency fluctuation domain, which means 1/f3 for the phase
noise density in the spectral domain. It corresponds to the so called “flicker floor” for Allan variance. Nevertheless this correspondence is not bijective : a 1/f3
phase noise gives an Allan variance floor, but the reverse proposal is not always true.
The main principle of the phase noise measurements consists in phase demodulating a signal by locking an oscillator, that is the Unit Under Test (UUT), on a reference signal, using a Phase Lock Loop (PLL).
Figure 1: Usual principle for phase noise measurement of a couple of oscillators using a PLL
Especially in microwaves, the UUT is to be locked and not the reference that is already locked on a low frequency oscillator. The error signal of this locking is then proportional to the phase difference between the free running UUT and the reference. Outside the PLL bandwidth, it is proportional to the phase difference between the free running UUT and the reference. If the reference shows a very low noise, it is then proportional to the UUT phase noise. In the PLL bandwidth, it is proportional to frequency fluctuations. Results in the band pass of the locking cannot be used near the frequency cut-off of the PLL. The error bias is amplified and a FFT analyzer calculates the spectral density of phase noise fluctuations.
III. REPRODUCIBILITY OF THE MEASUREMENTS
Obtained spectra can be affected by the environmental conditions : temperature, hygrometry, electromagnetic radiations, …, but they also may depend on the time
operation since switching the oscillators on, and to the time they have been stocked after being switched off and to the benches performances.
The problem consists in evaluating the possible impact of these different contributions on the measured phase noise. It is better to investigate in priority the inter-laboratory reproducibility using comparable benches or benches that use equivalent methods, but also measurements resulting from various methods, while we stay in the context of measurements performed in a metrological laboratory. As it is written in the introduction, the aim of this comparison is not to compare performances of oscillators, but to compare and evaluate uncertainties, resolution of the benches and reproducibility of the measurements. It is not a competition between measurement means but a way to have several systems traceable together in order to increase the trust that one can have for phase noise measurements done in laboratories.
IV. PROTOCOL OF MEASUREMENTS Preliminary measurements:
Oscillators were to be measured at first by the reference laboratory at the beginning, then by each participant and at the end of this comparison one more time at the reference laboratory.
Reception of the standards:
When receiving the oscillators, each lab precised how the packing is and what information was important. Oscillators have been immediately switched on, and the measurement was made 48 hours later in the appropriate room. Frequency and power were preliminary verified. It must not be forgotten that the performances, specified by the manufacturers, are guaranteed at the end of one 90 days period without any interruption. However, it is not possible, within the framework of the circulation of the standards, to respect this time. Consequently we have decided to keep the oscillators “on” as long as possible before the measurements. In an empirical way, it must be envisaged latency doubles time of switch-off period. Moreover oscillators are sensitive to the shocks. Measures:
Oscillators have been measured in terms of power spectral density of phase noise versus Fourier frequencies in the range 1 Hz - 100 kHz. However in the microwave domain, a DRO cannot be measured too close to the carrier due to free-running fluctuations that can be in the range of 1 rad2/Hz. So the indicated range
has to be characterized from about 100 Hz. Measurements were given at 1 Hz, 10 Hz, 100 Hz, 1 kHz, 10 kHz, and 100 kHz within the 2 σ uncertainty. When it is possible, results given as a calibration certificate are appreciated, as several laboratories may be calibration centers, accredited or not.
The various laboratories have different kinds of phase noise measurement benches. They may have used these benches in order to compare them in the same laboratory.
Here are different commercial benches used in this comparison :
- Hewlett Packard bench - Europtest bench
- Femtosecond bench - Timing Solutions bench - AR Electronique bench
Some laboratories which have a frequency stability bench have used it. It may be possible to deduce interesting information concerning phase noise.
In order to limit environmental effects in the different laboratories, it is interesting to know ambient conditions.
Such parameters are: room temperature, hygrometry rate, but also it is interesting to specify if oscillators or benches are in a special Faraday cage or something equivalent, and what voltage supplies are used, for example, batteries for the oscillators or sector for the instruments composing the bench.
It has been also precised if uncertainties are calculated from such parameters or given by an accreditation. Sending the standards to the next laboratory:
The oscillators were packed and sent to the following laboratory, except if it was specified that there must be an inversion by the person in charge of the comparison. Any information considered to be useful was transmitted to the person in charge of the comparison. Transmission of the results:
The complete results were transmitted to the person in charge of the comparison, before the standards finished circulating between the participating laboratories. The environmental conditions of the measurements were specified as explained above as well as the type of bench, the method used, the uncertainties…
The comparison is planned to be completed in April 2006. When it is finished, a report will be written with mention of the authors and their laboratories. However, in the graphs and in the presentation of the results, the
different participating laboratories are codified by letters.
V. FIRST RESULTS
The obtained results concern at first phase noise measured values for each oscillator at 5 MHz, 100 MHz and 3.5 GHz. Comparison also gives interesting results concerning the benches.
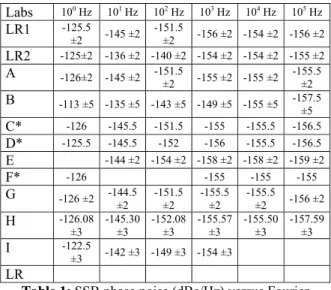
Labs 100 Hz 101 Hz 102 Hz 103 Hz 104 Hz 105 Hz LR1 -125.5 ±2 -145 ±2 -151.5 ±2 -156 ±2 -154 ±2 -156 ±2 LR2 -125±2 -136 ±2 -140 ±2 -154 ±2 -154 ±2 -155 ±2 A -126±2 -145 ±2 -151.5 ±2 -155 ±2 -155 ±2 -155.5 ±2 B -113 ±5 -135 ±5 -143 ±5 -149 ±5 -155 ±5 -157.5 ±5 C* -126 -145.5 -151.5 -155 -155.5 -156.5 D* -125.5 -145.5 -152 -156 -155.5 -156.5 E -144 ±2 -154 ±2 -158 ±2 -158 ±2 -159 ±2 F* -126 -155 -155 -155 G -126 ±2 -144.5 ±2 -151.5 ±2 -155.5 ±2 -155.5 ±2 -156 ±2 H -126.08 ±3 -145.30 ±3 -152.08 ±3 -155.57 ±3 -155.50 ±3 -157.59 ±3 I -122.5 ±3 -142 ±3 -149 ±3 -154 ±3 LR
Table 1: SSB phase noise (dBc/Hz) versus Fourier Frequency at 5 MHz for each laboratory codified by a
letter. Uncertainties given at 2σ
Table 1 presents results without any correction at 5 MHz for the two oscillators of the comparison. Notice that in the tables, sign * mentioned here indicates that uncertainties have not yet been established.
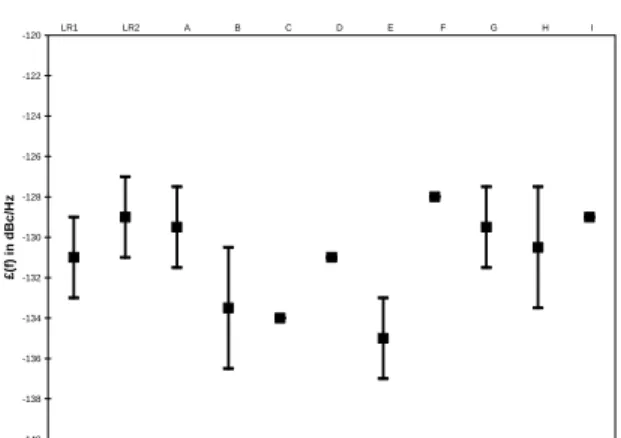
-140 -135 -130 -125 -120 -115 -110 -105 £ (f) in dBc/Hz LR1 LR2 A B C D E F G H I
Figure 2: SSB phase noise at 1Hz from the 5MHz carrier. Uncertainties given at 2σ
The results are presented also in figures 2 and 3. The first one focuses on SSB phase noise at 1Hz from the 5MHz carrier. One participant had a problem, which is
to be investigated. Three other laboratories did not send yet their uncertainties, which are indicated without error bars in the figure. The noise floor seems to be similar for most of the participants in spite of an offset not already explained for one participant. Laboratories are codified by a letter, which is used to indicate the corresponding data point in the figures.
-164 -162 -160 -158 -156 -154 -152 -150 £(f) in d B c /Hz LR1 LR2 A B C D E F G H
Figure 3: SSB phase noise at 100 kHz from the 5MHz carrier. Uncertainties given at 2σ
At 100 MHz, the results expressed in dBc/Hz are presented abroad also without any correction and comments.
The measurements seem to be consistent. But close to the 100 MHz carrier, a problem of stability in the phase lock loop probably made the measurement inaccurate, especially at 1 Hz. Discrepancies appears for some participants and would be investigated in order to be understood. For a 100 MHz quartz oscillator, it is more common to present the specification at 100 Hz from the carrier: results are presented in figure 4 expressed in SSB phase noise (dBc/Hz). Labs 100 Hz 101 Hz 102 Hz 103 Hz 104 Hz 105 Hz LR1 -64 ±2 -96 ±2 -131 ±2 -153 ±2 -161 ±2 -162 ±2 LR2 -58 ±2 -98 ±2 -129 ±2 -155 ±2 -162 ±2 -162 ±2 A -64 ±2 -95.5 ±2 -129.5 ±2 -153.5 ±2 -160 ±2 -160 ±2 B -65 ±3 -100 ±3 -133.5 ±3 -152 ±3 -160 ±3 -161 ±3 C* -70 -102 -134 -155 -163 -163 D* -73 -100 -131 -156.5 -162 -162.5 E -135 ±2 -151 ±2 -158 ±2 -159 ±2 F* -68 -128 -163 -163 G -67 ±2 -97 ±2 -129.5 ±2 -153.5 ±2 -160.5 ±2 -160.5 ±2 H -76.3 ±3 -96 ±3 -130.5 ±3 -154.8 ±3 -161.6 ±3 -161.7 ±3 I* -86 -100 -129 -150 -158 LR
Table 2: SSB phase noise versus Fourier Frequency at 100 MHz for each laboratory codified by a letter.
Uncertainties given at 2σ -140 -138 -136 -134 -132 -130 -128 -126 -124 -122 -120 £ (f ) in d B c /H z LR1 LR2 A B C D E F G H I
Figure 4: SSB phase noise (dBc/Hz) at 100Hz from the 100MHz carrier. Uncertainties given at 2σ For one participant, the noise floor was not measured far from the carrier.
The uncertainty could not be evaluated yet by four participants, which are indicated without error bars in the figure. The noise floor far from the carrier is presented in figure 5. -170 -168 -166 -164 -162 -160 -158 -156 -154 -152 -150 L (f) in d B c /H z LR1 LR2 A B C D E F G H
Figure 5: SSB phase noise at 100 kHz from the 100 MHz carrier. Uncertainties given at 2σ
Though the measurements are much closer, the differences should be explained by a very precise analysis of different parameters and in considering the way each participant led its measurement campaign. We consider that, when the difference exceeds 2 dB, one must investigate the possible origins of the discrepancy.
VI. DISCUSSION
Environmental conditions are precised in table 3. In this table are reported several parameters like temperature or hygrometry rate, and it is indicated whether the oscillators under test were powered by batteries or from the mains. It is written also if the measurements were
realized in a Faraday cage to protect them from electromagnetic radiations.
Temperature
(°C) Hygrometry (%) Batteries Faraday cage
LR 1 21.5 ±2.5 ? NO NO LR 2 25 ±2 36 ±5 NO NO A 23 44 YES YES B 22.5 ±1.5 ? NO NO C 23.5 ±2.5 42.5 ±12.5 YES NO D 20.5 ±2 ? YES NO E 23 ±3 ? YES YES F room temperature ? NO NO G 21 ±1 ? H 23 ±1 16 ±5 YES YES I 22±1 ? NO NO LR
Table 3: Measurement environmental conditions Measurement conditions are not precised yet concerning the starting conditions. As oscillators are switched off during transport, it can have an impact on stability and on the phase noise at 1 Hz. Some data have not yet been collected at that step of the comparison. The oscillators are still under measurement in the last laboratory, waiting for their final measurements in the reference laboratory of this comparison campaign, in order to “close the loop” and begin the next step that is the very precise analysis of the results.
One can notice that reproducibility of phase noise measurements seems not to be affected by similar conditions concerning laboratory temperature.
Hygrometry has to be better known before any conclusion.
Contribution of batteries is a fact that does not clearly appears when we examine tables and figures. Anyway, on the curves issued from each laboratory, we observed that 100 Hz and its harmonics are reduced by the use of batteries. The 50 Hz spurious lines generally originate from ambient radiation of the mains or from inappropriate cables in the measurement system.
Faraday cage helps to define a better resolution for phase noise measurements, by significantly reducing the level of spurious signals.
The combination of optimum environmental conditions is helpful for such high performance phase noise measurements, and also for reproducibility.
VII. CONCLUSION
The aim of this phase noise comparison was to evaluate reproducibility of the measurements given by different kinds of benches used in metrological laboratories. Most of the results confirm that the phase noise measurement uncertainties generally are about ±2 dB. A few discrepancies have been observed : it will be useful to understand their origin in order to avoid this kind of problem in future measurements.
Acknowledgements
We would like to thank LNE (Laboratoire National de Métrologie et d’Essai) and CNRS (Centre National de la Recherche Scientifique) for their financial support on this project.
REFERENCE
[1] F. L. Walls, R. Barillet, R. Besson, J. Groslambert, P. Schumcher, J. Rufenacht and K. Hilty, "International Comparison of phase noise", 8th EFTF, Technical University Munich, Weihenstephan, Germany, march 1994, pp. 439-456 (1994)