HAL Id: hal-02380378
https://hal.archives-ouvertes.fr/hal-02380378
Submitted on 28 Nov 2019
HAL is a multi-disciplinary open access
archive for the deposit and dissemination of sci-entific research documents, whether they are pub-lished or not. The documents may come from teaching and research institutions in France or
L’archive ouverte pluridisciplinaire HAL, est destinée au dépôt et à la diffusion de documents scientifiques de niveau recherche, publiés ou non, émanant des établissements d’enseignement et de recherche français ou étrangers, des laboratoires
The rheology and thermal history of Mars revealed by
the orbital evolution of Phobos
Henri Samuel, Philippe Lognonné, Mark Panning, Valéry Lainey
To cite this version:
Henri Samuel, Philippe Lognonné, Mark Panning, Valéry Lainey. The rheology and thermal history of Mars revealed by the orbital evolution of Phobos. Nature, Nature Publishing Group, 2019, 569 (7757), pp.523-527. �10.1038/s41586-019-1202-7�. �hal-02380378�
The rheology and thermal history of Mars revealed by the
orbital evolution of Phobos
Henri Samuel1, Philippe Lognonn´e1, Mark Panning2, Val´ery Lainey2
1. Institut de Physique du Globe de Paris, CNRS, Universit´e Sorbonne Paris Cit´e, Paris , France 2. Jet Propulsion Laboratory, California Institute of Technology, Pasadena, CA, USA
Preprint version ( Print version available at: www.nature.com/articles/s41586-019-1202-7 )
Reference: Nature569, 523527 (2019), doi: 10.1038/s41586-019-1202-7
The evolution and internal structure of Mars are, by comparison to its present-day surface,
poorly known -although evidence of recent volcanic activity1 suggests that its deep interior
remains hot and convectively cooling. The cooling rate of Mars is related to its early thermal
state and to its rheology, which determines its ability to deform and to dynamically evolve2.
Attempts to reconstruct the dynamic history of Mars and reveal its present-day structure, by combining the study of thermal evolution with surface observations, are limited by the inter-play between several key quantitiesincluding temperature, composition and rheology. Here we show that by considering Phobos (the closest satellite of Mars) the orbital evolution of which is governed by the thermochemical history of Mars, through tidal interactions we can gain insight into the thermal history and rheology of the planet. We investigated the long-term evolution of the main envelopes of Mars; these comprise a liquid metallic core that is overlain by a homogeneous silicate convecting mantle underneath an evolving heterogeneous lithospheric lid that includes a crust enriched in radiogenic elements. By exploiting the rela-tionship between Mars and Phobos within an established in situ scenario for the early origin
of the moons of Mars3, we find that initially Mars was moderately hotter (100 to 200 kelvin)
than it is today, and that its mantle sluggishly deforms in the dislocation creep regime. This
corresponds to a reference viscosity of 1022.2±0.5 pascal seconds (± denotes minimum and
maximum range limits throughout), and to a moderately to relatively weak intrinsic sensitiv-ity of viscossensitiv-ity to temperature and pressure. Our approach predicts a present-day average crustal thickness of 40±25 kilometres and a surface heat flow of 20±1 milliwatts per square metre. We show that combining these predictions with data from future and ongoing space missions - such as InSight - could reduce uncertainties in Martian thermal and rheological histories, and help to uncover the origin of Phobos.
To investigate the cooling history of Mars, we modelled its thermal evolution (see Supple-mentary Information, section S1, for details of the modelling approach) within a plausible range
of various governing parameters: the initial core (T c0) and mantle (T m0) convective temperatures;
the viscous rheology of the Martian mantle; the effective activation energy (E⇤) and volume (V⇤)
of the mantle, which determine the sensitivity of viscosity to temperature and pressure; and the 1
value of viscosity of the mantle (⌘0) at a reference temperature and pressure (see Supplementary
Information, section S4, for details of the parameter space that we considered). Similar to many other planetary bodies, Mars behaves as a thermal engine. The initial thermal state of a planet is a proxy for the amount of energy that the planet has to evacuate, and the rheology of a planet con-trols the efficiency at which heat can be transferred within the planet and eventually lost to space. These two families of governing parameters are, however, not independent of each othermainly
because the rheology of rocky planets is a strong function of temperature4 (Supplementary
Infor-mation, section S1). This interdependency naturally leads to trade-offs: identical thermal states for present-day Mars can be obtained from different mantle rheologies (Fig. 1a, b). Dependencies such
as these do not allow thermal and rheological quantities to be uniquely defined5,6, and further
con-straints that have different sensitivities to the governing parameters are required to remove these trade-offs. Unfortunately, eliminating these trade-offs by constraining the rheology of the Martian mantle from observations or experiments is difficult. On Earth, studies of post-glacial rebound
enable estimates of the viscosity of the upper mantle7. These studies are not possible on Mars
because such a record does not exist. Another way of inferring mantle- rock viscosity is by
per-forming deformation experiments at high temperature and pressure4. However, these experiments
are conducted on very small samples that are deformed at rates that are orders of magnitude above
the strain rate that is imposed by convective motions8. These measurements therefore require
con-siderable extrapolations, which are themselves not free of uncertainties. Multi-scale modelling is a tractable approach to determining the rheology of polycrystalline aggregates, although it
re-quires parameter adjustment to match experimental observations9. Another substantial source of
uncertainty derives from the influences of the chemical composition of the rocks in terms of major
and minor elements4,10. This is particularly true for Mars, for which the only known samples that
are currently available are thought to be the shergottite-nakhlite-chassignite (SNC) meteorites11.
Consequently, the mantle rheology of Mars is both the most-important and the least- constrained physical parameter that controls its thermochemical evolution.
To better separate out the influences of temperature and rheology on the thermochemical evolution of Mars, we considered the coupled orbital evolution of its closest satellite, Phobos. Thermalorbital coupling results from tidal interactions between Mars and its satellite. A satellite exerts a deforming gravitational force that creates a tidal bulge at the surface of the orbited body. If the planet is attenuating (that is, if it does not behave as a purely elastic medium), the bulge is not aligned in the direction of the planet and the satellite but instead forms at an angle. On Earth, attenuation owing to tidal interaction mostly occurs through friction along the shorelines and at the bottom of the oceans. Because the palaeo-bathymetry of Earth is unknown, using the long- term orbital evolution of the Moon to constrain the history of the Earth is not possible. However, on Mars dissipation mostly occurs through viscous deformation within its interior -although the influence of an early surface ocean could have a role (Supplementary Information, section 6.2). Such tidal interactions through viscous deformation are mainly governed by the ratio
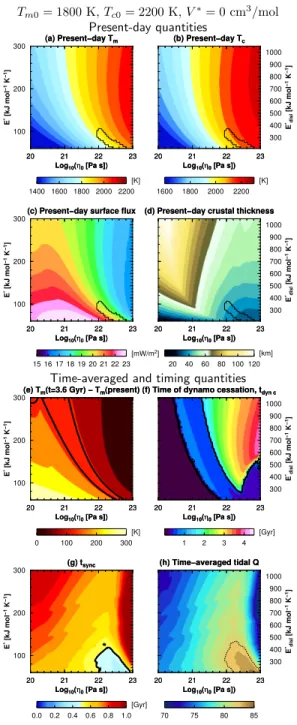
Tm0= 1800 K, Tc0= 2200 K, V = 0 cm3/mol Present-day quantities 100 200 300 E * [kJ mol − 1 K − 1] 20 21 22 23 Log10(η0 [Pa s]) (a) Present−day Tm 20 21 22 23 Log10(η0 [Pa s]) (a) Present−day Tm 1400 1600 1800 2000 2200 [K] 20 21 22 23 Log10(η0 [Pa s]) (b) Present−day Tc 300 400 500 600 700 800 900 1000 E * disl [kJ mol − 1 K − 1] 20 21 22 23 Log10(η0 [Pa s]) (b) Present−day Tc 1600 1800 2000 2200 [K] 100 200 300 E * [kJ mol − 1 K − 1] 20 21 22 23 Log10(η0 [Pa s])
(c) Present−day surface flux
20 21 22 23
Log10(η0 [Pa s])
(c) Present−day surface flux
15 16 17 18 19 20 21 22 23
[mW/m2]
20 21 22 23
Log10(η0 [Pa s])
(d) Present−day crustal thickness
300 400 500 600 700 800 900 1000 E * disl [kJ mol − 1 K − 1] 20 21 22 23 Log10(η0 [Pa s])
(d) Present−day crustal thickness
20 40 60 80 100 120
[km] Time-averaged and timing quantities
100 200 300 E * [kJ mol − 1 K − 1] 20 21 22 23 Log10(η0 [Pa s]) (g) tsync 20 21 22 23 Log10(η0 [Pa s]) (g) tsync 0.0 0.2 0.4 0.6 0.8 1.0 [Gyr] 100 200 300 E * [kJ mol − 1 K − 1] 20 21 22 23 Log10(η0 [Pa s])
(e) Tm(t=3.6 Gyr) − Tm(present)
20 21 22 23
Log10(η0 [Pa s])
(e) Tm(t=3.6 Gyr) − Tm(present)
0 100 200 300
[K]
20 21 22 23
Log10(η0 [Pa s])
(f) Time of dynamo cessation, tdyn c
300 400 500 600 700 800 900 1000 E * disl [kJ mol − 1 K − 1] 20 21 22 23 Log10(η0 [Pa s])
(f) Time of dynamo cessation, tdyn c
1 2 3 4 [Gyr] 20 21 22 23 Log10(η0 [Pa s]) (h) Time−averaged tidal Q 300 400 500 600 700 800 900 1000 E * disl [kJ mol − 1 K − 1] 20 21 22 23 Log10(η0 [Pa s]) (h) Time−averaged tidal Q 70 75 80 85
Figure 1: Results from the exploration of Mars-Phobos’ thermo-orbital evolution,
for an initial thermal state Tm0= 1800 K, Tc0= 2200 K and an effective activation
vol-ume V = 0 cm3/mol. (a-d) Present-day quantities resulting from 4.5 Gyr of evolution.
(e-h) Time-averaged and timing quantities. Each panel is composed of 4096 distinct thermo-chemical and orbital evolutions, characterized by different mantle rheological properties: reference viscosity 0, and effective activation energy E . The
correspond-ing activation energy for purely dislocation creep, Edisl, is also shown on the vertical
axes, assuming Edisl= E /3.528. The thick black curves in (e), (f), and (h) delineate
respectively critical values for: the secular cooling during the Amazonian and Hespe-rian epochs (100-140 K), the solution corresponding to thermal dynamo operating in Mars’ core for the first Gyr, and the (backward-going) time at which Phobos reaches the synchronous orbit (see text and supplementary material for further details). The grey area corresponds to an excluded region where large-scale melting would exist after t=0.5 Gyr, which would lead to an evolution of Phobos incompatible with our orbital constraint. The thin dotted curve in (i) represents a time-averaged Q=82. The thin black curves in (a-d) mark the contour of the solution that satisfy thermal, magnetic, and orbital constraints, as shown in Fig. 2.
15
Figure 1: Exploration of Mars-Phobos’ thermo-orbital evolution, for Tm0 = 1800 K,
Tc0 = 2200 K, and V⇤ = 0 cm3/mol. | (a-d) Present-day quantities. (e-h) Time-averaged and
timing quantities. Each panel represents 4096 thermo-chemical and orbital evolutions, with
dis-tinct mantle reference viscosity ⌘0, and effective (E⇤) or dislocation creep (E⇤disl = E⇤/3.528)
activation energies. Black curves in (e-f), and (h) delineate respectively critical values for: the Amazonian-Hesperian secular cooling (100-140 K), the solutions corresponding to an early Mar-tian thermal dynamo, and the (backward-going) time at which Phobos reaches the synchronous orbit. The dotted curve in (h) represents a time-averaged Q=82. Black contours in (a-d) mark the solutions satisfying thermal, magnetic, and orbital constraints (see Fig. 2).
of the degree-two Love number of Mars (k2) over its tidal quality factor (Q)12. The degree-two
Love number describes the reaction of the gravitational potential of Mars to the tidal forcing, and is weakly sensitive to temperature within the solid mantle. By contrast, the tidal quality factor -which measures the tidal dissipation within Mars - is inversely proportional to the tidal angle and is
known to be strongly temperature-dependent13, according to an Ahrrenius relationship for a given
pressure and frequency of Q ⇠ exp(b/T ), in which T is the mantle temperature and b > 1 is a constant. A hotter mantle implies a lower Q, and thus a stronger tidal dissipation within Mars. A stronger tidal dissipation of a planetary body yields a faster change in the values of the orbital evolution parameters of its satellite. In the simplest case in which Q would remain constant (or the temperature would not evolve with time) and the orbital eccentricities of Phobos were small, the evolution of the semi-major axis distance for the MarsPhobos system (a) is a simple
time-decreasing function of the ratio k2/Q:
a =h c t k2
Q + a(t = 0)13/2
i2/13
,
in which c is a positive constant, and t is time12. Therefore, the lower the value of Q the
faster Phobos converges towards the surface of Mars, as time increases. Although, in reality, the influence of eccentricity and the time-dependence of Q cannot be neglected (Supplementary In-formation, sections S2, S3), the above reasoning remains qualitatively correct. Phobos, unlike its companion satellite Deimos, spirals in towards the surface of Mars. This difference between the two satellites results from Phobos being located within the synchronous limit (about 6.03 Martian radii) at which the angular velocity of the satellite exactly equals the spin of the planet, whereas Deimos is located beyond the synchronous limit. The origin of Phobos and Deimos remains de-bated and several scenarios advocate for an in situ origin, such as the satellites being the result of
an early impact on Mars3,14,15or the consequence of a disruption of a more-ancient moon14,16. An
external origin has also been proposed, in which the Martian moons are suggested to result from
asteroid capture during the presence of an early dense atmosphere17,18; this scenario, however,
cannot explain the current small inclination of Phobos and Deimos16,19. For the in situ scenarios,
the emplacement of Phobos within a time window of 0-500 million years (Myr) is commonly ac-cepted, with the exception of a recent proposal that suggests the progressive accretion of debris
from a giant impact20. We did not consider this possibility because an accretion scenario such as
this would only take place within the synchronous orbit and would not, therefore, explain the origin
of Deimos21. In addition, regardless of the scenario for the origin of Phobos, its present-day
loca-tion (a = 2.76 Mars radii) within the synchronous radius implies that this satellite was emplaced at a distance from Mars that lies between its current location and the synchronous limit. We shall see that such a consideration for orbital evolution although simple exhibits a sensitivity to thermal and rheological parameters of Mars that is different from more-commonly used constraints. This makes orbital evolution a powerful tool, when combined with other constraints, for inferring the rheology and the thermal history of Mars.
Mar-tian thermal evolution: (1) the mantle total secular cooling during the Amazonian and Hesperian periods (about 3.6 billion years (Gyr) ago until present), which is estimated to lie within 100-140
K on the basis of petrological considerations22 (Fig. 1e); (2) the presence of an internally induced
magnetic field during the first billion years of the evolution of Mars23 (Fig. 1f) (see
Supplemen-tary Information, section S5, for details); and (3) the semi-major axis of the trajectory of Phobos around Mars must be located well within the synchronous radius during the past four billion years
of orbital evolution. This last constraint can be reformulated as the time (tsync) at which Phobos
approaches the synchronous radius being less than 500 Myr (when tracing the evolution of Phobos backwards in time). This corresponds to the upper time limit that we considered for the formation of Phobos (Fig. 1g) (see Supplementary Information, sections S2, S4, for details). This limit ap-proximately corresponds to a time-averaged value of Q = 82 (Fig. 1h), which is only moderately
below the present-day value of 95 (assuming a Q/k2 ratio = 55924, and a present-day value of
k2 = 0.16925). This indicates that orbital evolution constraints are very sensitive to the thermal
history of Mars, as Q is dependent on the thermal state. These present-day and time-averaged val-ues of the tidal quality factor are considerably smaller than the present-day valval-ues inferred for the
Earth26. This suggests that at present the convecting mantle of Mars would be hotter than that of
the Earth. Indeed, active plate tectonics on Earth would yield more-efficient heat loss over
geolog-ical timescale, as compared to stagnant lid convection on Mars27(see Supplementary Information,
section S6.1). Alternatively, rheological differences between the Earth and Mars could have their
origins in differences in the major- or minor-element composition of their mantles4,10.
Each of the constraints that we considered defines a reduced domain within the solution space (activation energy and reference viscosity) that is displayed in Fig. 2a-c, for a given set of initial mantle and core temperatures and given mantle activation volume. The area that is common to the three individual constraints points to the reduced matching set of rheological parameters (Fig. 2d), the contour of which is shown in Fig. 1a-d. The trade-offs between the thermal state and mantle rheology of Mars are clearly visible in Fig. 2, b, in which the solutions that satisfy both secular cooling and magnetic constraints are superimposed; this leaves a large space of acceptable solu-tions with very distinct rheologies. However, the additional consideration of the orbital evolution of Phobos largely removes the trade-offs, because the associated domain of acceptable solutions (Fig. 2c) only partially superimposes on the solutions defined by thermal and magnetic constraints. This illustrates the benefit of using orbital constraints.
The exercise displayed in Fig. 1 and Fig. 2 can be reproduced for different values of initial
Martian thermal states and activation volumes (that is, values for T m0, T c0 and V⇤), within the
plausible ranges that we considered (Supplementary Information, section S5).
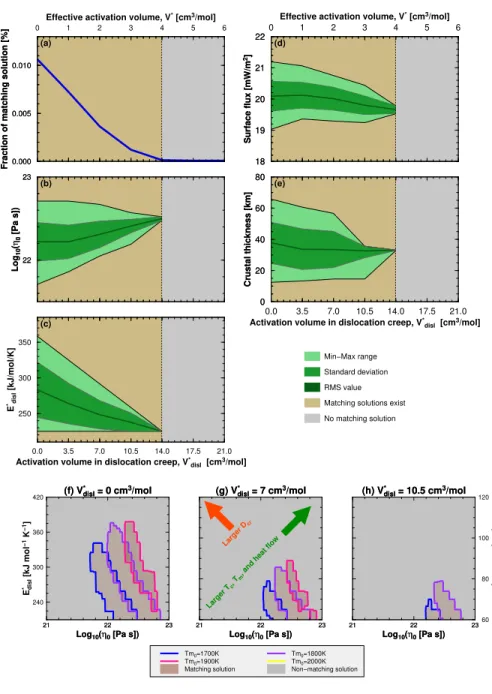
Not all sets of T m0, T c0 and V⇤ admit a matching solution. As shown in Fig. 3a, effective
activation volumes that are greater than or equal to 4cm3mol 1 do not allow for matching
Tm0= 1800 K, Tc0= 2200 K, Vdisl= 0 cm3/mol 300 400 500 600 700 E * disl [kJ mol − 1 K − 1] 21 22 23 Log10(η0 [Pa s]) (c) Orbital constraint 300 400 500 600 700 E * disl [kJ mol − 1 K − 1] 21 22 23 Log10(η0 [Pa s])
(a) Secular cooling constraint
300 400 500 600 700 E * disl [kJ mol − 1 K − 1] 21 22 23 Log10(η0 [Pa s]) (b) Magnetic constraint 300 400 500 600 700 E * disl [kJ mol − 1 K − 1] 21 22 23 Log10(η0 [Pa s]) (d) Combined constraints
Matching index for individual constraints Non−matching solution Matching constraint
Matching index scale for combined constraints
0 1 2 3
Figure 2: Thermal and orbital evolution constraints applied to the cases dis-played in Fig. 1, assuming a Martian mantle deforming in the dislocation creep regime. (a-c) Individual constraints. (d) combined constraints. The warmer col-ors indicate a higher matching index, while grey areas indicate thermal evolu-tion that are not compatible any constraint considered. Red areas represent the mantle rheologies that satisfy all constraints.
Figure 2: Thermal and orbital evolution constraints applied to the cases displayed in Fig. 1, assuming a Martian mantle deforming in the dislocation creep regime. | (a-c) Individual constraints. (d) combined constraints. The warmer colors indicate a higher matching index, while grey areas indicate thermal evolution that are not compatible any constraint considered. Red areas represent the mantle rheologies that satisfy all constraints.
tions. Within the remaining space at V ⇤ < cm3mol 1, the matching reference viscosity is about
5⇥ 1021 5⇥ 1022pascal seconds, and the effective activation energy is E⇤ ⇠= 80± 20kJmol 1.
This range of relatively small values of effective activation energy is difficult to reconcile with the
values inferred from experiments if the Martian mantle deforms in the diffusion creep regime4.
However, if the Martian mantle deforms in the dislocation creep regime, the corresponding intrin-sic activation energies and activation volume would be about 3.5⇥ larger than the range of effective values mentioned above -a non-Newtonian, slowly deforming rock behaves similarly to a very vis-cous Newtonian fluid, with activation energies and activation volumes about 3.5⇥ smaller that the
corresponding intrinsic values28–30. This implies that the Martian mantle deforms in the dislocation
creep regime, with an intrinsic activation energy of E⇤
disl = 280±80 kJ/mol, and activation volume
V⇤
disl <14 cm3/mol.
Our approach also enables predictions to be made of the present-day values of several key
measurable quantities, including the average surface heat flux of 20 ± 1 mW per m2 and the
av-erage crustal thickness of 40 km ± 25 km. Both of these quantities slightly decrease with in-creasing activation volume (Fig. 3d-e). We have tested the influence of two potential additional early processes on our model results. The first of these is the effect of plate tectonics operating during the first 500 Myr of the thermochemical evolution of Mars (Supplementary Information, section S6.1). The influence of this is limited, and in essence moderately reduces the values of
the matching intrinsic activation energies to V⇤
disl < 10.5 cm3/mol, the intrinsic activation
ener-gies to disl E⇤
disl ⇠= 250± 40 kJ/mol and the predicted range of present-day crustal thickness to
Dcr ⇠= 30± 20km (shown in Supplementary Fig. 8ae, respectively).
The second additional process that we tested was the effect of an early surface ocean (Sup-plementary Information, section S6.2). The presence of this ocean would further reduce the value
of the matching intrinsic activation energies to E⇤
disl ⇠= 220± 15 kJ/mol, and reduce the value of
present-day crustal thickness to 33 km ±2 km. In addition, the presence of an ocean would imply a very weak pressure dependence of the viscosity, or the complete absence of pressure-dependent viscosity (Supplementary Fig. 9a).
Overall, and despite uncertainties, these early potential complexities do not change the re-quirement for a ‘sluggish Martian mantle that deforms under the dislocation creep mechanism. Ad-ditionally, our approach allows us to constrain the initial thermal state of Mars. Within the range of matching activation volumes, we found that the initial value for Tm is between 1,700 K and 1,900 K (Fig. 3f). However, this range gradually reduces to 1,700-1,800 K for the largest acceptable values
of activation volume (Fig. 3g-h). The matching range for T c0is related to the corresponding
match-ing range for T m0. This can approximately be described as Tc0 = min(Tm0+200±100 K, 2300 K).
The lower-end value underlines the fact that some initial positive temperature difference between the core and the mantle is required to drive an early dynamo. On the other hand, initial core
0.000 0.005 0.010
Fraction of matching solution [%]
0 1 2 3 4 5 6
Effective activation volume, V* [cm3/mol]
0.000 0.005 0.010
Fraction of matching solution [%]
22 23 Log 10 (η 0 [Pa s]) 22 23 Log 10 (η 0 [Pa s]) 250 300 350 E * disl [kJ/mol/K] 0.0 3.5 7.0 10.5 14.0 17.5 21.0
Activation volume in dislocation creep, V*
disl [cm3/mol] 18 19 20 21 22 Surface flux [mW/m 2] 0 1 2 3 4 5 6
Effective activation volume, V* [cm3/mol]
18 19 20 21 22 Surface flux [mW/m 2] 0 20 40 60 80 Crustal thickness [km] 0 20 40 60 80 Crustal thickness [km] 0.0 3.5 7.0 10.5 14.0 17.5 21.0
Activation volume in dislocation creep, V*
disl [cm3/mol]
Min−Max range Standard deviation RMS value Matching solutions exist No matching solution (a) (b) (c) (d) (e) 21 22 23 Log10(η0 [Pa s]) (f) V* disl = 0 cm3/mol 240 300 360 420 E * disl [kJ mol − 1 K − 1] 21 22 23 Log10(η0 [Pa s]) (f) V* disl = 0 cm3/mol 21 22 23 Log10(η0 [Pa s]) (g) V* disl = 7 cm3/mol Larger T c, T
m, and heat flow Larger D cr 21 22 23 Log10(η0 [Pa s]) (g) V* disl = 7 cm3/mol 60 80 100 120 E * [kJ mol − 1 K − 1] 21 22 23 Log10(η0 [Pa s]) (h) V* disl = 10.5 cm3/mol 21 22 23 Log10(η0 [Pa s]) (h) V* disl = 10.5 cm3/mol Tm0=1700K Tm0=1800K Tm0=1900K Tm0=2000K
Matching solution Non−matching solution
Figure 3: Results from the exploration of Mars-Phobos’ thermal-orbital evolution. (a-e) Statistics of present-day and time-averaged quantities of the matching solutions for the entire parameter space considered. (f-h) matching solutions as a function of the initial mantle thermal state, Tm0, and mantle rheological parameters. Red and green arrows indicate the directions toward higher values of present-day crustal thickness, and surface heat flow, respectively. These directions concern the areas of matching solutions, and are unaffected by the lower and larger values of effective activation volume explored.
17
Figure 3: Results from the exploration of Mars-Phobos’ thermal-orbital evolution. | (a-e) Statistics of present-day and time-averaged quantities of the matching solutions for the entire pa-rameter space considered. (f-h) matching solutions as a function of the initial mantle thermal state,
Tm0, and mantle rheological parameters. Red and green arrows indicate the directions toward
higher values of present-day crustal thickness, and surface heat flow, respectively. These direc-tions concern the areas of matching soludirec-tions, and are unaffected by the lower and larger values of effective activation volume explored.
peratures that are too hot yield large-scale deep mantle partial melting during the past four billion years of Martian thermochemical evolution. These melting events markedly lower the Q value of Mars (Fig. 1h, Supplementary Information, section S1), which would force Phobos to have reached the synchronous limit well outside of the first 500 Myr of the history of Mars (Fig. 1g,). Within the
matching area, T m0, T c0 and the surface heat flow increase when diagonally crossing the space
(E⇤and ⌘
0) (Fig. 1a-c, along the direction of the green arrow in Fig. 3). Interestingly, the predicted
present-day crustal thickness (Dcr) does not vary along this direction (Fig. 1d), but is instead most
sensitive to changes in E⇤ and ⌘
0 when moving perpendicular to this direction (Fig. 1d, red arrow
in Fig. 3). When better-constrained by future observations, these markedly different sensitivities of heat flux and crustal thickness will allow us to refine estimates of the mantle rheology of Mars. Conversely, if the predictions of our model do not provide a reasonable match for future data, this could indicate that the thermal-orbital framework that we have considered (Supplementary Infor-mation) may itself have to be refined. This could also reveal that the convecting mantle of Mars is compositionally heterogeneous, and may have evolved as distinct convecting layers during a large
part of the history of Mars31. A further possibility is that a mismatch between our predictions and
future data could point towards an origin for Phobos20that is different from the in situ scenario we
considered.
The InSight mission aims to improve our understanding of the crustal thickness and surface
heat flux of Mars using seismic recordings32 and heat flow measurements33, and will attempt to
measure the gravimetric factor of the tide generated by Phobos. These data, when combined with the thermalorbital considerations discussed here, have the potential to considerably improve our understanding of the thermal history of Mars, as well as of its present-day structure and rheology.
1. Hartmann, W. K. et al. Danielson, E., James, P., and Veverka, J. Evidence for recent volcanism
on Mars from crater counts. Nature397, 586–589 (1999).
2. Schubert, G., Turcotte, D., and Olson, P. Mantle convection in the Earth and Planets. Cam-bridge University Press, CamCam-bridge (2001).
3. Rosenblatt, P. et al. Accretion of Phobos and Deimos in an extended debris disc stirred by
transient moons. Nature Geosci.9, 581–583 (2016).
4. Karato, S.-I. Deformation of Earth Materials: An Introduction to the Rheology of Solid Earth. Cambridge University Press (2008).
5. Hauck, S. A. and Phillips, R. J. Thermal and crustal evolution of Mars. J. Geophys. Res.107
E7 (2002).
6. Grott, M. and Breuer, D. The evolution of the martian elastic lithosphere and implications for
crustal and mantle rheology. Icarus193, 503–515 (2008).
7. Mitrovica, J. X. Haskell [1935] revisited. J. Geophys. Res.101, 555–569 (1996).
8. Cordier, P., Amodeo, J., and Carrez, P. Modelling the rheology of MgO under Earth’s mantle
pressure, temperature and strain rates. Nature481, 177–180 (2012).
9. Raterron, P., et al. Multiscale modeling of upper mantle plasticity: From single-crystal rheology
to multiphase aggregate deformation. Phys. Earth. Pl. Int.228, 232–243 (2014).
10. Girard, J., Chen, J., Raterron, P., and Holyoke, C. W. Hydrolytic weakening of olivine at mantle pressure: Evidence of [100](010) slip system softening from single-crystal deformation
experiments. Phys. Earth. Pl. Int.216, 12–20 (2013).
11. Treiman, A. H., Gleason, J. D., and Bogard, D. The SNC meteorites are from Mars. Planet.
Sp. Sci.48, 1213–1230 (2000).
12. Kaula, W. M. Tidal Dissipation by Solid Friction and the Resulting Orbital Evolution. Rev.
Geophys. Space Phys.2, 661–685 (1964).
13. Jackson, I., Fitz Gerald, J. D., Faul, U. H., and Tan, B. H. Grain-size-sensitive seismic wave
attenuation in polycrystalline olivine. J. Geophys. Res.107:2360 (2002).
14. Rosenblatt, P. The origin of the Martian moons revisited. Astron. and Astrophys. Rev., 19,
1–26 (2011).
15. Black, B. A. and Mittal, T. The demise of Phobos and development of a Martian ring system.
16. Peale, S. J. Origin and evolution of the natural satellites. Ann. Rev. Astron. Astrophys. 37, 533–602 (1999).
17. Mignard, F. Evolution of the Martian satellites. Mon. Notices Royal Astron. Soc.194, 365–379
(1981).
18. Burns, J. A. Contradictory clues as to the origin of the Martian moons. In M. George, editor, Mars, pages 1283–1301. University of Arizona Press (1992).
19. Szeto, A. M. K. Orbital evolution and origin of the Martian satellites. Icarus, 55, 133–168
(1983).
20. Hesselbrock, A. J. and Minton, D. A. An ongoing satellite–ring cycle of Mars and the origins
of Phobos and Deimos. Nature Geosci.10, 266–269 (2017).
21. Hyodo, R., Genda, H., Charnoz, S., and Rosenblatt, P. On the Impact Origin of Phobos and
Deimos. I. Thermodynamic and Physical Aspects. ApJ845:125, (2017).
22. Baratoux, D., Toplis, M., Monnereau, M., and Gasnault, O. Thermal history of Mars inferred
from orbital geochemistry of volcanic provinces. Nature472, 338–341 (2011).
23. Connerney, J. E. P., et al. Mars crustal magnetism. Sol. Sys. Res.11, 1–32 (2004).
24. Zharkov, V. N. and Gudkova, T. V. Construction of Martian Interior Model. Sol. Sys. Res.39,
343–373 (2005).
25. Konopliv, A. S., Park, R. S., and Folkner, W. M. An improved JPL Mars gravity field and
orientation from Mars orbiter and lander tracking data. Icarus274, 253–260 (2016).
26. Lognonn´e, P. and Mosser, B. Planetary Seismology. Surveys in Geophysics 14, 239–302
(1993).
27. Breuer, D. and Spohn, T. Early plate tectonics versus single-plate tectonics on Mars: Evidence
from magnetic field history and crust evolution. J. Geophys. Res.108:5072 (2003).
28. Christensen, U. R. Convection in a variable-viscosity fluid: Newtonian versus power-law
rheology. Earth Planet. Sci. Lett.64, 153–162 (1983).
29. Kiefer, W. S. and Li, Q. Water undersaturated mantle plume volcanism on present-day Mars.
Met. Planet. Sci.51, 1993–2010 (2016).
30. Thiriet, M., Michaut, C., Breuer, D., and Plesa, A.-C. Hemispheric Dichotomy in Lithosphere Thickness on Mars Caused by Differences in Crustal Structure and Composition. J. Geophy.
Res.: Planets123, 823–848 (2018).
31. Maurice, M. et al. Onset of solid-state mantle convection and mixing during magma ocean
solidification. J. Geophy. Res.: Planets122, 577–598 (2017).
32. Lognonn´e, P., et al. SEIS: The Seismic Experiment for Internal Structure of InSight. Space
Sci. Rev.215:12, 1–170 (2019).
33. Spohn, T., et al., The Heat Flow and Physical Properties Package (HP3) for the InSight
Mis-sion. Space Sci. Rev.,214:96, 1–33 (2018).
Acknowledgments
The authors thank S. Charnoz, A. Mocquet, and M. Thiriet for fruitful discussions. M. Thiriet is also gratefully acknowledged for providing her data for the benchmark comparison (Supplemen-tary Fig. 2)). The software for the computation of the elastic Love number was kindly provided by J. Wahr. Numerical computations were performed on the S-CAPAD platform, IPGP, France. V.L.’s research was supported by an appointment to the NASA Postdoctoral Program at the NASA Jet Propulsion Laboratory, California Institute of Technology, administered by Universities Space Re-search Association under contract with NASA. P.L. and M.P. thank CIDER (NSF EAR-1135452) for providing the 2014 summer school environment at KITP UCSB during which an early version of this research was imagined and discussed. Figures were made with the Generic Mapping Tools (P. Wessel and W.H.F. Smith, EOS, Trans. AGU 76 (1995) 329). This is IPGP contribution number 4026 and InSight contribution number 76.
Author contributions
P.L. proposed the original idea. M.P. contributed to the original idea development. P.L. developed and tested the software for the computation of the Love number imaginary part. V.L. and H.S. developed and discussed the orbital evolution model. H.S. developed the thermo-chemical evolu-tion and the seismic models, implemented the computer code for the coupled thermo-chemical and orbital evolution, performed the simulations and data analysis, produced the figures and wrote the paper. All authors discussed the paper and interpreted the results.
Author Information
Reprints and permissions information is available at www.nature.com/reprints. The authors declare no competing financial interests. Readers are welcome to comment on the online version of the paper. Correspondence and requests for materials should be addressed to H. S. (samuel@ipgp.fr). * Code availability The code for computing the thermal and orbital evolutions is available on request from the corresponding author.