HAL Id: hal-00359279
https://hal.archives-ouvertes.fr/hal-00359279
Submitted on 14 Apr 2021
HAL is a multi-disciplinary open access
archive for the deposit and dissemination of
sci-entific research documents, whether they are
pub-lished or not. The documents may come from
teaching and research institutions in France or
abroad, or from public or private research centers.
L’archive ouverte pluridisciplinaire HAL, est
destinée au dépôt et à la diffusion de documents
scientifiques de niveau recherche, publiés ou non,
émanant des établissements d’enseignement et de
recherche français ou étrangers, des laboratoires
publics ou privés.
Islands
Maëlle Connan, Patrick Mayzaud, Colette Trouvé, Christophe Barbraud, Yves
Cherel
To cite this version:
Maëlle Connan, Patrick Mayzaud, Colette Trouvé, Christophe Barbraud, Yves Cherel. Interannual
di-etary changes and demographic consequences in breeding blue petrels from Kerguelen Islands. Marine
Ecology Progress Series, Inter Research, 2004, 373, pp.123-135. �10.3354/meps07723�. �hal-00359279�
INTRODUCTION
The Southern Ocean (south of the Subtropical Front) is marked by high spatial and temporal variability in its primary and secondary productivities which affects the whole pelagic ecosystem. Other characteristics of the Southern Ocean include the diversity, numerical importance and biomass of its populations of air-breathing consumers, with about 363 and 15 million breeding seabirds and seals, respectively (van Franeker et al. 1997). Seabirds and fur seals reproduce on land
and feed at sea and this spatial segregation leads to limited prospecting ranges during the breeding period. Consequently, any oceanographic variation within the feeding area of these central-place foragers could potentially affect their foraging success and, hence, their reproductive output at that time. Indeed, it has long been recognized that the availability of a key-stone foodweb species such as Antarctic krill
Euphau-sia superba determines the breeding success of many
species of seabirds and marine mammals (Croxall et al. 1988). Antarctic krill dominates the pelagic ecosystem
© Inter-Research 2008 · www.int-res.com *Corresponding author. Email: cherel@cebc.cnrs.fr
Interannual dietary changes and demographic
consequences in breeding blue petrels from
Kerguelen Islands
Maëlle Connan
1, 2, Patrick Mayzaud
1, Colette Trouvé
2, Christophe Barbraud
2,
Yves Cherel
2,*
1Université Pierre et Marie Curie-Paris 6, Observatoire Océanologique, Océanographie Biochimique et Ecologie,
UMR 7093 - LOV, BP 28, 06234 Villefranche sur Mer, France
2Centre d’Etudes Biologiques de Chizé, UPR 1934 du CNRS, BP 14, 79360 Villiers-en-Bois, France
ABSTRACT: Interannual variation in summer diet and demographic parameters of blue petrel
Halobaena caerulea were investigated to understand how changes in the marine environment affect
the reproduction of an oceanic seabird from the Southern Ocean. Lipids from stomach oil were used as trophic markers of prey consumed by adult birds when they self-fed during long trips, and conven-tional food analyses allowed determination of the food delivered to chicks after long and short adult foraging trips. Biochemical analysis of stomach oil showed little differences in lipid classes and in fatty acid and fatty alcohol compositions, with most oils deriving from triacylglycerol- and wax ester-rich myctophid fishes over the 4 yr study period (1996, 2000, 2001 and 2002). Accordingly, stomach content analysis showed that chick food was dominated by mass by crustaceans and fish, with myc-tophids as the main fish items. Important interannual variations in chick diet occurred, most promi-nently featuring an almost lack of fish in 2002. Summer 2002 was also marked by the lowest fledging success, lowest mass of chicks at fledging and lowest summer survival of adults during the period 1986–2002. In contrast to 1996, 2000 and 2001, summer months in 2002 were also characterized by an intense warm event in Kerguelen waters. Overall, results strongly suggest causal links between cli-matic anomalies, availability of myctophids and dietary shifts with poor reproductive performance and lower survival in blue petrel. Furthermore, they emphasize the importance of lipid-rich prey in seabird nutrition.
KEY WORDS: Crustacean · Euphausid · Lipids as trophic markers · Myctophid · Seabird · Southern Ocean
in high-Antarctic waters and around South Georgia, located in the southwestern Atlantic. Further north, however, where no Antarctic krill occurs, air-breathing predators target a larger diversity of pelagic organ-isms, including other euphausiids, hyperiid amphipods and mesopelagic fish (Ridoux 1994). The greater com-plexity of these predator–prey relationships is likely to be the reason why trophic mechanisms linked to variations in breeding parameters of subantarctic con-sumers have rarely been investigated (Olsson & van der Jeugd 2002), despite more and more evidence that environmental variability shapes population dynam-ics in subantarctic consumers (Inchausti et al. 2003, Nevoux & Barbraud 2006, Nevoux et al. 2007).
The goal of the present study was to investigate the summer dietary habits and potential demographic con-sequences of their variation in a subantarctic seabird, the blue petrel Halobaena caerulea, breeding at Ker-guelen Islands, southern Indian Ocean. Long-term studies have documented that demographic para-meters of H. caerulea are affected by environmental conditions during both summer and winter, probably reflecting spatio-temporal changes in food availability, a key selective agent (Guinet et al. 1998, Barbraud & Weimerskirch 2003, 2005). During the chick-rearing period, adults use a dual foraging strategy, regularly alternating long trips (LT) to Antarctic waters with short trips (ST) in closer oceanic waters (Chaurand & Weimerskirch 1994, Cherel et al. 2002). They lose mass during ST during which they maximize food delivery to the chick, and gain mass during LT. Consequently, self-feeding during LT is crucial for the success of ST, because most of the energy used during ST is probably derived from that stored during LT (Weimerskirch et al. 2003). In summer, blue petrels feed their chicks on a large diversity of prey species, mainly pelagic swarm-ing crustaceans and schoolswarm-ing mesopelagic fish (Cherel et al. 2002). However, the diet of adult birds when they self-feed during LT remains unknown, but the presence of digested remains of Antarctic krill in LT food samples suggests that krill comprises a large proportion of blue petrel diet. Blue petrels store oil from dietary origin in their stomach during LT only (Cherel et al. 2002). This, together with a much slower passage rate of lipid than aqueous digesta in the stom-ach (Clarke 1989) indicates that oil reflects the diet of adult birds before they collect food for their chicks. Consequently, the biochemical composition of oil was recently tested and used as an efficient tool to investi-gate the food of adult procellariiform seabirds when they feed for themselves (Connan et al. 2005, 2007a,b). In the present work, we studied over 4 yr the diet of blue petrels by using both the conventional method of stomach content analysis and lipids of stomach oil as trophic markers to determine the summer food of
chicks and adult birds, respectively. Demographic consequences of interannual dietary variation were assessed by measuring chick fledging mass, and breeding success and adult survival rate in our long-term study colony during the same 4 yr.
MATERIALS AND METHODS
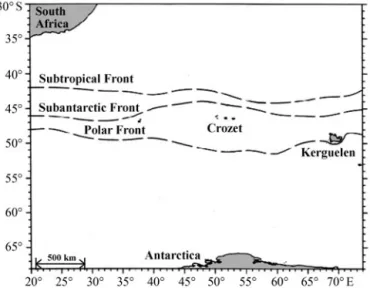
Collection of stomach contents. The diet of blue
petrels breeding at Mayes Island (49° 28’ S, 69° 57’ E; Kerguelen Archipelago) (Fig. 1) was examined during 4 austral summers (1996, 2000, 2001 and 2002). Stom-ach contents were collected from 118 adults using either the water-offloading method (Wilson 1984) or spontaneous regurgitation during handling. Immedi-ately after sampling, the solid fraction of stomach con-tents was separated from the liquid fraction (oil and water) by gravity. Volumes of oil and water and mass of the solid fraction were then measured. To prevent lipid auto-oxidation, an antioxidant (butylated hydroxy-toluene) was added to the oily fraction. The solid and oily fractions were then frozen (–20°C) until subse-quent analyses in France. Oily fractions were kept at –80°C in the laboratory before lipid analyses.
Stomach oil analyses. Total lipids were
quantita-tively extracted from each of 51 oily fractions recov-ered from 69 LT food samples according to the Bligh & Dyer (1959) method. Crude extracts were placed in chloroform, concentrated under vacuum and stored at –80°C. All samples were then analyzed using the methods described by Connan et al. (2005). Briefly, the proportions of lipid classes were determined with an Iatroscan MKV TH10 thin-layer
chromatography-Fig. 1. Location of Kerguelen Islands and oceanographic fronts in the southwestern Indian Ocean. Front positions
flame-ionization detector (TLC-FID), and after methy-lation (fatty acids [FA] from both wax esters [WE] and triacylglycerols [TAG]) or acetylation (fatty alcohols [FAlc] from WE), FA and FAlc profiles were deter-mined using an Autosystem XL gas chromatograph (Perkin-Elmer) equipped with a polar column Fame-wax (Restek; 30 m length × 0.32 mm internal diameter) and an FID.
Conventional dietary approach. Each solid fraction
was thawed and drained by gravity overnight to sepa-rate the solid items from the residual liquid fraction. In the solid fraction, accumulated items were discarded (squid beaks, squid and fish lenses), while fresh re-mains were divided into broad prey classes (cephalo-pods, crustaceans, fish and others) which were weighed to estimate their proportion by fresh mass in the diet. Then, each prey item was counted and identified to the lowest possible taxon, using published keys (Clarke 1986, Baker et al. 1990, Smale et al. 1995) and our own reference collection.
The abundance of each prey taxon was described by its frequency of occurrence (FO) and numerical impor-tance. FO of a given taxon was calculated as the total number of food samples containing this taxon as a per-centage of the total number of food samples. Numeri-cal importance was Numeri-calculated as the total number of individuals of a given taxon found in all the samples as a percentage of the total number of all prey items ingested in all the food samples.
Statistical analyses. Interannual variability of oil
lipid composition was evaluated using a combination of univariate and multivariate analyses. First, normal-ity (Shapiro-Wilks test) and homogenenormal-ity of variance (Fisher test) were verified to run ANOVA followed by multiple range tests. When normality or homoscedas-ticity were not verified, the non-parametric Kruskal-Wallis test was used to evaluate differences between the 4 yr. Second, forward stepwise discriminant analy-ses (FSDA) were conducted to identify the main FAs and FAlcs discriminating the oils of the 4 yr. Wilk’s λ and the number of observations correctly classified were used to test the significance of the FSDA (F-to enter = 4, F-to remove = 4) to separate among years and to evaluate the performance of the FSDA, respec-tively.
The predator–prey relationship (dietary origin of oils) was approached by linear discriminant analyses (LDA). To achieve meaningful comparisons between FAlc and FA patterns from potential prey species and stomach oils, 3 databases were built using the majority of published studies on subtropical, subantarctic and Antarctic potential prey (databases available on re-quest from M. Connan). They included the main species of meso- and macrozooplankton, micronekton and nekton of the Southern Ocean (details in Connan
et al. 2005), plus the nototheniid Dissostichus
elegi-noides (Wilson 2004), and the myctophids Electrona antarctica, E. carlsbergi, Gymnoscopelus nicholsi, Krefftichthys anderssoni and Protomyctophum bolini,
(authors’ unpubl. data). To investigate the origin of WE recovered in stomach oils, 2 prey databases were con-structed: a WE fatty alcohol database (WEAL database) regrouped 80 FAlc profiles of 9 crustacean and fish species, and a WE fatty acid database (WEAC data-base) compiled 62 FA profiles belonging to 8 potential prey species. The origin of TAG oils was approached through a third database (TAG database) where 17 crustacean, fish and squid species were grouped. The prey species were then classified by LDA based on either FAlc or FA patterns. The outliers were removed from each group a priori defined after verification of the homogeneity of FA or FAlc profiles with the use of Mahalanobis distance and chi-squared tests. The num-ber of descriptors considered in the LDA was limited to the data available in the literature: 8, 17 and 16 descriptors for WEAL, WEAC and TAG databases, respectively. Stomach oils, used as supplementary observations and thus not integrated in the definition of discriminant functions (DF), were then attributed to a pre-existing prey group with a classification model built from prey patterns. As normality was presup-posed for most of these analyses, percentages were normalised using the arcsine transformation (Zar 1996).
Demographic parameters. Data on breeding
perfor-mances and demographic parameters of blue petrels were obtained from a long-term study (from 1985–86 to 2001–02, hereafter 1986–2002) conducted in the so-called ‘demographic’ colony on Mayes Island (details in Guinet et al. 1998, Barbraud & Weimer-skirch 2003, 2005). A number of measures of the over-all breeding performance were made during each breeding season: (1) breeding success was calculated as the number of chicks fledged from the number of eggs laid, (2) hatching success as the number of eggs hatched from eggs laid, and (3) fledging success as the number of chicks fledged from eggs hatched. Chick body mass was measured year after year at the end of the chick-rearing period, before fledging. Demo-graphic parameters came from capture–mark–recap-ture of adult birds from the study colony. Annual and seasonal adult survival probabilities were estimated using the Cormack-Jolly-Seber model implemented in the MARK computer program (White & Burnham 1999). Adult survival estimates were modeled as in Barbraud & Weimerskirch (2003), starting with a model in which season and time dependence in both survival and recapture probabilities adjusted for trap depen-dence. Annual survival was defined as the probability of survival from November of Year t to November of Year t + 1, summer survival as the probability of
sur-vival from November of Year t to April of Year t + 1, and subsequent winter survival as the probability of survival from April of Year t + 1 to November of Year t + 1.
RESULTS
A total of 118 birds were caught during the 4 yr. Since the presence of stomach oil and/or Antarctic krill indicates LT (Cherel et al. 2002), adult food samples were divided into 2 groups according to the presence (presumably LT) or absence (presumably ST) of oil and/or Antarctic krill. Forty-nine samples were recov-ered after ST (22, 7, 15 and 5 in 1996, 2000, 2001 and 2002, respectively) and 69 after LT (17, 14, 24 and 14 in 1996, 2000, 2001 and 2002, respectively). Yellow to deep orange oil was collected from 51 LT samples (13, 13, 12 and 13 in 1996, 2000, 2001 and 2002, respec-tively). The volume of stomach oil tended to be lower in 1996 and 2002 than in 2000 and 2001 (2.1 ± 2.6, 5.2 ± 4.9, 4.0 ± 3.0 and 2.7 ± 1.9 ml, mean ± SD, in 1996, 2000, 2001 and 2002, respectively; Kruskal-Wallis, H = 7.37, p = 0.061).
Interannual variation in oil lipid composition
Lipid class composition
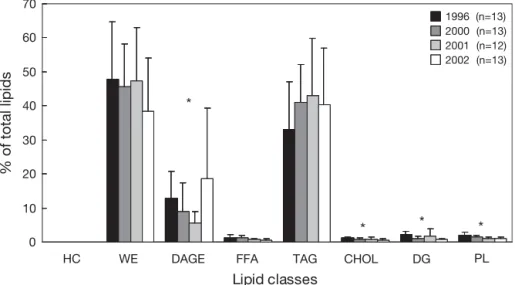
Three neutral lipid classes (TAG, WE and diacylglyc-erol-ethers [DAGE]) dominated in oils (> 90% of total lipids) (Fig. 2). TAG and WE proportions did not differ between years (WE: ANOVA, F3,51 = 1.07, p = 0.370;
TAG: F3,51 = 1.12, p = 0.350), while oils were
signifi-cantly richer in DAGE in 1996 and 2002 (12.8 ± 7.9, 8.9 ± 8.4, 5.6 ± 3.4 and 18.7 ± 20.6% in 1996, 2000, 2001 and 2002, respectively; H = 8.44, p = 0.037). Other lipid classes (hydrocarbons, free FAs, cholesterol, diacyl-glycerols and polar lipids) were absent or present in small amounts only (< 3% of total lipids).
Fatty alcohol and fatty acid profiles
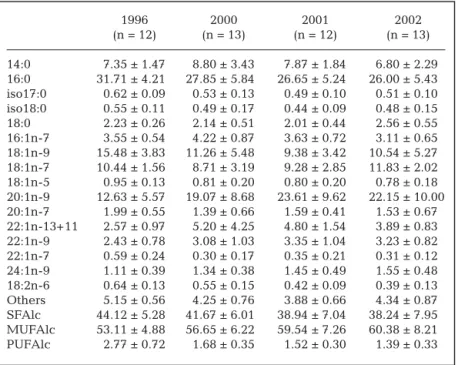
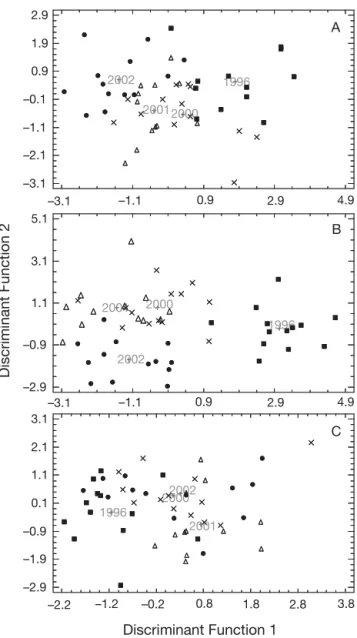
Interannual differences were found in the FAlc and FA profiles of WE- and TAG-oils over the 4 yr. Seven-teen FAlcs were identified in the WE fractions (> 0.5% of total FAlcs) (Table 1). More than half were mono-unsaturated (MUFAlc; 53 to 60%), while saturated FAlcs represented 38 to 44% of the total FAlcs. Very few polyunsaturated FAlcs were identified in the oils. The 4 dominant FAlcs were 16:0, 18:1n-9, 18:1n-7 and 20:1n-9. Using 3 FAlc discriminators (Table 2) (68% of correctly assigned profiles), FSDA showed that oils from 1996 and 2002 were clearly separated from those from 2001 and 2000 (λWilks= 0.273, F = 8.41, p < 0.001)
(Fig. 3A). Oils from 1996 were positively related to DF 1 (79.4% of variability), which was associated with higher 18:2n-6 percentages. DF 2 (17.9% of variability) slightly separated 1996 and 2002 oils (richer in 18:0) from 2000 and 2001 oils. Overall, MUFAlc percentages were significantly higher in 2001 and 2002 than in 1996 and 2000 (H = 8.61, p < 0.05).
In WE fractions, 23 different FAs were identified (Table 3). Profiles were dominated by large amounts of monounsaturated FAs (MUFAs), followed by polyun-saturated (PUFAs) and polyun-saturated (SFAs) FAs. MUFAs
0 10 20 30 40 50 60 70 HC Lipid classes % of total lipids 1996 (n=13) 2000 (n=13) 2001 (n=12) 2002 (n=13)
*
*
*
*
WE DAGE FFA TAG CHOL DG PL
Fig. 2. Halobaena caerulea. Lipid composition (% of total lipids; mean ± SD) of stomach oils. HC: hydrocarbons; WE: wax esters; DAGE: diacylglycerol-ethers; FFA: free fatty acids; TAG: triacylglycerols; CHOL: cholesterol, could include other sterols; DG:
were dominated by 18:1n-9, 16:1n-7, 20:1n-9 and 18:1n-7. WE fractions from 1996 and 2002 were richer in MUFAs (F3,51= 5.33, p < 0.01) and poorer in PUFAs
(H = 29.35, p < 0.001) than those from 2000 and 2001.
FSDA showed that 4 FAs were largely responsible for interannual variation (λWilks= 0.094, F = 14.03, p <
0.001) (Fig. 3B), and these 4 FA discriminators correctly assigned 80.4% of individuals (Table 2). The first DF (75.1% of variability) separated oils from 1996 from those from the 3 other years, while the second DF (23.1% of variability) isolated most of the 2002 oils. Oils from 2002 were significantly poorer in 22:6n-3 (H = 27.97, p < 0.001) and 20:5n-3 (F3,51 = 8.14, p < 0.001)
than 2000 and 2001 oils.
Eighteen different FAs were found at levels exceeding traces (> 0.5% by mass) in TAG fractions (Table 4). MU-FAs dominated over both SMU-FAs and PUFAs. Two FAs dominated by mass: the oleic (18:1n-9) and palmitic (16:0) acids, followed by 18:1n-7, 20:1n-9, 16:1n-7, 14:0 and 20:5n-3. All together, these 7 FAs accounted for 76 to 79% of total FAs. FSDA indicated little inter-annual variation (λWilks = 0.532, F =
5.69, p < 0.001), with only 51% cases correctly assigned using 2 FA variables (85 and 75% cases correctly assigned for 1996 and 2001 oils, respectively) (Table 2). The first DF accounted for 71.3% of variability, and separated 1996 oils (poorer in 20:1n-7, H = 13.38, p < 0.01) from those from the 3 other
1996 2000 2001 2002 (n = 12) (n = 13) (n = 12) (n = 13) 14:0 7.35 ± 1.47 8.80 ± 3.43 7.87 ± 1.84 6.80 ± 2.29 16:0 31.71 ± 4.21 27.85 ± 5.84 26.65 ± 5.24 26.00 ± 5.43 iso17:0 0.62 ± 0.09 0.53 ± 0.13 0.49 ± 0.10 0.51 ± 0.10 iso18:0 0.55 ± 0.11 0.49 ± 0.17 0.44 ± 0.09 0.48 ± 0.15 18:0 2.23 ± 0.26 2.14 ± 0.51 2.01 ± 0.44 2.56 ± 0.55 16:1n-7 3.55 ± 0.54 4.22 ± 0.87 3.63 ± 0.72 3.11 ± 0.65 18:1n-9 15.48 ± 3.83 11.26 ± 5.48 9.38 ± 3.42 10.54 ± 5.27 18:1n-7 10.44 ± 1.56 8.71 ± 3.19 9.28 ± 2.85 11.83 ± 2.02 18:1n-5 0.95 ± 0.13 0.81 ± 0.20 0.80 ± 0.20 0.78 ± 0.18 20:1n-9 12.63 ± 5.57 19.07 ± 8.68 23.61 ± 9.62 22.15 ± 10.00 20:1n-7 1.99 ± 0.55 1.39 ± 0.66 1.59 ± 0.41 1.53 ± 0.67 22:1n-13+11 2.57 ± 0.97 5.20 ± 4.25 4.80 ± 1.54 3.89 ± 0.83 22:1n-9 2.43 ± 0.78 3.08 ± 1.03 3.35 ± 1.04 3.23 ± 0.82 22:1n-7 0.59 ± 0.24 0.30 ± 0.17 0.35 ± 0.21 0.31 ± 0.12 24:1n-9 1.11 ± 0.39 1.34 ± 0.38 1.45 ± 0.49 1.55 ± 0.48 18:2n-6 0.64 ± 0.13 0.55 ± 0.15 0.42 ± 0.09 0.39 ± 0.13 Others 5.15 ± 0.56 4.25 ± 0.76 3.88 ± 0.66 4.34 ± 0.87 SFAlc 44.12 ± 5.28 41.67 ± 6.01 38.94 ± 7.04 38.24 ± 7.95 MUFAlc 53.11 ± 4.88 56.65 ± 6.22 59.54 ± 7.26 60.38 ± 8.21 PUFAlc 2.77 ± 0.72 1.68 ± 0.35 1.52 ± 0.30 1.39 ± 0.33 Table 1. Halobaena caerulea. Wax ester fatty alcohol compositions of stomach oils (%; mean ± SD). Others: all fatty alcohols present at < 0.5%; SFAlc: saturated fatty alcohols; MUFAlc: monounsaturated fatty alcohols; PUFAlc:
polyunsatu-rated fatty alcohols
Allocated group Predicted group membership n Fatty alcohols Standardised discriminant 1996 2000 2001 2002 (or acids) used function coefficients
in separation Function 1 Function 2
Wax ester fraction
Fatty alcohols 1996 10 1 0 1 12 18:0 –0.396 1.077 2000 2 6 4 1 13 20:1n-7 1.262 –0.054 2001 0 2 7 3 12 18:2n-6 0.755 0.887 2002 1 0 1 11 13 Fatty acids 1996 12 1 0 0 13 14:0 –1.130 –0.003 2000 1 8 4 0 13 16:1n-5 1.814 0.067 2001 0 2 9 1 12 18:1n-5 –0.751 –0.230 2002 0 0 1 12 13 22:6n-3 0.173 0.954 Triglyceride fraction Fatty acids 1996 11 1 1 0 13 20:1n-7 0.696 0.723 2000 2 3 3 5 13 22:6n-3 0.775 –0.637 2001 0 3 9 0 12 2002 3 4 3 3 13
Table 2. Halobaena caerulea. Discriminant analyses of stomach oil fatty acid and fatty alcohol data, comparing the years 1996, 2000, 2001 and 2002 (51.0, 80.4 and 68.0% of allocated cases were correctly classified for wax ester fatty alcohol, wax ester fatty
years (Fig. 3C). The second DF discriminated most of the 2001 oils that were significantly richer in 22:6n-3
(F3,51= 6.14, p < 0.01) and 20:5n-3 (H = 11.1, p < 0.05),
and poorer in 18:1n-9 (H = 13.4, p < 0.01).
Dietary origin of stomach oil
Dietary origins of WE- and TAG-oils were investi-gated using LDA. A first LDA was performed using the WEAL database. Nine classes corresponding to the 9 potential prey species were defined a priori: copepods (Calanoides acutus, Paraeuchaeta antarctica,
Rhin-calanus gigas), euphausiids (Euphausia
crystalloro-phias, Thysanoessa macrura) and myctophids (Elec-trona antarctica, Elec(Elec-trona carlsbergi, Gymnoscopelus braueri, Krefftichthys anderssoni). The first DF,
repre-senting 69% of total variance, contrasted between
Electrona carlsbergi and T. macrura, which have high
percentages of 18:1n-9, and Euphausia
crystalloro-phias, R. gigas and P. antarctica, which are marked by
high levels of 14:0 and 16:0. The second DF segregated
C. acutus (with high levels in 16:1, 20:1 and 22:1 FAlc)
from Electrona carlsbergi and Euphausia
crystalloro-phias. Using the classification model calculated from
DF, 100% of prey profiles were correctly assigned. The 50 profiles of oil FAlc were then used as test samples, and prediction of class allocation was achieved with the same model. The results indicated highest proba-bility of grouping with 2 myctophid species Electrona
antarctica and G. braueri for > 80% of FAlc profiles
(Table 5).
The same kind of analysis was performed for the WEAC. Eight similar classes have been defined con-sisting of all of the above species except Electrona
carlsbergi. The first DF (54% of total variance) clearly
separated Thysanoessa macrura (rich in 16:0) from the 7 other classes. The second DF separated E. antarctica (rich in 18:1) from Calanoides acutus. One hundred percent of cases were correctly assigned with this sec-ond model, and the prediction of stomach oil WEAC allocation indicated highest probability of association of > 88% FA profiles with the myctophid Krefftichthys
anderssoni (Table 5).
Comparison of TAG FA patterns of stomach oils with the literature data was performed using 82 FA profiles from 6 crustacean, 9 fish and 2 squid species described by 16 FAs. Four classes of prey were defined in a first LDA: 2 crustacean classes (euphausiids: Euphausia
crystallorophias, Euphausia superba, Euphausia val-lentini; other species: Calanus propinquus, Euchirella rostromagna and Themisto gaudichaudii), 1 fish class
(Dissostichus eleginoides, E. carlsbergi,
Gymno-scopelus nicholsi, Pagothenia borchgrevinki, Proto-myctophum bolini, Trematomus bernacchii, Tremato-mus hansoni, TrematoTremato-mus newnesi and TrematoTremato-mus pennellii), and 1 squid class (Moroteuthis ingens and M. robsoni). The first DF, accounting for 70% of total
variance, clearly separated the fish and squid classes from the crustacean class. The second DF separated the squid class from the fish class, and the euphausiid class from the other crustacean class. With this last model of DF, 100% of the cases were correctly as-signed, and comparison of TAG oil samples with the prey data showed that stomach oils presented the highest probability of grouping with the fish class. A second LDA was then conducted with only fish profiles (56 profiles described by 32 FAs). Nine classes were defined corresponding to the 9 fish species. The first
1996 2000 2001 –2.9 –0.9 1.1 3.1 5.1 2002 1996 2000 2001 –2.2 –2.9 –1.9 –0.9 0.1 1.1 2.1 3.1 2002 1996 2000 2001 –3.1 –3.1 –2.1 –1.1 –0.1 0.9 1.9 2.9 2002 A B C Discriminant Function 1 Di scri m inant Function 2 –1.1 0.9 2.9 4.9 –3.1 –1.1 0.9 2.9 4.9 –1.2 –0.2 0.8 1.8 2.8 3.8
Fig. 3. Halobaena caerulea. Discriminant scores of (A) fatty alcohol and (B) fatty acid fractions of wax esters, and (C) fatty acid fractions of triglycerides from stomach oils (year-group
DF (74% of data variability) separated nototheniids (except D. eleginoides which is poorer in PUFAs) from the 4 other species. This second model cor-rectly classified 100% of fish profiles. Comparisons of TAG oil samples with prey data showed that stomach oils presented the highest probability of grouping with myctophids (G. nicholsi and Electrona carlsbergi with > 72 and 11% of FA profiles, respectively) and nototheniids (D. eleginoides >13% of FA profiles) (Table 5).
No clear interannual variation was observed in the dietary origin of oil WE and TAG over the 4 yr.
Food samples
Long trips
Depending on year, mean (± SD) mass of LT food samples ranged from 15.3 ± 6.5 to 24.3 ± 5.1 g, with lower
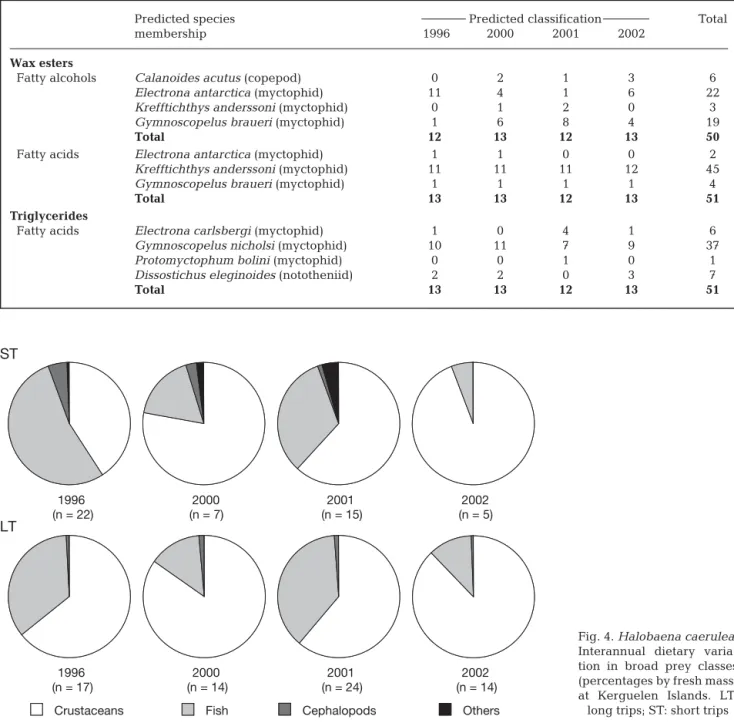
sample mass in 2000 (H = 16.67, p < 0.001). Chick diet was dominated by fresh mass by crustaceans every year, but more fish (about 30%) was con-sumed in 1996 and 2001 than in 2000 and 2002 (Fig. 4). Cephalopods and other organisms were minor items.
A total of 17 878 prey belonging to 63 taxa were recovered from the 69 LT food samples. By number, blue petrel diet was dominated by crustaceans that accounted for > 99% of the total number of prey. Chick food was al-most identical in 1996, 2000 and 2001, with the euphausiid Thysanoessa
ma-crura /vicina being by far the main
crustacean prey (> 86%), and Antarc-tic krill occurring in a significant num-ber of food samples (FO > 62%). In 2002, however, Thyanoessa macrura/
vicina was partly replaced by the
hyperiid amphipod Themisto
gaudi-chaudii (67 and 31%, respectively),
and Antarctic krill was rarely identi-fied (FO = 29%) and occurred in smaller numbers (<1% versus 2–4%). Fish were found in 71% of LT food samples. The fish diet was dominated
1996 2000 2001 2002 (n = 13) (n = 13) (n = 12) (n = 13) 14:0 6.60 ± 2.04 5.04 ± 1.38 6.15 ± 1.65 5.16 ± 1.42 16:0 13.63 ± 1.92 12.70 ± 1.64 14.51 ± 1.98 13.35 ± 2.06 18:0 2.04 ± 0.33 2.12 ± 0.55 2.04 ± 0.28 2.25 ± 0.60 16:1n-7 8.45 ± 1.77 7.62 ± 1.69 8.38 ± 1.28 8.07 ± 1.57 18:1n-9 27.35 ± 1.75 26.90 ± 5.89 22.55 ± 2.23 26.67 ± 5.01 18:1n-7 9.92 ± 1.61 9.02 ± 2.10 8.75 ± 2.03 8.73 ± 2.23 18:1n-5 0.61 ± 0.11 0.72 ± 0.14 0.69 ± 0.10 0.68 ± 0.13 20:1n-9 7.70 ± 3.21 9.13 ± 1.73 7.81 ± 2.16 8.80 ± 2.03 20:1n-7 0.56 ± 0.16 0.84 ± 0.25 0.72 ± 0.20 0.81 ± 0.22 22:1n-13+11 1.71 ± 0.75 2.53 ± 1.09 2.45 ± 1.24 2.76 ± 1.15 22:1n-9 1.69 ± 0.50 2.10 ± 0.56 1.90 ± 0.78 2.06 ± 0.75 24:1n-11 0.43 ± 0.27 0.39 ± 0.19 0.46 ± 0.24 0.55 ± 0.34 24:1n-9 0.76 ± 0.28 0.77 ± 0.20 0.87 ± 0.30 0.84 ± 0.30 18:2n-6 1.39 ± 0.29 1.38 ± 0.62 1.28 ± 0.25 1.19 ± 0.33 18:4n-3 0.53 ± 0.15 0.63 ± 0.31 0.67 ± 0.09 0.45 ± 0.10 20:5n-3 5.21 ± 1.63 5.68 ± 1.48 7.17 ± 1.32 5.30 ± 1.32 22:5n-3 0.36 ± 0.14 0.57 ± 0.24 0.66 ± 0.48 0.51 ± 0.15 22:6n-3 3.50 ± 1.11 4.11 ± 1.00 5.39 ± 1.12 4.09 ± 1.28 Others 7.57 ± 0.83 7.74 ± 0.96 7.54 ± 0.38 7.74 ± 1.10 SFA 24.46 ± 3.77 22.12 ± 3.17 24.72 ± 3.30 23.04 ± 3.70 MUFA 60.82 ± 4.65 61.61 ± 3.65 56.21 ± 3.67 61.63 ± 4.34 PUFA 14.38 ± 3.25 15.68 ± 2.82 18.61 ± 2.52 14.78 ± 2.77 Table 4. Halobaena caerulea. Triacylglycerol fatty acid composition of stomach oils (%; mean ± SD). Others: all fatty acids present at < 0.5%; SFA: saturated fatty acids; MUFA: monounsaturated fatty acids: PUFA: polyunsaturated
fatty acids 1996 2000 2001 2002 (n = 13) (n = 13) (n = 12) (n = 13) 14:0 3.82 ± 1.90 3.79 ± 2.11 5.15 ± 3.78 6.30 ± 3.11 16:0 3.57 ± 1.51 3.61 ± 2.22 4.51 ± 2.99 5.42 ± 2.77 18:0 0.48 ± 0.18 0.62 ± 0.44 0.77 ± 0.47 0.88 ± 0.46 14:1n-7 0.49 ± 0.10 0.34 ± 0.13 0.43 ± 0.15 0.54 ± 0.17 16:1n-7 17.17 ± 1.92 15.21 ± 1.23 14.54 ± 1.14 14.57 ± 2.13 16:1n-5 0.57 ± 0.08 0.38 ± 0.10 0.38 ± 0.08 0.46 ± 0.08 17:1 0.58 ± 0.06 0.59 ± 0.06 0.70 ± 0.31 0.59 ± 0.09 18:1n-9 39.79 ± 2.98 32.47 ± 8.36 32.46 ± 5.30 38.04 ± 6.74 18:1n-7 6.58 ± 0.48 6.09 ± 2.17 6.11 ± 1.07 7.49 ± 1.29 18:1n-5 0.59 ± 0.08 0.56 ± 0.16 0.67 ± 0.10 0.74 ± 0.11 20:1n-9 6.15 ± 0.88 6.67 ± 1.47 7.44 ± 1.35 7.47 ± 2.11 20:1n-7 0.48 ± 0.06 0.59 ± 0.16 0.66 ± 0.20 0.65 ± 0.20 22:1n-13+11 2.60 ± 0.67 3.08 ± 1.42 2.72 ± 0.73 2.48 ± 0.68 22:1n-9 1.79 ± 0.43 1.55 ± 0.24 1.54 ± 0.46 1.44 ± 0.41 18:2n-6 1.96 ± 0.66 2.08 ± 0.49 1.70 ± 0.18 1.88 ± 0.53 16:4n-1 0.17 ± 0.10 1.09 ± 1.28 0.64 ± 0.43 0.10 ± 0.14 18:4n-3 0.71 ± 0.29 1.86 ± 1.32 1.34 ± 0.64 0.35 ± 0.23 20:4n-6 0.34 ± 0.14 0.52 ± 0.29 0.42 ± 0.16 0.33 ± 0.07 20:4n-3 0.34 ± 0.10 0.60 ± 0.32 0.52 ± 0.15 0.31 ± 0.11 20:5n-3 4.24 ± 2.78 8.86 ± 5.08 8.04 ± 3.63 3.08 ± 1.90 22:5n-3 0.22 ± 0.06 0.54 ± 0.51 0.42 ± 0.17 0.18 ± 0.08 22:6n-3 2.21 ± 0.88 3.18 ± 0.75 3.47 ± 1.40 1.34 ± 0.67 Others 5.15 ± 0.43 5.70 ± 0.49 5.36 ± 0.42 5.33 ± 0.66 SFA 9.29 ± 3.76 9.27 ± 4.88 11.49 ± 7.44 14.27 ± 6.59 MUFA 77.97 ± 5.28 68.69 ± 8.57 68.72 ± 6.80 75.60 ± 8.32 PUFA 12.58 ± 4.97 21.78 ± 9.68 19.49 ± 6.32 9.94 ± 3.24 Table 3. Halobaena caerulea. Wax ester fatty acid compositions of stomach oils (%; mean ± SD). Others: all fatty acids present at < 0.5%; SFA: saturated fatty acids; MUFA: monounsaturated fatty acids: PUFA: polyunsaturated fatty acids
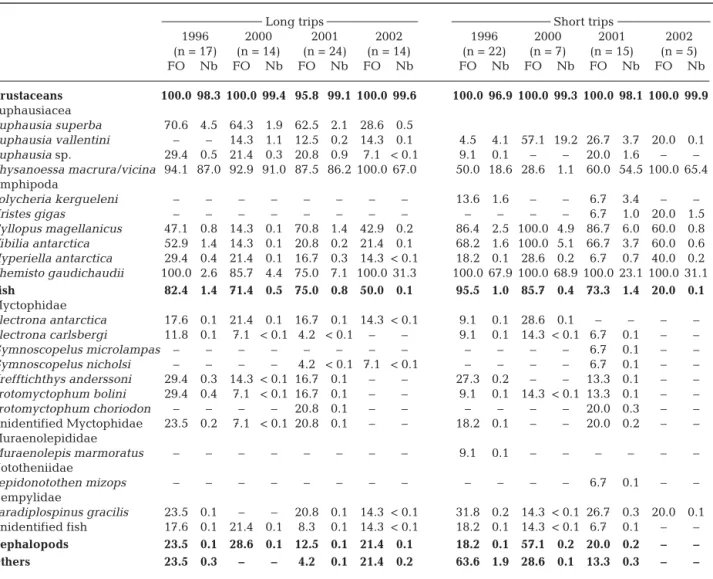
by myctophids, including Electrona antarctica,
Krefftichthys anderssoni and Protomyctophum bolini,
and by the gempylid Paradiplospinus gracilis (Table 6).
Short trips
The wet mass of the 49 ST samples averaged 14 g (from 8.8 ± 2.3 to 21.1 ± 5.2 g, mean ± SD), with signif-icant differences between years (F3,49= 7.71, p < 0.001,
2002 = 2001 < 1996 < 2000). Crustaceans dominated
the diet by mass every year, except 1996 during which fish ranked first and crustaceans second (54 and 41% by mass, respectively). Fish was a minor item (6%) in 2002 (Fig. 4).
A total of 8750 prey belonging to 43 taxa were recov-ered from the ST food samples. Again crustaceans dominated the diet (> 96% by number). Thyanoessa
macrura/vicina and T. gaudichaudii were the 2 main
crustacean prey, with the former dominating in 2001 and 2002, and the latter in 1996 and 2000. The dietary importance of subantarctic krill Euphausia vallentini
Predicted species Predicted classification Total
membership 1996 2000 2001 2002
Wax esters
Fatty alcohols Calanoides acutus (copepod) 0 2 1 3 6
Electrona antarctica (myctophid) 11 4 1 6 22
Krefftichthys anderssoni (myctophid) 0 1 2 0 3
Gymnoscopelus braueri (myctophid) 1 6 8 4 19
Total 12 13 12 13 50
Fatty acids Electrona antarctica (myctophid) 1 1 0 0 2
Krefftichthys anderssoni (myctophid) 11 11 11 12 45
Gymnoscopelus braueri (myctophid) 1 1 1 1 4
Total 13 13 12 13 51
Triglycerides
Fatty acids Electrona carlsbergi (myctophid) 1 0 4 1 6
Gymnoscopelus nicholsi (myctophid) 10 11 7 9 37
Protomyctophum bolini (myctophid) 0 0 1 0 1
Dissostichus eleginoides (nototheniid) 2 2 0 3 7
Total 13 13 12 13 51
Table 5. Halobaena caerulea. Predicted species classification from linear discriminant analyses
ST 1996 (n = 22) 2000 (n = 7) 2001 (n = 15) 2002 (n = 5) LT 1996 (n = 17) 2000 (n = 14) 2001 (n = 24) 2002 (n = 14) Crustaceans Fish Cephalopods Others
Fig. 4. Halobaena caerulea. Interannual dietary varia-tion in broad prey classes (percentages by fresh mass) at Kerguelen Islands. LT:
greatly varied between years, being a main item in 2000 and almost absent in 2002. The latter year was also marked by very low numbers (<1%) of the amphipods Cyllopus magellanicus and Vibilia
antarc-tica. Fish prey during ST again included mostly
mesopelagic fish with the gempylid Paradiplospinus
gracilis and various myctophids (Krefftichthys anders-soni, Protomyctophum spp. and Electrona spp.). The
only identified fish item from the 2002 food samples was Paradiplospinus gracilis (Table 6).
Demographic parameters
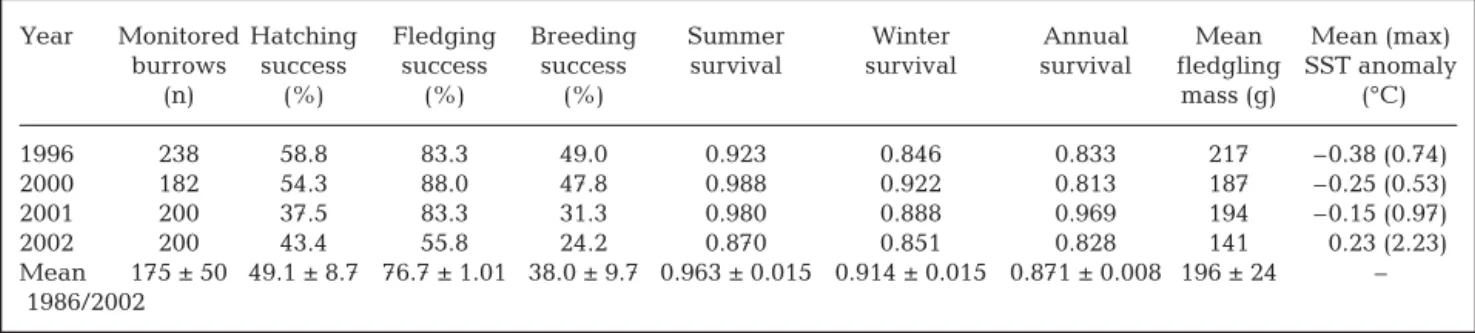
Hatching, fledging and breeding success of blue petrels averaged 49, 77 and 38%, respectively, and they all showed interannual variations over the 17 yr study period (1986–2002; χ2
16= 83.5, 134.7 and 100.9,
all p < 0.01). Within the 4 yr of the dietary investigation
and when compared to other years, 2002 was notice-ably marked by the lowest breeding success (24%), which was due to the lowest fledging success (56%) ever recorded during the 17 yr study period. Summer 2002 was also characterized by the lowest mass of chicks at fledging (ANOVA over 1989–2002, F13,555=
17.292, p < 0.0001, with post hoc Tukey HSD multiple comparison tests showing that 2002 was different from 1996, 2000 and 2001, all p < 0.0001) and the lowest summer survival of adults (0.870, average survival = 0.963) recorded during the study period (Table 7).
DISCUSSION
Stomach oil and fresh portions of food samples are indicators of prey items mainly caught at different time scales, and thus on different foraging zones. Stomach oil reflects the adult diet when they self-feed
Long trips Short trips
1996 2000 2001 2002 1996 2000 2001 2002 (n = 17) (n = 14) (n = 24) (n = 14) (n = 22) (n = 7) (n = 15) (n = 5) FO Nb FO Nb FO Nb FO Nb FO Nb FO Nb FO Nb FO Nb Crustaceans 100.0 98.3 100.0 99.4 95.8 99.1 100.0 99.6 100.0 96.9 100.0 99.3 100.0 98.1 100.0 99.9 Euphausiacea Euphausia superba 70.6 4.5 64.3 1.9 62.5 2.1 28.6 0.5 Euphausia vallentini – – 14.3 1.1 12.5 0.2 14.3 0.1 4.5 4.1 57.1 19.2 26.7 3.7 20.0 0.1 Euphausia sp. 29.4 0.5 21.4 0.3 20.8 0.9 7.1 < 0.1 9.1 0.1 – – 20.0 1.6 – – Thysanoessa macrura/vicina 94.1 87.0 92.9 91.0 87.5 86.2 100.0 67.0 50.0 18.6 28.6 1.1 60.0 54.5 100.0 65.4 Amphipoda Polycheria kergueleni – – – – – – – – 13.6 1.6 – – 6.7 3.4 – – Uristes gigas – – – – – – – – – – – – 6.7 1.0 20.0 1.5 Cyllopus magellanicus 47.1 0.8 14.3 0.1 70.8 1.4 42.9 0.2 86.4 2.5 100.0 4.9 86.7 6.0 60.0 0.8 Vibilia antarctica 52.9 1.4 14.3 0.1 20.8 0.2 21.4 0.1 68.2 1.6 100.0 5.1 66.7 3.7 60.0 0.6 Hyperiella antarctica 29.4 0.4 21.4 0.1 16.7 0.3 14.3 < 0.1 18.2 0.1 28.6 0.2 6.7 0.7 40.0 0.2 Themisto gaudichaudii 100.0 2.6 85.7 4.4 75.0 7.1 100.0 31.3 100.0 67.9 100.0 68.9 100.0 23.1 100.0 31.1 Fish 82.4 1.4 71.4 0.5 75.0 0.8 50.0 0.1 95.5 1.0 85.7 0.4 73.3 1.4 20.0 0.1 Myctophidae Electrona antarctica 17.6 0.1 21.4 0.1 16.7 0.1 14.3 < 0.1 9.1 0.1 28.6 0.1 – – – – Electrona carlsbergi 11.8 0.1 7.1 < 0.1 4.2 < 0.1 – – 9.1 0.1 14.3 < 0.1 6.7 0.1 – – Gymnoscopelus microlampas – – – – – – – – – – – – 6.7 0.1 – – Gymnoscopelus nicholsi – – – – 4.2 < 0.1 7.1 < 0.1 – – – – 6.7 0.1 – – Krefftichthys anderssoni 29.4 0.3 14.3 < 0.1 16.7 0.1 – – 27.3 0.2 – – 13.3 0.1 – – Protomyctophum bolini 29.4 0.4 7.1 < 0.1 16.7 0.1 – – 9.1 0.1 14.3 < 0.1 13.3 0.1 – – Protomyctophum choriodon – – – – 20.8 0.1 – – – – – – 20.0 0.3 – – Unidentified Myctophidae 23.5 0.2 7.1 < 0.1 20.8 0.1 – – 18.2 0.1 – – 20.0 0.2 – – Muraenolepididae Muraenolepis marmoratus – – – – – – – – 9.1 0.1 – – – – – – Nototheniidae Lepidonotothen mizops – – – – – – – – – – – – 6.7 0.1 – – Gempylidae Paradiplospinus gracilis 23.5 0.1 – – 20.8 0.1 14.3 < 0.1 31.8 0.2 14.3 < 0.1 26.7 0.3 20.0 0.1 Unidentified fish 17.6 0.1 21.4 0.1 8.3 0.1 14.3 < 0.1 18.2 0.1 14.3 < 0.1 6.7 0.1 – – Cephalopods 23.5 0.1 28.6 0.1 12.5 0.1 21.4 0.1 18.2 0.1 57.1 0.2 20.0 0.2 – – Others 23.5 0.3 – – 4.2 0.1 21.4 0.2 63.6 1.9 28.6 0.1 13.3 0.3 – –
Table 6. Halobaena caerulea. Prey species identified from stomach contents of 118 blue petrels at Kerguelen Islands. FO: fre-quency of occurrence; Nb: % by number
far away their breeding grounds during LT, while the fresh portion of food samples includes prey taken for the chicks either on the way back to the colony at the end of LT or during ST. Both biochemical and conven-tional methods are thus complementary and result in new insights on the summer feeding ecology of breeding blue petrels at Kerguelen Islands. Biochemi-cal analysis highlighted the consistent importance of myctophid fish over years in the nutrition of adult birds, while analysis of chick food depicted significant interannual dietary variation leading to demographic consequences on the short-term (fledging mass and fledging success), but also on the medium-term (sum-mer adult survival).
Biochemical analysis of adult stomach oils: importance of myctophid fish
Overall, biochemical analysis showed little inter-annual variation in lipid classes and FAlc and FA com-positions of WE and TAG, suggesting relatively low interannual changes in the diet of adult blue petrels at Kerguelen Islands during LT. In agreement with a pre-vious study conducted in South Georgia (Clarke & Prince 1976), lipid class analysis indicated that birds fed mainly on WE- and TAG-rich prey species during all 4 yr, and that they caught some DAGE-rich prey in 1996 and 2002. WE and TAG are the 2 main forms of lipid storage in marine organisms (Lee et al. 2006), but DAGE is a rare lipid class that, so far, has only been found in some squids and pteropods in the Southern Ocean (Phleger et al. 2001, Phillips et al. 2002). Sea-birds are known to feed on cephalopods but rarely on pteropods (Karnovsky et al. 2008). Accordingly, DAGE from stomach oil was recently found in association with squid remains (Connan et al. 2007a). However, this does not preclude birds feeding on pteropods nor on other DAGE-rich prey species that have yet to be ana-lysed. More detailed biochemical analyses are needed to investigate the trophic origin of DAGE of stomach oils.
Interannual variation in FA composition of WE and TAG and in FAlc composition of WE were underlined by FSDA assigning 51–80% of individual oils to the correct year. Both FAlc and FA compositions of WE grouped oils from 2001 and 2000, with differences between 1996 and 2002 oils, and FA composition of TAG isolated 1996 oils from those from the 3 other years (Fig. 3). For example, 1996 and 2002 oils con-tained less PUFAs (20:5n-3, 22:6n-3) than 2000 and 2001 oils in their WE fraction. Despite these differ-ences, no clear interannual changes were detected in the dietary origin of stomach oils, with most oils deriv-ing from myctophid lipids in all the 4 yr. This mismatch points out the need for much more information on lipid composition of marine organisms (including the differ-ent species of myctophids) and on their spatio-tempo-ral variation to build up a more accurate database to better interpret the FA and FAlc profiles of predators. A myctophid origin of stomach oils of blue petrels is consistent with recent investigations on oils of various procellariiform seabirds, underlining the importance of mesopelagic fish in the nutrition of adult birds when they self-feed (Connan et al. 2005, 2007a,b). Surpris-ingly, no stomach oil fit the lipid patterns of euphausi-ids, including those of the TAG-rich Antarctic krill and of the WE-rich Thysanoessa macrura. The latter spe-cies (and/or the closely-related T. vicina) is the main prey by number of blue petrels at Kerguelen, and digested remains of Antarctic krill commonly occur in LT food samples, suggesting that it is one of the main prey targeted by birds reaching Antarctic waters (Cherel et al. 2002, present study). While our study does not preclude blue petrels feeding on Antarctic krill in the southern Indian Ocean (Ryan & Cooper 1989), it emphasizes a more important role for myc-tophids than previously thought. The only crustacean species whose lipid pattern fits well with those of stom-ach oils was Calanus acutus. Copepods rarely occur in the chick diet at Kerguelen (Cherel et al. 2002, present study), but they are minor dietary items of blue petrels in South Georgia (Prince 1980). Finally, a few stomach oils probably originate from lipids of the Patagonian
Year Monitored Hatching Fledging Breeding Summer Winter Annual Mean Mean (max) burrows success success success survival survival survival fledgling SST anomaly
(n) (%) (%) (%) mass (g) (°C) 1996 238 58.8 83.3 49.0 0.923 0.846 0.833 217 –0.38 (0.74) 2000 182 54.3 88.0 47.8 0.988 0.922 0.813 187 –0.25 (0.53) 2001 200 37.5 83.3 31.3 0.980 0.888 0.969 194 –0.15 (0.97) 2002 200 43.4 55.8 24.2 0.870 0.851 0.828 141 –0.23 (2.23) Mean 175 ± 50 49.1 ± 8.7 76.7 ± 1.01 38.0 ± 9.7 0.963 ± 0.015 0.914 ± 0.015 0.871 ± 0.008 196 ± 24 – 1986/2002
Table 7. Halobaena caerulea. Demographic parameters for the study period. Sea surface temperature (SST) anomalies were averaged over the oceanic sector 48–65° S and 55–85° E for the summer months of December, January and February
toothfish Dissostichus eleginoides. Toothfish is a large species targeted by longliners in Kerguelen waters, but the blue petrel is not a ship-attracted species and it was not observed feeding on fishery waste (Cherel et al. 1996). The FA profile of toothfish TAG is dominated by MUFAs (Wilson 2004), which also compose the majority of FA of TAG-rich myctophids (Saito & Murata 1998, Lea et al. 2002). Consequently, the similarity of some stomach oils with toothfish lipids may be a methodological artifact that again underlines the need for more data on the lipid profiles of myctophids and other marine organisms from the Southern Ocean to better disentangle trophic links.
Conventional analysis of chick food: interannual dietary changes
Stomach content analysis showed that blue petrels fed on a large diversity of prey and that chick food was dominated by mass by crustaceans and fish, with cephalopods and other organisms being minor items (Cherel et al. 2002, present study). Euphausiids and
Themisto gaudichaudii are consistently the major
crus-tacean prey, and mesopelagic fish, including various myctophids, the main fish items at Kerguelen and else-where (Prince 1980, Steele & Klages 1986, Ridoux 1994, Cherel et al. 2002). Noticeably, the importance of WE-rich (e.g. Electrona antarctica, Krefftichthys
anderssoni) and TAG-rich (e.g. E. carlsbergi, Lea et al.
2002, authors’ unpubl. data) fish species fit well with the FA and FAlc compositions of stomach oils indicat-ing feedindicat-ing on myctophids durindicat-ing LT for Kerguelen birds. On the other hand, the main crustacean prey in LT and ST samples, the WE-rich Thysanoessa spp. and the TAG-rich Themisto gaudichaudii, respectively (Nelson et al. 2001, Mayzaud et al. 2003), were not identified from biochemical analyses, suggesting they were less important items than myctophids for the nutrition of adult birds when self-feeding during LT. Important interannual variation in the chick diet occurred in both LT and ST samples. For example, sub-antarctic krill was much more abundant in ST food samples collected in 2000 than in the 4 other years. The most prominent feature, however, was that the chick diet in 2002 was clearly different from 1996, 1998, 2000 and 2001. Overall, adult blue petrels brought back less fish and accordingly more crustaceans to their chicks in 2002. ST samples that year contained more
Thy-anoessa macrura/vicina and less Euphausia vallentini, Cyllopus magellanicus and Vibilia antarctica, while LT
samples included almost no Antarctic krill, less
Thy-anoessa macrura/vicina, but more Themisto gaudi-chaudii (Cherel et al. 2002, present study). All together
the data indicate that 2002 was an unusual foraging
summer for blue petrels rearing chicks, which was probably related to changes in prey availability in the pelagic ecosystem in Kerguelen and Antarctic waters. To our knowledge, such year-to-year dietary variations were not previously found in blue petrels. However, similar changes have been observed in a related spe-cies, the Antarctic prion at South Georgia, where, sur-prisingly and contrary to other seabirds, the poor-krill year had no effect on chick growth rate and survival, or accordingly on breeding success (Liddle 1994). The causes and consequences of the 2002 dietary changes were consequently further investigated in terms of demographic parameters of blue petrels breeding at Kerguelen Islands and of potential relationships with environmental variability in the southern Indian Ocean at that time.
Environment, demography and summer diet of blue petrels
Interannual variability in reproductive performance is a common feature in seabirds, including the blue petrel (Chastel et al. 1995a, Guinet et al. 1998). In blue petrels, breeding success is driven more by hatching success than fledging success, with body condition at the beginning of the breeding cycle determining both reproductive decision and reproductive success (Chas-tel et al. 1995a,b). Within that context, the breeding season of 2002 was unusual, being marked by a low breeding success that mainly resulted from the lowest fledging success on record. Summer 2002 was also characterized by a very low fledgling mass when com-pared with data from the 17 yr study period. All together, poor reproductive output and poor chick body condition strongly suggested poor foraging per-formance of adult blue petrels, and thus a causal link between demographic parameters and dietary changes observed in summer 2002. The main dietary feature was the near lack of mesopelagic fish in both ST and LT food samples, suggesting a substantial decrease in the availability of myctophids during the chick-rearing period in 2002 when compared to other years.
Food availability comprises a complex interaction of factors that integrates abundance, accessibility, taxo-nomic composition and quality of the prey items. No information on mesopelagic fish in Kerguelen waters is available for the study period, but it is likely that a decrease in myctophid abundance and accessibility to foraging flying seabirds occurred in summer 2002. Shifting from a mixed fish/crustacean to an almost exclusively crustacean diet decreased the overall quality of the food. Due to a size effect, single amphi-pods and euphausiids contain less energy than a single fish. Moreover, myctophids are protein- and lipid-rich
organisms; they thus possess a high energy density and are considered as food with a high nutritional quality (Donnelly et al. 1990, Cherel & Ridoux 1992). Indeed, it is well documented worldwide that dietary shifts from lipid-rich fishes to lipid-poor items result in low breeding success and reproductive failure in seabirds (Monaghan 1992, Regehr & Rodway 1999, Takahashi et al. 2001). Moreover, experimental inves-tigations showed that nestlings fed rations of fatty fish experienced higher growth rates than nestlings fed lean items, which could be expected to have effect on pre- and post-fledging survival of nestlings in the wild (Romano et al. 2006).
Interestingly, summer 2002 was also marked by a decrease in survival probability of adult blue petrels. In this species, summer survival is relatively high and varies little between years; consequently, annual sur-vival is driven by changes in winter sursur-vival (Barbraud & Weimerskirch 2003). At Kerguelen, winter survival is linked to climatic factors, being lower during anom-alous warm events (Barbraud & Weimerskirch 2003). Accordingly, in contrast to 1996, 2000 and 2001, sum-mer months in 2002 were characterized by intense pos-itive sea-surface temperature anomalies in Kerguelen waters (Table 7), suggesting that adult survival may also be sensitive to extreme warm events occurring in summer. Data collected in the abnormal summer of 2002 therefore suggest the following sequence of causal events linking environment and seabirds: warm climatic event → lower mesopelagic fish availability → less myctophids in diet and decreased nutritional value of food → higher adult mortality and altered chick growth rate, and thus lower fledging mass and higher chick mortality. A recent investigation linked a major population decrease of blue petrels to an increase in adult winter mortality in response to a long warming event (Barbraud & Weimerskirch 2003). Our data therefore suggests that further modeling must also include summer demographic parameters in order to better depict the effect of climate change on seabird population dynamics (Jenouvrier et al. 2005, Lee et al. 2007).
Acknowledgements. The authors thank the numerous field
workers (including P. Bocher, S. Chamaillé, V. Chartendrault, N. Delelis, C. Vanpé and O. Villa) who collected food samples at Kerguelen Islands, M. Boutoute and R. Cattaneo for help-ing with lipid analyses, C. F. Phleger, P. D. Nichols, M. M. Nelson, K. L. Phillips and G. Wilson for supplying detailed chromatographic data, and P. Bocher for the 1996 dietary data. Fieldwork was supported financially and logistically by both the Institut Paul-Emile Victor (IPEV, Programme No. 109, H. Weimerskirch) and the Terres Australes et Antarctiques Françaises. This research was supported by CNRS through UMR 7093 and UPR 1934, and a doctoral scholarship to M.C. from Paris VI University. Protocols and procedures were approved by the Ethical Committee of the IPEV.
LITERATURE CITED
Baker A de C, Boden BP, Brinton E (1990) A practical guide to the euphausiids of the world. Natural History Museum Publications, London
Barbraud C, Weimerskirch H (2003) Climate and density shape population dynamics of a marine top predator. Proc R Soc Lond B 270:2111–2116
Barbraud C, Weimerskirch H (2005) Environmental condi-tions and breeding experience affect costs of reproduction in blue petrels. Ecology 86:682–692
Bligh EG, Dyer WJ (1959) A rapid method of total lipid extrac-tion and purificaextrac-tion. Can J Biochem Physiol 37:911–917 Chastel O, Weimerskirch H, Jouventin P (1995a) Body condi-tion and seabird reproductive performance: a study of three petrel species. Ecology 76:2240–2246
Chastel O, Weimerskirch H, Jouventin P (1995b) Influence of body condition on reproductive decision and reproductive success in the blue petrel. Auk 112:964–972
Chaurand T, Weimerskirch H (1994) The regular alternation of short and long foraging trips in the blue petrel
Halo-baena caerulea: a previously undescribed strategy of food
provisioning in a pelagic seabird. J Anim Ecol 63:275–282 Cherel Y, Ridoux V (1992) Prey species and nutritive value of food fed during summer to king penguin Aptenodytes
patagonica chicks at Possession Island, Crozet
Archipel-ago. Ibis 134:118–127
Cherel Y, Weimerskirch H, Duhamel G (1996) Interactions between longline vessels and seabirds in Kerguelen waters and a method to reduce seabird mortality. Biol Conserv 75:63–70
Cherel Y, Bocher P, Trouvé C, Weimerskirch H (2002) Diet and feeding ecology of blue petrels Halobaena caerulea at Iles Kerguelen, Southern Indian Ocean. Mar Ecol Prog Ser 228:283–299
Clarke MR (1986) A handbook for the identification of cephalopod beaks. Clarendon, Oxford
Clarke A (1989) Seabirds. In: Ackman RG (ed) Marine bio-genic lipids, fats, and oils, Vol II. CRC Press, Boca Raton, FL, p 383–398
Clarke A, Prince PA (1976) The origin of stomach oil in marine birds: analyses of the stomach oil from six species of sub-antarctic procellariiform birds. J Exp Mar Biol Ecol 23: 15–30
Connan M, Mayzaud P, Boutoute M, Weimerskirch H, Cherel Y (2005) Lipid composition of stomach oil in a procellari-iform seabird Puffinus tenuirostris: implications for food web studies. Mar Ecol Prog Ser 290:277–290
Connan M, Cherel Y, Mabille G, Mayzaud P (2007a) Trophic relationships of white-chinned petrels from Crozet Islands: combined stomach oil and conventional dietary approach. Mar Biol 152:95–107
Connan M, Cherel Y, Mayzaud P (2007b) Lipids from stomach oil of procellariiform seabirds document the importance of myctophid fish in the Southern Ocean. Limnol Oceanogr 52:2445–2455
Croxall JP, McCann TS, Prince PA, Rothery P (1988) Repro-ductive performance of seabirds and seals at South Geor-gia and Signy Island, South Orkney Islands, 1976–1987: implications for Southern Ocean monitoring studies. In: Sahrhage D (ed) Antarctic Ocean and resources variabil-ity. Springer, Berlin, p 261–285
Donnelly J, Torres JJ, Hopkins TL, Lancraft TM (1990) Proxi-mate composition of Antarctic mesopelagic fishes. Mar Biol 106:13–23
Guinet C, Chastel O, Koudil M, Durbec JP, Jouventin P (1998) Effects of warm sea-surface temperature anomalies on the
➤
➤
➤
➤
➤
➤
➤
➤
➤
➤
➤
➤
➤
blue petrel at the Kerguelen Islands. Proc R Soc Lond B Biol Sci 265:1001–1006
Inchausti P, Guinet C, Koudil M, Durbec JP and others (2003) Inter-annual variability in the breeding performance of seabirds in relation to oceanographic anomalies that affect the Crozet and the Kerguelen sectors of the Southern Ocean. J Avian Biol 34:170–176
Jenouvrier S, Barbraud C, Weimerskirch H (2005) Long-term contrasted responses to climate of two Antarctic seabird species. Ecology 86:2889–2903
Karnovsky NJ, Hobson KA, Iverson S, Hunt GL Jr (2008) Sea-sonal changes in diets of seabirds in the North Water Poly-nia: a multiple-indicator approach. Mar Ecol Prog Ser 357: 291–299
Lea MA, Nichols PD, Wilson G (2002) Fatty acid composition of lipid-rich myctophids and mackerel icefish
(Champ-socephalus gunnari): Southern Ocean food-web
implica-tions. Polar Biol 25:843–854
Lee DE, Nur N, Sydeman WJ (2007) Climate and demography of the planktivorous Cassin’s auklet Ptychoramphus
aleu-ticus off northern California: implications for population
change. J Anim Ecol 76:337–347
Lee RF, Hagen W, Kattner G (2006) Lipid storage in marine zooplankton. Mar Ecol Prog Ser 307:273–306
Liddle GM (1994) Interannual variation in the breeding biol-ogy of the Antarctic prion Pachyptila desolata at Bird Island, South Georgia. J Zool (Lond) 234:125–139 Mayzaud P, Boutoute M, Alonzo F (2003) Lipid composition of
the euphausiids Euphausia vallentini and Thysanoessa
macrura during summer in the Southern Indian Ocean.
Antarct Sci 15:463–475
Monaghan P (1992) Seabirds and sandeels: the conflict be-tween exploitation and conservation in the northern North Sea. Biodivers Conserv 1:98–111
Nelson MM, Mooney BD, Nichols PD, Phleger CF (2001) Lipids of Antarctic Ocean amphipods: food chain interac-tions and the occurrence of novel biomarkers. Mar Chem 73:53–64
Nevoux M, Barbraud C (2006) Relationships between sea ice concentration, sea surface temperature and demographic traits of thin-billed prions. Polar Biol 29:445–453
Nevoux M, Weimerskirch H, Barbraud C (2007) Environmen-tal variation and experience-related differences in the demography of the long-lived black-browed albatross. J Anim Ecol 76:159–167
Olsson O, van der Jeugd HP (2002) Survival in king penguins
Aptenodytes patagonicus: temporal and sex-specific effects
of environmental variability. Oecologia 132:509–516 Park YH, Gambéroni L, Charriaud E (1993) Frontal structure,
water masses, and circulation in the Crozet Basin. J Geo-phys Res 98:12361–12385
Phillips KL, Nichols PD, Jackson GD (2002) Lipid and fatty acid composition of the mantle and digestive gland of four Southern Ocean squid species: implications for food-web
studies. Antarct Sci 14:212–220
Phleger CF, Nelson MM, Mooney BD, Nichols PD (2001) Interannual variations in the lipids of the Antarctic ptero-pods Clione limacina and Clio pyramidata. Comp Biochem Physiol B 128:553–564
Prince PA (1980) The food and feeding ecology of blue petrel
(Halobaena caerulea) and dove prion (Pachyptila desolata).
J Zool 190:59–76
Regehr HM, Rodway MS (1999) Seabird breeding perfor-mance during two years of delayed capelin arrival in the Northwest Atlantic: a multi-species comparison. Water-birds 22:60–67
Ridoux V (1994) The diets and dietary segregation of sea-birds at the subantarctic Crozet Islands. Mar Ornithol 22: 1–192
Romano MD, Piatt JF, Roby DD (2006) Testing the junk-food hypothesis on marine birds: effects of prey type on growth and development. Waterbirds 29:407–414
Ryan PG, Cooper J (1989) The distribution and abundance of aerial seabirds in relation to Antarctic krill in the Prydz Bay region, Antarctica, during late summer. Polar Biol 10: 199–209
Saito H, Murata M (1998) Origin of monoene fats in the lipid of midwater fishes: relationship between the lipids of myctophids and those of their prey. Mar Ecol Prog Ser 168: 21–33
Smale MJ, Watson G, Hecht T (1995) Otolith atlas of Southern African marine fishes. Ichthyological monographs, Vol 1. JBL Smith Institute of Ichthyology, Grahamstown Steele WK, Klages NT (1986) Diet of the blue petrel at
sub-Antarctic Marion Island. S Afr J Zool 21:253–256
Takahashi A, Kuroki M, Niizuma Y, Kato A, Saitoh S, Watanuki Y (2001) Importance of the Japanese anchovy
(Engraulis japonicus) to breeding rhinoceros auklets (Cerorhinca monocerata) on Teuri Island, Sea of Japan.
Mar Biol 139:361–371
van Franeker JA, Bathmann UV, Mathot S (1997) Carbon fluxes to Antarctic top predators. Dee-Sea Res II 44: 435–455
Weimerskirch H, Ancel A, Caloin M, Zahariev A, Spagiari J, Kersten M, Chastel O (2003) Foraging efficiency and adjustment of energy expenditure in a pelagic seabird provisioning its chick. J Anim Ecol 72:500–508
White GC, Burnham KP (1999) Program MARK: survival esti-mation from populations of marked animals. Bird Study (Suppl 46):120–138
Wilson G (2004) The lipid composition of Patagonian toothfish from the Macquarie Island region: ecology and dietary implications within a regional food web. PhD thesis, Uni-versity of Tasmania, Hobart
Wilson RP (1984) An improved stomach pump for penguins and other seabirds. J Field Ornithol 55:109–112
Zar JH (1996) Biostatistical analysis, 3rd edn. Prentice Hall, Upper Saddle River, NJ
Editorial responsibility: Hans Heinrich Janssen, Oldendorf/Luhe, Germany
Submitted: May 6, 2008; Accepted: September 2, 2008 Proofs received from author(s): December 12, 2008