HAL Id: hal-00299319
https://hal.archives-ouvertes.fr/hal-00299319
Submitted on 12 Jun 2006
HAL is a multi-disciplinary open access
archive for the deposit and dissemination of
sci-entific research documents, whether they are
pub-lished or not. The documents may come from
teaching and research institutions in France or
abroad, or from public or private research centers.
L’archive ouverte pluridisciplinaire HAL, est
destinée au dépôt et à la diffusion de documents
scientifiques de niveau recherche, publiés ou non,
émanant des établissements d’enseignement et de
recherche français ou étrangers, des laboratoires
publics ou privés.
County from 1351 to 2005
A. Barrera, M. C. Llasat, M. Barriendos
To cite this version:
A. Barrera, M. C. Llasat, M. Barriendos. Estimation of extreme flash flood evolution in Barcelona
County from 1351 to 2005. Natural Hazards and Earth System Science, Copernicus Publications on
behalf of the European Geosciences Union, 2006, 6 (4), pp.505-518. �hal-00299319�
Nat. Hazards Earth Syst. Sci., 6, 505–518, 2006 www.nat-hazards-earth-syst-sci.net/6/505/2006/ © Author(s) 2006. This work is licensed under a Creative Commons License.
Natural Hazards
and Earth
System Sciences
Estimation of extreme flash flood evolution in Barcelona County
from 1351 to 2005
A. Barrera, M. C. Llasat, and M. Barriendos
Department of Astronomy & Meteorology, University of Barcelona, Spain
Received: 4 October 2005 – Revised: 21 February 2006 – Accepted: 13 March 2006 – Published: 12 June 2006
Abstract. Every year, flash floods cause economic losses and major problems for undertaking daily activity in the Cat-alonia region (NE Spain). Sometimes catastrophic damage and casualties occur. When a long term analysis of floods is undertaken, a question arises regarding the changing role of the vulnerability and the hazard in risk evolution. This paper sets out to give some information to deal with this question, on the basis of analysis of all the floods that have occurred in Barcelona county (Catalonia) since the 14th century, as well as the flooded area, urban evolution, impacts and the weather conditions for any of most severe events. With this objec-tive, the identification and classification of historical floods, and characterisation of flash-floods among these, have been undertaken. Besides this, the main meteorological factors as-sociated with recent flash floods in this city and neighbouring regions are well-known. On the other hand, the identification of rainfall trends that could explain the historical evolution of flood hazard occurrence in this city has been analysed. Finally, identification of the influence of urban development on the vulnerability to floods has been carried out. Barcelona city has been selected thanks to its long continuous data se-ries (daily rainfall data sese-ries, since 1854; one of the longest rainfall rate series of Europe, since 1921) and for the accu-rate historical archive information that is available (since the Roman Empire for the urban evolution). The evolution of flood occurrence shows the existence of oscillations in the earlier and later modern-age periods that can be attributed to climatic variability, evolution of the perception threshold and changes in vulnerability. A great increase of vulnerabil-ity can be assumed for the period 1850–1900. The analysis of the time evolution for the Barcelona rainfall series (1854– 2000) shows that no trend exists, although, due to changes in urban planning, flash-floods impact has altered over this time. The number of catastrophic flash floods has dimin-ished, although the extraordinary ones have increased.
Correspondence to: A. Barrera ([email protected])
1 Introduction
Flash floods are a very common feature in Catalonia (North-East of Spain) and, particularly, in Barcelona county (Fig. 1). Every year, during the summer or at the beginning of au-tumn, this kind of floods affects the littoral mountains or the Pyrenees region (Fig. 1), although sometimes they can also occur in spring (Llasat et al., 2003). Usually the maximum accumulated rainfall is less than 100 mm, but instantaneous intensities above 180 mm/h are recorded. This was the case of the last flash flood events recorded on 2 August 2005 and 20 August 2005 in the Maresme and Vall`es (Fig. 1), tourist areas on or near the coast, and characterised by ephemeral river channels that pass through the villages. In both cases more than 50 mm were recorded in just half an hour and a many cars parked in the littoral water courses were swept away, while road and railway traffic was interrupted. Some-times, however, more than 250 mm were recorded in less than 6 h, as in the 25 September 1962 event, when the heavy rain-falls caused overflowing of the Bes`os and Llobregat rivers (Fig. 1), as well as their usually dry tributaries, and destroyed a complete quarter in Rub´ı (a town to the NW of Barcelona city), producing 815 casualties. Those flood cases are not the only ones that show some important differences. Deep analysis of floods produced in the North-Western part of the Mediterranean region (Azzola and Tuia, 1989; Frontero et al., 1997; Radinovic, 1997; Llasat et al., 1999; Legrand et al., 2003; Tamarasso et al., 2005) shows the need for having a classification and characterisation of the different kinds of floods, and particularly flash floods, taking into account not only rainfall and flood features but also the possible damage. The current urbanisation patterns, which result from social-demographic pressure on the Western Mediterranean coast-line, significantly amplifies the social and economic impact of this phenomenon, and sets new challenges for public poli-cies and urban planning (Valarie and Coeur, 2004).
This paper deals with the evolution of flash floods in Barcelona county from the 14th century (because the city
was clear of flood risk in preceding centuries) down to the present day, taking account of the changes that have occurred in the water courses and in urbanisation. First of all, a classi-fication of the floods that affect the region is proposed. Then, the geographic and historical evolution of the city are pre-sented. Once the flash flood events and their related dam-age have been identified, the main climatological features are discussed. Floods that have occurred in other basins have been also considered. Finally, some flash-flood events are presented in order to show the different patterns of human response to those hazards: a) human settlement patterns that take account of natural conditions; b) structural protections (walled perimeters with hydraulic functions); c) living with the natural conditions without taking account of the phenom-ena (urban growth with no planning or precautions); d) non-obstructive structural works (drainage networks and under-ground water reservoirs to regulate overflowing).
2 Classification of floods
A classification of floods should be useful not only for the recent monitored period, but also, from a conceptual point of view, for the non-instrumental period (Br´azdil et al., 2002). In this approach, those prior works, allied with the avail-ability of instantaneous rainfall rate series since 1921 for Barcelona (Llasat, 2001) and 5-min rainfall rate data for the entire Catalonia region since 1996 (Llasat et al., 2005), al-low us to propose the folal-lowing classification of the floods recorded in the region (Llasat, 2006):
– Type 1:Short-lived events (less than 3 h and usually less than 1 h) of very intense precipitation (peaks of rain-fall rate above 180 mm/h) but accumulated rainrain-fall usu-ally less than 100 mm. They are “strongly convec-tive events” for which more than 75% of the accumu-lated rainfall has an intensity of above 35 mm/h (Llasat, 2001). This kind of event requires considerable local at-mospheric instability, and is usually produced by “iso-lated cells” or “multicells” of limited horizontal exten-sion (Rigo and Llasat, 2004) that can produce thunder-storms. Despite their limited extension, they usually develop into an unstable environment that can produce rainfall, strong wind or hail in other zones of Catalonia. They appear during the summer and early autumn and produce “local flash-floods” in short littoral or Pyrenean water courses with considerable slope and characterised by torrential regime and non-permanent flows, with the catchments usually being less than 50 km2. The peak flow is more or less simultaneous with the rainfall peak. Although total flow is not so large, the rise of the flood waters can be considerable due to the narrow river beds, steep catchments and street layouts. Consequently, they can bring road traffic to a standstill, give rise to power cuts, and sweep away cars parked in the littoral water courses or in adjoining streets. Losses of life are usually
the result of the imprudent behaviour of people (e.g. at-tempting to cross the water course or doing adventure sports). This was the case in the flash floods in August 2005, in which one old man died when he tried to cross a torrent.
– Type 2: Episodes of heavy rain sustained for several hours that can produce catastrophic floods due to the daily rainfall amount (usually more than 200 mm) or widespread area (usually more than 2000 km2)of very high above-normal levels. This kind of event requires convective instability with abundant feeding of warm and wet air from low levels, and a mechanism to force air ascent to release the potential instability or to desta-bilise the air column. Convective rainfall is generally produced by “multicells” or “mesoscale convective sys-tems” (Rigo and Llasat, 2004). It is possible to distin-guish between two subclasses:
i) Type 2a lasts less than 24 h and the maximum pre-cipitation is usually recorded in less than 6 h, with accumulated rainfall of nearly 200 mm. They are “strongly convective events”, as in type 1, and can produce catastrophic flash floods in rivers of pre-littoral rainfall origin with modest basins and flows (50–2000 km2), simultaneously with the maximum rainfall, as well as short water courses. Flash floods of type 2a produce the highest number of casual-ties when they affect flood-prone areas with high concentrations of people. That was the case of 25 September 1962.
ii) Type 2b lasts more than 24 h but generally less than 4 days. Although accumulated rainfall usually has values between 200 and 400 mm, values of more than 800 mm are possible. Peaks of strong rain-fall intensity and moderate but continuous rainrain-fall are recorded successively. Consequently, they are “moderate convective events,” for which more than 25% of the accumulated rainfall has an intensity of above 35 mm/h (Llasat, 2001). They can also produce local flash floods in small rivers, although the most dangerous effect is over catchments above 1000 km2, and sometimes they can produce over-flow of the longest rivers in the region near their mouths. Damage produced by catastrophic floods of type 2b relates to total or partial destruction of infrastructures (houses, bridges, highways and so on), power cuts, urban inundations, agricultural and livestock losses and, frequently, losses of human life. The flood event recorded between the 6–8 November 1982, with flash floods in the French and Spanish Pyrenees and in Andorra, is an example of type 2b.
Type 2 events usually occur in autumn, although some cases have also been recorded in spring or summer.
A. Barrera et al.: Extreme flash flood evolution in Barcelona 507
23
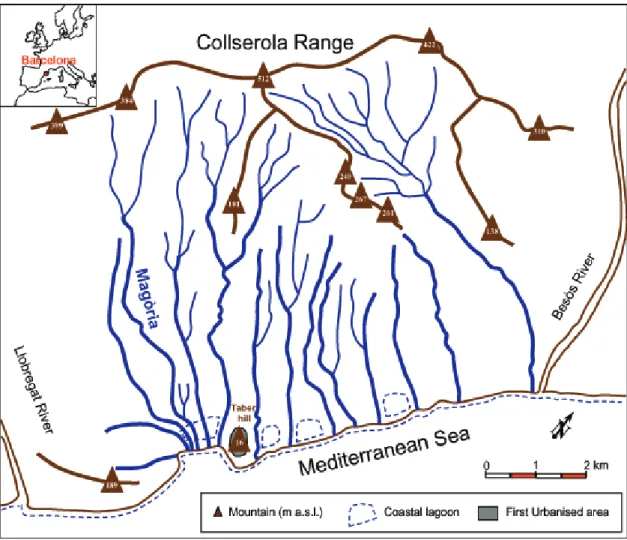
Figure 1. Location of places in Catalonia (NE Spain) mentioned within the text.
Fig. 1. Location of places in Catalonia (NE Spain) mentioned within the text.
– Type 3: Episodes of long duration (approximately one week) with weak average pluviometric intensity values, while there may be peaks of high intensity. Total precip-itation can be above 200 mm. If floods occur, they are usually in rivers with catchments above 1000 km2. They are “slight convective events” (less than 25% of the ac-cumulated rainfall has an intensity of above 35 mm/h), usually associated with convection embedded in strati-form rainfall. Although not very frequent, they usually occur in winter and, sometimes, in spring. In this last case snow melting can be also involved.
Research into historical climatology shows that floods con-stitute natural behaviour in this region (Barriendos and Mart´ın-Vide, 1998; Barriendos et al., 1998, 2003a, b; Lang et al., 1998; Br´azdil et al., 1999; Coeur and Lang, 2002; Glaser and Stangl, 2003; Barriendos and Llasat, 2003). For instance, 112 floods have been recorded at the mouth of the Llobregat River, near Barcelona (Fig. 1), between 1301 and 2005. When floods are analysed for periods previous to in-strumental data, usually the kind of damages is the main source of information and floods can be classified as:
– Ordinary rise or small flood: Scarcely differs from the normal situation of the river. Flooding of some areas is possible but remains restricted. Overflows depend on the degree of river bed obstruction and on the state of
dikes. No serious damage or destruction is caused to the population, but minor damage to hydraulic installations such as mills or irrigation channels cannot be ruled out. – Extraordinary flooding or intermediate flood: The flow of the river is sufficient to overflow the usual chan-nel and water is present in the streets or sectors under study. Damage to hydraulic installations adjacent to or in the channel, such as mills, irrigation channels, dams or footbridges can be severe, with partial destruction. This class includes large events, which affect the whole or only a part of the river course.
– Catastrophic flooding or large flood: As in the extraor-dinary case, the river overflows its usual channel. The difference lies in the strength or capacity of the over-flowed channel to cause severe damage or complete de-struction of infrastructures close to the river or away from the channel (bridges, dams, dikes, walls, mills, houses, drainage systems, irrigation channels, crops, sections of roadways and so on).
This classification combines the criteria developed by Bar-riendos and Martin-Vide (1998) and Lang and Coeur (2002) after systematic analysis of Spanish and French histor-ical floods, respectively, as published in Barriendos et al. (2003a). The comparison with intensity classifica-tion of historical floods for Central Europe since AD 1500
Fig. 2. Water courses in Barcelona county in the 1st century AD. Data obtained from Casassas i Sim´o (1984), Granados (1984), Oliv´e i
Guilera (1993), Riba i Arderiu (1993), Sanz Parera (1988), Travesset Queralt´o (1994) and Vila (1974). Urbanised area corresponds to period 200 BC– AD 1250.
(Sturm et al., 2001) shows a similar classification taking into account the first indicator (produced damages), although the physical features are different. Following this criterion, a flood could be catalogued as catastrophic in a region crossed by a river, but catalogued as extraordinary if we consider an-other zone of the basin. When the whole catchment area is considered, the worst impact would be the classification in-dicator.
Going back to the examples shown in the introduction and Sect. 2, the floods of September 1962 and November 1982 are considered catastrophic in the Pre-littoral and Pyrenees regions, although in Barcelona city only extraordinary and ordinary, respectively. On the other hand, those of August 2005 are extraordinary in the Pre-littoral region. In the same way, out of the 112 floods recorded on the mouth of the Llo-bregat River from 1301 to 2005, 26 are catastrophic floods and 86 are extraordinary ones.
However, analysis of flash floods from a climatological or historical point of view is not usual due to lack of enough
information to distinguish whether or not a flood could be considered a flash flood. Then, the solution can be to find descriptions about the evolution of the event or some instru-mental data, combined with a good knowledge of the rainfall and flood behaviour in the region. Information about changes in land uses, drainage network or main infrastructures that can affect the floods generation would be also welcome. Fi-nally, both previous classifications of flash floods must be considered. This is the case of the characterisation of floods in Catalonia, where prior works concerning historical floods (Barriendos and Mart´ın-Vide, 1997, 1998; Barriendos et al., 2003a, b) and modern floods (Llasat and Rodr´ıguez, 1992; Ramis et al., 1994; Llasat, 2001; Llasat et al., 2003; Mariani et al., 2005; Romero et al., 2005; Zampieri et al., 2005) are available. The analysis of the floods recorded in Barcelona has taken into account all these previous works, but includes more accurate information, basically for the last 150 years for which daily rainfall data are available. Besides this, the specific flood series for this county and their impact in the
A. Barrera et al.: Extreme flash flood evolution in Barcelona 509 city has been obtained and analysed. Main attention has been
paid to the descriptions of the cloudiness, starting and ending time of the rainfall and floods given in historical manuscripts, as well as the urban evolution of the city.
3 Geography of Barcelona county and its historical evo-lution
The city of Barcelona is situated in a Quaternary plain be-tween two rivers, the Llobregat River to the SW and the Bes`os River to the NE (Fig. 2). The plain is delimited by the coast and the Collserola range (Palaeozoic formation), with maximum altitudes around 500 m, and with an area of 120 km2. Twelve main short water courses (ouadis), with a strong slope and non-permanent flow, traverse this plain in parallel. When heavy rains or a long rainy period arise over or near the city, their overflowing can produce signifi-cant damage, and floods, landslides and temporary lagoons may be recorded. Nowadays, most of these water courses are channelled in underground levels and belong to Barcelona’s drainage system, with most of them interconnected. This net-work has been improved in recent years with the construction of underground storm tanks into the city. As a consequence, heavy rainfall effects over the city are not the same as in the past.
The relationship between human occupation and environ-mental conditions generates most definitive urban config-urations and location of infrastructures. The evolution of Barcelona city, from a consideration of flood risk criteria, can be defined in seven different stages:
a) BC 200–AD 1250: Natural conditions practically re-mained throughout the presence of the Roman Empire. Taber hill (16 m a.s.l.) was used for human occupation, thereby avoiding flood risk. Barcino, the Roman name of Barcelona, was a small city surrounded by littoral la-goons fed by small temporary rivers. Therefore, this period was a period of no flood risk for Barcino, and thus flood events were not recorded (Fig. 2).
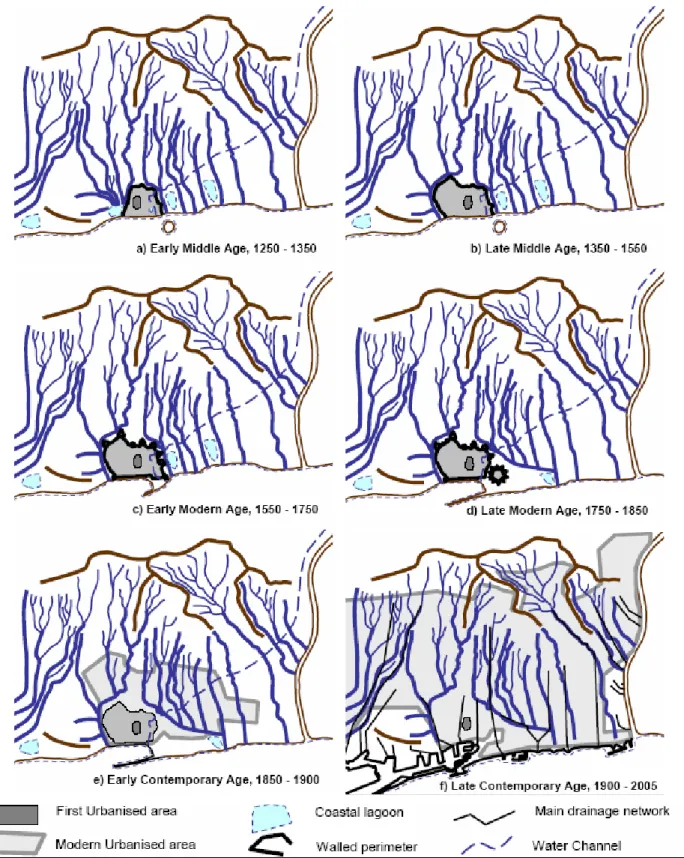
b) 1250–1350: The first flood risk assumptions were ex-perienced in the Early Middle Ages, occupying tem-porarily flooded areas and littoral lagoons. An opened walled perimeter was designed with military function, but also to manage the floods, diverting flows out of the urbanised quarters. Unfortunately, no systematic doc-umentary sources are available for this period. Flood events were not yet recorded (Fig. 3a).
c) 1350–1550: Major urban growth took place in the Late Middle Ages and a third walled perimeter was con-structed. This renewed powerful infrastructure drove water flows into trenches. Flood events were recorded, but most of the damage occurred in this first infrastruc-ture or at the outlet from trenches, close to littoral
la-goons. This planning strategy allowed an evident re-duction of impacts caused by flooding in the urbanised sector of the city, albeit with limited technology. In the middle of the 14th century the Mag`oria water course was deflected towards another stream to mitigate the floods produced in the western part of the city when the Mag`oria overflowed (Fig. 3b).
d) 1550–1750: The presence of Turkish pirates in the Mediterranean Sea constituted a negative factor for flood situation management in the Early Modern Age. It rendered necessary the construction of a “Sea Wall”, enclosing the city completely, because dynamic defence with galleys proved unsuccessful. Large rainfall events producing floods were managed by a combination of walls and trenches with relatively good results. Prob-lems arose with flash floods, when torrential rainfall was recorded into the city itself: a new dam effect was pro-duced by the “Sea Wall” because of drainage limitation (Fig. 3c).
e) 1750–1850: In the Late Modern Age, the only impor-tant changes affected the eastern area, with the construc-tion of a new fortress and the deflecconstruc-tion of the fluvial courses in that area. The last remaining coastal lagoons disappeared. Fluvial processes did not change in rela-tion to the previous pattern (Fig. 3d).
f) 1850–1900: Early Contemporary Age. The traditional protection of walled perimeter was removed during this short period, but was replaced by other operational in-frastructure to manage flood events. Barcelona expe-rienced a return to natural conditions with one of the highest human density levels of its history. Most non-permanent rivers returned to their former beds within or close to the city. This was a great problem for the population, because it had no perception of flood risk inside the city after 400 years of protection by the walls (Fig. 3e).
g) 1900–21st century: The 1891 drainage network pro-gramme ushered in a new period of flood risk manage-ment. Following different steps (drainage programmes of 1952, 1969, 1988, 1997 and 2004), a new drainage system was organised at underground levels, including pumping stations, storm tanks and a warning system, to manage the flood events affecting the more vulnera-ble human activities. Within this period, the importance of the last 20 years must be stressed, for most of the new infrastructure was developed in that period. Be-tween them, nine storm tanks have been built with a to-tal capacity of 490 800 m3 and the first commissioned in 1999. The current system has been designed to pre-vent floods for a 10-year return period precipitation and in some critical points for a 50-year return period (Mal-grat and Verdejo, 2004) (Fig. 3f).
25
Figure 3. Barcelona city urban evolution from the 14th century to the present: a) AD
1250-1350; b) AD 1350-1550; c) AD 1550-1750; d) AD 1750-1850; e) AD 1850-1900; f) AD
1900-2005.
25
Figure 3. Barcelona city urban evolution from the 14th century to the present: a) AD
1250-1350; b) AD 1350-1550; c) AD 1550-1750; d) AD 1750-1850; e) AD 1850-1900; f) AD
1900-2005.
25
Figure 3. Barcelona city urban evolution from the 14th century to the present: a) AD
1250-1350; b) AD 1350-1550; c) AD 1550-1750; d) AD 1750-1850; e) AD 1850-1900; f) AD
1900-2005.
25
Figure 3. Barcelona city urban evolution from the 14th century to the present: a) AD
1250-1350; b) AD 1350-1550; c) AD 1550-1750; d) AD 1750-1850; e) AD 1850-1900; f) AD
1900-2005.
25
Figure 3. Barcelona city urban evolution from the 14th century to the present: a) AD
1250-1350; b) AD 1350-1550; c) AD 1550-1750; d) AD 1750-1850; e) AD 1850-1900; f) AD
1900-2005.
25
Figure 3. Barcelona city urban evolution from the 14th century to the present: a) AD
1250-1350; b) AD 1350-1550; c) AD 1550-1750; d) AD 1750-1850; e) AD 1850-1900; f) AD
1900-2005.
25
Figure 3. Barcelona city urban evolution from the 14th century to the present: a) AD
1250-1350; b) AD 1350-1550; c) AD 1550-1750; d) AD 1750-1850; e) AD 1850-1900; f) AD
1900-2005.
Fig. 3. Barcelona city urban evolution from the 14th century to the present: (a) AD 1250–1350; (b) AD 1350–1550; (c) AD 1550–1750; (d)
AD 1750–1850; (e) AD 1850–1900; (f) AD 1900–2005.
A. Barrera et al.: Extreme flash flood evolution in Barcelona 511
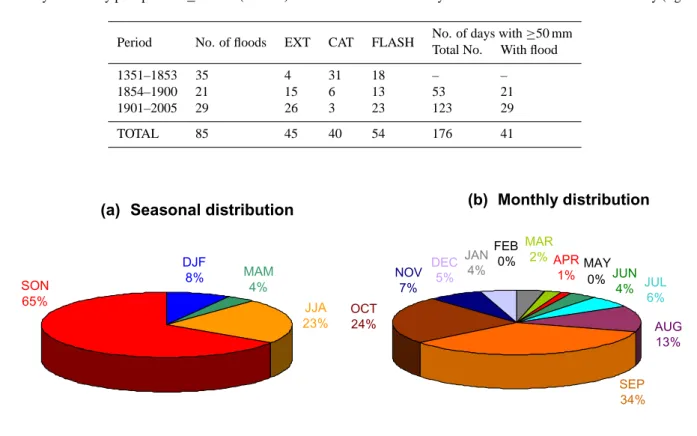
Table 1. Summary of the identified flood numbers for different periods on the basis of the available information: EXT is the number of
extraordinary floods; CAT, the number of catastrophic ones and FLASH, the same for flash floods. The last two columns represent the number of days with daily precipitation ≥ 50 mm (left one) and the number of those days that recorded a flood in Barcelona city (right one).
Period No. of floods EXT CAT FLASH No. of days with ≥50 mm Total No. With flood 1351–1853 35 4 31 18 – – 1854–1900 21 15 6 13 53 21 1901–2005 29 26 3 23 123 29 TOTAL 85 45 40 54 176 41
(b) Monthly distribution
AUG 13% JUL 6% JUN 4% NOV 7% OCT 24% DEC 5% JAN 4% FEB 0% MAR 2% MAY 0% APR 1% SEP 34%((a)) Seasonal distribution
DJF 8% MAM 4% JJA 23% SON 65% ((b)) Monthly distribution AUG 13% JUL 6% JUN 4% NOV 7% OCT 24% DEC 5% JAN 4% FEB 0% MAR 2% MAY 0% APR 1% SEP 34% (a) Seasonal distribution
DJF 8% MAM 4% JJA 23% SON 65%
Fig. 4. Flood distribution: (a) seasonal and (b) monthly.
4 History of floods in Barcelona county: occurrence and impacts
In order to organise historical information in conjunction with modern data the common criterion for classifying flood events shown in Sect. 2 has been used. Only extraordinary and catastrophic floods have been considered in this work. Bearing in mind the purpose of the paper, floods have been classified taking into account their impact on the city, not their regional impact. For the same reason, flash floods con-sidered here are floods of type 1 and 2a that directly affect the city.
The research and identification of floods has been based on the following available data:
i) From the 14th century to 1853: Only the information provided from documentary sources concerning the im-pacts produced by floods and the description of the events (beginning, ending, duration, kind of precipita-tion and so on) have been considered. In this period, 35 flood events have been identified, only four of which were extraordinary (Table 1).
ii) From 1854 to 1900: The daily rainfall series of Barcelona has been used for identifying floods. The
threshold of 50 mm/day was considered in order to look systematically for flood events in the city, in local news-papers and archives. In this period 53 days, with 50 mm or more were studied. 40% of these days recorded a flood: 6 catastrophic floods and 15 extraordinary ones (Table 1).
iii) From 1901 to 2005: Besides the criteria followed for the period 1854–1900, all the flood events recorded in Catalonia between 1901 and 2005 (Llasat et al., 2003; Barnolas, 2004) and affecting regions close to Barcelona, have been analysed on the basis of newspa-pers to seek their impact in the city. This dual analysis has corroborated that all the flood events in Barcelona were recorded on days with more than 50 mm/24 h accu-mulated in this city. On the other hand, it is important to remark that not all days with more than 50 mm recorded a flood event. In this period 123 days with 50 mm or more were recorded. 24% of these days recorded a flood in Barcelona city and 26 of them were extraor-dinary (Table 1). The percentage differences of this pe-riod in relation to the pepe-riod 1854–1900 are surely due to the improvement of Barcelona’s drainage system dur-ing the 20th century. For example, only minor problems
1350-1550
1551-1750
1751-1850
1851-1900 c) Protected city. Internal naturaldrainage in original configuration
d) Protected city but internal drainage closed by “Sea Wall”
e) Similar situation than d) f) Open city. Drainage network in progress
1901-2000
1351 -14 00 1401 -145 0 1451 -150 0 1501 -155 0 1551 -160 0 1601 -165 0 1651 -170 0 1701 -17 50 1751 -180 0 1801 -185 0 1851 -190 0 1901 -195 0 1951 -200 0 0 5 10 15 20 25 Nr. of Flood EventsCatastrophic Extraordinary Flash Flood Events
g) Protected city. Underground drainage network 1 FLASH 1 FLASH 1 FLASH
2 FLASH 3 FLASH 7 FLASH 1 FLASH 2 FLASH 8 FLASH 5 FLASH 8 FLASH 2 FLASH 13 FLASH
(*)
(*): Daily instrumental data available from 1854
Fig. 5. 50-year period flood distribution in Barcelona county from AD 1351 to 2000.
were experienced for the last high precipitation event in the city (13–14 October 2005), despite 147 mm being recorded in 24 h with maximum 5-minutal intensity of 122 mm/h.
Considering the geomorphologic features of the city and its surrounding region and all the previous information, a flood has been identified as a flash flood when it was produced by an intense and short rainfall event, as described by ob-servers. On the other hand, a lapse time of 6 h for the rain-fall period and an accumulated daily rainrain-fall above 50 mm were imposed when instrumental information and data are available. This last value coincides with the mean monthly rainfall, and has an average frequency of 1.16 cases per year. With these criteria, reconstruction of historical flood chronologies for the past 655 years has allowed the identi-fication of 40 catastrophic floods (47%) and 45 extraordinary floods (53%) since 1351, 64% of which could be consid-ered flash floods (Table 1). Seasonal distribution (Fig. 4a) shows that autumn, followed by summer, is the season with the highest number of floods, and September (29 cases), fol-lowed by October (20 cases), is the month with the highest
record (Fig. 4b). September also shows the greatest number of flash floods, with 34% of the monthly total.
Figure 5 shows the number of floods recorded from 1351 to 2000, for 50-year periods. The number of flash floods for each period is also included. This figure provides informa-tion on the evoluinforma-tion of flood occurrence in relainforma-tion to cli-matology and on the evolution of vulnerability. This kind of variability is also observed for the entire Catalonia region (Barriendos and Llasat, 2003), and some climatic oscillations can be observed in the early and late modern-age periods: some periods of an increasing frequency of events (i.e. 1601– 1650, 1751–1800, 1851–1900), while other longer periods show a lower occurrence of floods (1651–1750). Besides this, the evolution of flood occurrence shows an increase of extraordinary events in conjunction with an increase of flash flood events over the last 150 years, they being mainly of type 1. A comparison with the River Llobregat series shows that it has a complex time process, with two active periods, 1580–1700 and 1840–1870, and two periods with-out large floods: 1315–1580 and 1700–1840 (Barriendos et al., 2003a), an evolution that bears some similarities with this one for Barcelona city. In the same way, the largest Llobregat
A. Barrera et al.: Extreme flash flood evolution in Barcelona 513 floods are heterogeneously distributed in time within the
pe-riod 1300–1900.
After five centuries of relatively low vulnerability, in which only extreme events affected the city but destroyed external walls, Barcelona experienced a short period of 50 years (1851–1900) with an abrupt increase of vulnerability (Fig. 5) and extraordinary events. Actually, it was a collective human decision, preferring rapid and complete destruction of the walled perimeter before planning and construction of per-tinent networks for the various services including drainage had been addressed. The increase of extraordinary events, practically unknown during the Middle and Modern Ages, was simply the result of the abrupt change of environmental conditions: a 19th century industrial city was converted over the course of 50 years back to natural conditions like those of 2 000 years earlier but with a very much larger population. A comment should be added on the evolution of the per-ception threshold by society. It might be observed that the few events documented in the Middle Ages period could be attributed to a higher perception threshold (though prob-ably only the main catastrophic events are documented in archives). This type of information will be similar to the bi-nomial censored historic information because we only know for the period prior to instrumental data those floods that surpassed the perception threshold (Franc´es, 1995). This threshold is associated to the overflow produced in the city that could disturb everyday life and generate some damage, and could be associated to different rainfall thresholds due to changes in the vulnerability of the city. Unlike cases of work done with historical information about river floods (Franc´es et al., 1994; Lang et al., 1999, 2000; Barriendos et al., 2003a; Payrastre, 2005), it is not possible in this case to assign a particular flow to the perception threshold or to apply any seasonality test, because the overflowing of ephemeral rivers merges in with flooding produced by rainfall in situ. In the case of Barcelona, since the 20th century it is not possible to distinguish whether the floods were produced by rain-fall in situ or by overflow of the little streams that traverse the city, because they have been channelled and covered by streets. On the other hand, the Bes`os and Llobregat rivers are outside the city and their overflow usually affects the neighbouring zones, but not Barcelona city itself. Although during some catastrophic flood events (i.e., 1962 event) the Bes`os or Llobregat floods could be simultaneous with floods in Barcelona, they were not actually the cause.
5 Rainfall evolution in Barcelona
Barcelona has the oldest daily precipitation series on the Spanish Mediterranean coast since 1854. Thus, a climatic ap-proach from instrumental data since the 19th century can also be attempted. Besides the rainfall features of each event, the main climatic aspects of the daily precipitation in Barcelona and its possible relationship with an increase or decrease of
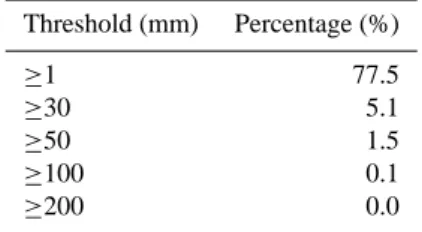
Table 2. Distribution of daily precipitation for rainy days (≥ 0.1 mm) in Barcelona (1854–2005) for different thresholds.
Threshold (mm) Percentage (%) ≥1 77.5 ≥30 5.1 ≥50 1.5 ≥100 0.1 ≥200 0.0
flood numbers are analysed. The total number of days with appreciable precipitation (≥ 0.1 mm) is 11 400 (21% of days) for the period 1854–2005. The distribution of these days is shown in Table 2.
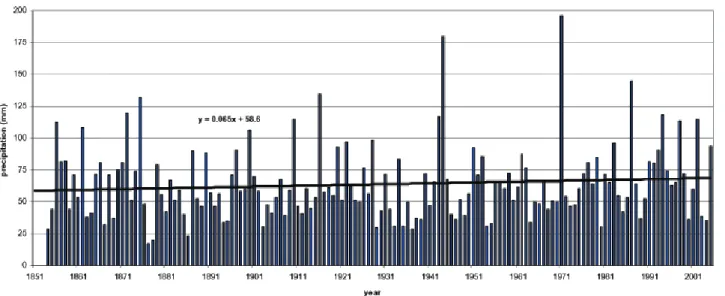
The evolution of annual maximum daily precipitation from 1854 to 2005 (Fig. 6) has been analysed looking for the ex-istence of trends and to comparing them with the observed flood pattern. Trend analysis usually involves a lot of prob-lems since one does not know the pattern of variability be-forehand. There are a many methods to test trends in clima-tological data, but most of them always show opposite results and hinder evaluation of a possible trend (Llasat and Quintas, 2004). For this reason in this paper, besides the well-known Man-Kendall and Spearman tests, a Monte Carlo technique has been applied (Livezey and Chen, 1983; Kunkel et al., 1999; Liebmann et al., 2004) to test a possible linear trend in the rainfall evolution. This technique consists in the follow-ing steps:
i) Calculation of the linear trend of the original series by the linear fitting of data (minimum squares or linear re-gression).
ii) Generation of 10 000 random permutations of the origi-nal series.
iii) Calculation of the linear trends for each 10 000 gener-ated series.
iv) Calculation of the 97.5 and 2.5 percentiles for the 10 000 calculated linear trends.
v) If the first linear trend calculated was higher than 97.5 percentile for positive trend or lower than 2.5 percentile for negative trend, then the obtained trend would be sig-nificant at 95%.
Table 3 shows the results of the trend analysis applied to the annual maximum daily precipitation. Application of the Monte Carlo analysis shows that no significant trend exists, the percentiles 97.5 and 2.5 (+0.105 mm/yr and −0.103 mm/yr, respectively) being, in absolute value, greater than the linear trend obtained for the original series, +0.065 mm/yr. On the other hand, both the other methods
Fig. 6. Temporal evolution of annual maximum daily precipitation for Barcelona (1854–2005).
Table 3. Trend analysis results for the annual maximum daily precipitation of Barcelona (1854–2005).
Trend Analysis Tests
Linear Trend – Monte Carlo technique r (mm/yr) P 97.5% (mm/yr) P 2.5% (mm/yr) Sig. at 95?% (|r|>|P?|) +0.065 +0.105 −0.103 NO Man-Kendall’s test t tc Sig. at 95?% (|t|<tc?) 0.063 0.107 YES Spearman’s test ρs ρc Sig. at 95?% (ρs<ρc?) 0.093 1.139 YES
show that the original series has a statistically significant trend. Taking into account the non-significant linear trend and its low value in comparison with the resolution of plu-viometers (0.1 mm), we can assert that extreme precipitation has not been increased. Consequently, the observed increase in extraordinary floods and decrease in catastrophic ones can-not be related to an increase of rainfall, but to the change of the drainage conditions (a minor catastrophic flood occur-rence) and to the increase of the vulnerability (increase in the social and economical impact of floods).
6 Comparative study of impacts
In this paragraph, an example of flash flood for each pe-riod has been considered. Documentary testimonies for each flood event show different meteorological and impact as-pects.
6.1 The Late Middle Age: The catastrophic flash flood of 5 September 1389
Contemporaneous testimonies show that a walled perimeter had a function of city protection and management of river floods, diverting the flow to the sea around the perimeter. But the energy of the flash floods proved excessive for buildings close to the wall in the sector where rivers beds were inter-cepted by walls. Torrential rainfall for only 3 h during the afternoon of 5 September 1389 was enough to bring down buildings. Several buildings collapsed in some streets and St. Peter Monastery was partially demolished. The wall was partially destroyed in the north-eastern part of the old city (Fig. 7a). But the worst impact in a pre-industrial society was outside the city: water channels feeding water mills would remain out of service for two weeks, as happened with the Comtal Channel, blocked by sediments. The city could not
A. Barrera et al.: Extreme flash flood evolution in Barcelona 515
Buildings and walls collapsed Hydraulic constructions collapsed Flooded area (Height in cm) xxx xxx Rainfall measurements (mm) LEGEND
(b)
75 145 85 18 92 55 40 75(e)
? ? ?(c)
78(d)
78 78 78 78 78 78(a)
Comtal Channel St. Peter MonasteryFig. 7. Scheme of the impacts and damage produced by different flash floods in the centre of Barcelona city: (a) 7 September 1389, (b)
produce flour, and shortages and famine appeared temporar-ily. There was also a general destruction of vineyards and fruit trees outside the city. Probably, it was a flash flood of type 1, because there is no historical evidence of flooding in other basins of the region.
6.2 The Early Modern Age: The catastrophic flash flood of 28 October 1591
The flash flood event that occurred on October 1591 is a typi-cal example of torrential rainfall affecting the Barcelona hin-terland. It occurred at night and lasted some hours. Rivers overflowed with high energy against the walled perimeter. Urbanised sectors did not sustain damage, but various instal-lations of the walled perimeter were destroyed: two bastions, two bridges and one gate (Fig. 7b). The authorities deemed this damage acceptable, because the flooding did not pro-duce casualties or other damage to productive activities. The Bes`os River also recorded a catastrophic flood. Therefore, this event was probably a flash flood of type 2a.
6.3 The Late Modern Age: The catastrophic flash flood of 8 April 1794
This event only produced damage close to the new fortress. It was a deluge that lasted two hours during the afternoon. The main water channel (Comtal Channel) of the city contributed to flood events by bringing into this sector the overflow from the River Bes`os. Without any slope down towards the sea, water reaching this sector produced floods in a dense urban area. Some walls collapsed in St. Peter Monastery and dam-age was sustained in that area of the city (Fig. 7c). It was probably a flash flood of type 1.
6.4 The Early Contemporary Age: The catastrophic flash flood of 14 September 1862
This is an example of extreme events with no protection. For-tunately the water did not have sufficient energy to destroy completely infrastructures and buildings, but in low parts of the city the flood was of a magnitude unknown in previous centuries. There were two buildings partially demolished, a bridge collapsed and there were three casualties. Contem-porary descriptions depict the city like a sea with only Taber hill free from flooding (the water level reached inside the city was 78 cm) (Fig. 7d). It was a torrential rainfall of 68 mm in 2 h in the morning between 09:00 UTC and 11:00 UTC. On 15 September, a catastrophic flood was recorded in the Bes`os River. This event can be classified as type 1 in Barcelona city although it could belong to an organised system that would produce floods of type 2 in other parts of the region.
6.5 The Late Contemporary Age: The extraordinary flash flood of 21 September 1995 and the ordinary flash flood of 31 July 2002
These are two examples of the efficiency of drainage in-frastructures in reducing and mitigating the flood impacts of events with high intensities and amounts of precipitation in the city. The September case turned a lot of streets into rivers (1 person died when dragged away by the water), and the low part of the city, where the littoral lagoons existed in the past, were flooded (Fig. 7e) due to high rainfall of 80 mm in 30 min, between 20:00 and 20:30 UTC. The maximum 5-minutal intensity was 235.2 mm/h and the maximum ac-cumulated rainfall was nearly 100 mm in 1 h. In this part of the city the reached water level was 75 cm, and the event can be classified as type 1. This is a typical case of a flash flood produced by a sudden thunderstorm that the meteorological models did not forecast. This event spurred the construction of underground storm tanks to provide better drainage. It also affected other parts of Catalonia, specially the Maresme area, where a bridge collapsed due to a catastrophic flood of an ephemeral river.
The July case only caused localised problems in the city, despite more than 115 mm being recorded in less than 4 h. The maximum 5-minutal intensity was 132.0 mm/h. This flash flood was produced by a thunderstorm that developed into a convective system that then affected the Central coast of Catalonia. Although in Barcelona city only an ordi-nary flood was recorded, in the north of the city and in the Maresme area to the north of the county (see Fig. 1 for lo-cations) serious damage was sustained and the flood could be considered a catastrophic flood in that area. More than 200 mm were recorded in 14 h in that region. It could be likewise be considered a flash flood event of type 2a.
Both events could have produced catastrophic damages without a good drainage system and storm tanks.
7 Conclusions
The evolution of flood occurrence (85 cases) in Barcelona county, from the 14th century down to the present day, shows the existence of climatic oscillations in the early and late modern age periods, such as 1601–1650, 1751–1800 and 1651–1751. The absence of trend in rainfall series from 1854 cannot explain the increased number of flood events, spe-cially the extraordinary ones, over the last 150 years. Such a trend observed in the number of floods documented can be mainly attributed to evolution of the perception threshold and changes in vulnerability and urban conditions from the middle of the 19th century. The increase observed during the second part of the 19th century was related to the destruction of the city walls that prevented overflows and to a deficient drainage system, while the increase observed during the lat-ter part of the 20th century was related to the major flood
A. Barrera et al.: Extreme flash flood evolution in Barcelona 517 impact (increased damage and social perception) and to the
urban occupation of flood areas.
This study has allowed three objectives to be attained. The first was to progress towards a general definition of flash floods in the Western Mediterranean area, for which no such definition exists. A first proposal could be sudden floods pro-duced by an intense rainfall event that lasts for less than 6 h and accumulates more than 50 mm in this period; however, further studies are needed for other zones along the Mediter-ranean coast. Secondly, analysis of the time evolution for rainfall shows that no trend exists. However, due to the changes in urban planning, flash flood impact has indeed changed over time. As a consequence, the number of catas-trophic flash floods has diminished, although the extraordi-nary ones have increased. This fact is related with the third objective, which is to note the mitigation of flood impacts where a good drainage system is developed. The 1850–1900 period is an example of poor management and planning. Acknowledgements. The authors thank the RAMSHES
(REN2002-04584/CLI) Spanish project, the AMPHORE (Interreg IIIB MEDOCC 2003-03-4.3-I-079) European project and the “Ram´on y Cajal” Programme (Spanish Ministry of Education and Science) for enabling the writing of this paper.
Edited by: F. Guzzetti Reviewed by: two referees
References
Azzola, M. and Tuia, T.: L’alluvione dell’Adda del 18–19 luglio 1987: Cause, effeti e interventi, edited by: Gil-Olcina, A. and Morales-Gil, A.: Avenidas fluviales e inundaciones en la Cuenca del Mediterr´aneo: Geography Institute, University of Alicante, Alicante, Spain, 185–193, 1989.
Barnolas Vilad´es, M.: Desarrollo de un sistema ACCESS/SIG en el ´ambito de las ciencias de la atm´osfera: Estudio de las inunda-ciones en Catalunya, 1901–2000, Work towards the Diploma de Estudios Avanzados (DEA), Astonomy and Meteorology Doc-torate Syllabus (2002–2004). DAM/250201-05/0409, Internal publication, 2004.
Barriendos, M. and Llasat, M. C.: The case of the “Mald´a” Anomaly in the Western Mediterranean basin (AD 1760–1800): An example of a strong climatic variability, Climatic Change, 61, 191–216, 2003.
Barriendos, M. and Mart´ın-Vide, J.: Meteorological hazards in Barcelona as from historical records (from the 14th to the 19th century), Initial results concerning their plurisecular climatic pat-tern, edited by: Mart´ın-Vide, J., Advances in Historical Clima-tology in Spain, Oikos-Tau, Barcelona, 133–156, 1997. Barriendos, M. and Mart´ın-Vide, J.: Secular climatic oscillations
as indicated by catastrophic floods in the Spanish Mediterranean coastal area (14th–19th Centuries), Climatic Change, 38, 473– 491, 1998.
Barriendos, M., Coeur, D., Lang, M., Llasat, M. C., Naulet, R., Lemaitre, F., and Barrera, A.: Stationarity analysis of historical flood in France and Spain (14th–20th centuries), Nat. Hazards Earth Syst. Sci., 3, 583–592, 2003a.
Barriendos, M., Llasat, M. C., and Rodr´ıguez, R.: Frequency of heavy rains and floods in Northeast Spain since the 15th century, The Second International Conference on Climate and Water, Fin-land, 391–399, 1998.
Barriendos, M., Llasat, M. C., Barrera, A., and Rigo, T.: The study of flood events from documentary sources, Methodologi-cal guidelines for historiMethodologi-cal sources identification and flood char-acterization in the Iberian peninsula, edited by: Thorndycraft, V. R., Benito, G., Barriendos, M., and Llasat, M. C., Palae-ofloods, Historical Floods and Climatic Variability: Applications in Flood Risk Assessment (Proceedings of the PHEFRA Work-shop, Barcelona, Spain, 16–19 October 2002), CSIC, Madrid, 87–92, 2003b.
Br´azdil, R., Glaser, R., Pfister, C., and Stangl, H.: Floods in Europe – A Look into the Past, PAGES News, 10(3), 21–23, 2002. Br´azdil, R., Glaser, R., Pfister, C., Antoine, J. M., Barriendos, M.,
Camuffo, D., Deutsch, M., Enzi, S., Guidoboni, E., and Rodrigo, F. S.: Flood events of selected rivers of Europe in the Sixteenth Century, Climatic Change, 43, 239–285, 1999.
Casassas i Sim´o, L.: El Barcelon`es, La hidrologia del pla de Barcelona, Gran geografia comarcal de Catalunya, 8, 16–20, 1984.
Coeur, D. and Lang, M.: L’enquˆete en archives et la connais-sance des inundations, in: Avalanches et risques, Regards crois´es d’ing´enieurs et d’historiens, Actes du s´eminaire du pro-gramme Histoval (Grenoble, 16 September 1999), Cemagref-Universit´e Pierre Mend`es France (CRHIPA/HESOP), Grenoble, MSH-Alpes, 133–144, 2002.
Franc´es, F., Salas, J. D., and Boes, D. C.: Flood frequency anal-ysis with systematic and historical or paleoflood data based on the two-parameter general extreme value models, Water Resour. Res., 30(6), 1653–1664, 1994.
Franc´es, F.: Utilizaci´on de la informaci´on hist´orica en el an´alisis regional de avenidas, Monograf´ıa CIMNE, 27, Val`encia, Spain, 1995.
Frontero, P., Binder, P., Pugnaghi, S., Lombroso, L., Santangelo, R., Buzzi, A., Paccagnella, T., and Selvini, A.: Versilia flood: A pre-frontal supercell system embedded in weak flow impinging on near-coastal mountain range, INM/WMO International Sympo-sium on cyclones and hazardous weather in the Mediterranean, Palma de Mallorca, 14–17 April 1997, Spain, 159–167, 1997. Glaser, R. and Stangl, H.: Historical floods in the Dutch Rhine
Delta, Nat. Hazards Earth Syst. Sci., 3, 1–9, 2003.
Granados, O.: El Barcelon`es, La hist`oria, Gran geografia comarcal de Catalunya, 8, 40–48, 1984.
Kunkel, K. E., Andsager, K., and Easterling, D. R.: Long-Term Trends in Extreme Precipitation Events over the Conterminous United States and Canada, J. Climate, 12, 2515–2527, 1999. Lang, M. and Coeur, D.: Flood knowledge: History, hydraulics and
hydrology, Case study on three French rivers, AFCRST Paris, Colloque Franco-Chinois sur la protection et l’utilisation durable de la ressource en eau, Chinese-French Conference on water re-sources, Shanghai/Suzhou, 6–9 November, 96–102, 2002. Lang, M., Coeur, D., Lallement, C., and Naulet, R.: Valorisation
de l’information historique pour la pr´ed´etermination du risque d’inondation: Application au basin du Guiers, Ing´enieries EAT, 16, 3–13, 1998.
Lang, M., Naulet, R., Brochot, S., and Coeur, D.: Historisque-Isere et torrents affluents, Utilisation de l’information historique pour
une meilleure d´efinition du risque d’inondation, CEMAGREF, Lyon, France, 2000.
Lang, M., Ouarda, T., and Bob´ee, B.: Towards operational guide-lines for over-threshold modelling, J. Hydrol., 225, 103–117, 1999.
Legrand P., Brugnot, G., and Baumont, G.: R´etour d’experience des inondations de septembre de 2002 dans les d´epartaments du Gard, de l’H´erault, du Vaucluse, des Bouches de Rhˆone, de l’Ard`eche et de la Drˆome, Contribution du Groupe d’Appui et d’expertisse scientifique (CD-ROM), 2003.
Liebmann, B., Vera, C. S., Carvalho, L. M. V., Camilloni, I. A., Ho-erling, M. P., Allured, D., Barros, V. R., B´aez, J., and Bidegain, M.: An observed trend in central South American precipitation, J. Climate, 17, 4357–4367, 2004.
Livezey, R. E. and Chen, W. Y.: Statistical field significance and its determination by Monte Carlo techniques, Mon. Wea. Rev., 111, 46–59, 1983.
Llasat, M. C. and Quintas, L.: Stationarity of monthly rainfall se-ries, since the middle of the 19th century. Application to the case of Peninsular Spain, Nat. Hazards, 31, 613–622, 2004.
Llasat, M. C. and Rodr´ıguez, R.: Extreme rainfall events in Catalo-nia: the case of 12 November 1988, Nat. Hazards, 5, 133–151, 1992.
Llasat, M. C., Ramis, C., and Lanza, L.: Storm tracking and mon-itoring using objective synoptic diagnosis and cluster identifica-tion from infrared meteosat imagery: A case Study, Meteorol. Atmos. Phys., 71, 139–155, 1999.
Llasat, M. C., Rigo, T., and Barriendos, M.: The “Montserrat-2000” flash flood event: A comparison with the floods that have oc-curred in the northeastern Iberian Peninsula since the 14th cen-tury, Int. J. Climatol., 23, 453–469, 2003.
Llasat, M. C., Rigo, T., Ceperuelo, M., and Barrera, A.: Estimation of convective precipitation: The meteorological radar versus an automatic rain gauge network, Adv. Geosci., 2, 103–109, 2005. Llasat, M. C.: An objective classification of rainfall events on the
basis of their convective features, Application to rainfall intensity in the North-East of Spain, Int. J. Climatol., 21, 385–1400, 2001. Llasat, M. C.: High magnitude storms and floods, edited by: Wood-ward, J.: The physical geography of the Mediterranean basin, Oxford University Press, Oxford, in press, 2006.
Malgrat, P. and Verdejo, J. M.: La planificaci´on y gesti´on avanzada de sistemas de drenaje urbano, El caso de Barcelona, Proc. Sec-ond Int. Congress on Advanced Management of Urban Drainage (Barcelona, Spain, 25–26 October 2004), III, 1–21, 2004. Mariani, S., Casaioli, M., Accadia, C., Llasat, M. C., Pasi, F.,
Davolio, S., Elementi, M., Ficca, G., and Romero, R.: A lim-ited area model intercomparison on the “Montserrat-2000” flash-flood event using statistical and deterministic methods, Nat. Haz-ards Earth Syst. Sci., 5, 583–592, 2005.
Oliv´e i Guilera, J.: Les rieres del pla de Barcelona a mitjan segle XIX, Proceedings Barcelona, 2, 399–408, 1993.
Payrastre, O.: Faisabilit´e et utilit´e du recueil de donn´ees historiques pour l’´etude des crues extrˆemes de petits cours d’eau. ´Etude du cas de quatre bassins versants affluents de l’Aude, Doctoral The-sis, ENPC, Paris, France, 2005.
Radinovic, Y.: The basic concept on the methodologies of Mediter-ranean cyclones and adverse weather phenomena studies, Proc. INM/WMO Int. Symposium on cyclones and hazardous weather in the Mediterranean (Palma de Mallorca, Spain, 14–17 April 1997), 45, 1997.
Ramis, C., Llasat, M. C., Genov´es, A., and Jans`a, A.: The October-1987 floods in Catalonia: Synoptic and mesoscale mechanisms, Meteorol. Appl., 1, 337–350, 1994.
Riba i Arderiu, O.: Assaig sobre la geomorfologia medieval de la ciutat vella de Barcelona, Proceedings del III Congr´es d’hist`oria de Barcelona, 1, 171–176, 1993.
Rigo, T. and Llasat, M. C.: A methodology of convective structures using meteorological radar: Application to heavy rainfall events on the Mediterranean coast of the Iberian Peninsula, Nat. Haz-ards Earth Syst. Sci., 4, 59–68, 2004.
Romero, R., Mart´ın, A., Homar, V., Alonso, S., and Ramis, C.: Pre-dictability of prototype flash flood events in the Western Mediter-ranean under uncertainties of the precursor upper-level distur-bance: the HYDROPTIMET case studies, Nat. Hazards Earth Syst. Sci., 5, 505–525, 2005.
Sanz-Parera, M.: El pla de Barcelona: constituci´o i caracter´ıstiques f´ısiques, Els llibres de la Frontera, Sant Cugat del Vall`es, Col. “Coneguem Catalunya”, 25, 1988.
Sturm, K., Glaser, R., Jacobeit, J., Deutsch, M., Br´azdil, R., and Pfister, C.: Floods in Central Europe since AD 1500 and their re-lation to the atmospheric circure-lation, PGM, 148(6), 18–27, 2001. Taramasso, A., Gabellani, S., and Parodi, A.: An operational flash-flood forecasting chain applied to the test cases of the EU project HYDROPTIMET, Nat. Hazards Earth Syst. Sci., 5, 703–710, 2005
Travesset-Queralt´o, M.: La xarxa hidrogr`afica del Pla de Barcelona entre la riera de Mag`oria i la riera d’Horta, Finestrelles, 6, 57–70, 1994.
Valarie, P. and Coeur, D.: Vulnerabilit´e de la r´egion Languedoc-Roussillon aux crues m´editerran´eennes: perspectives historiques et enjeux actuels, La Houille Blanche, 6, 56–61, 2004.
Vila, P.: El Barcelon`es i Barcelona ciutat, Geografia de Catalunya, AEDOS, 3, 497–608, 1974.
Zampieri, M., Malguzzi, P., and Buzzi, A.: Sensitivity of quantita-tive precipitation forecasts to boundary layer parameterization: a flash flood case study in the Western Mediterranean, Nat. Haz-ards Earth Syst. Sci., 5, 603–612, 2005.