Designing Anti-Poverty Programs in Emerging Economies
in the 21st Century: Lessons from Indonesia for the World
The MIT Faculty has made this article openly available. Please share
how this access benefits you. Your story matters.
Citation Olken, Benjamin A. "Designing Anti-Poverty Programs in Emerging Economies in the 21st Century: Lessons from Indonesia for the World." Bulletin of Indonesian Economic Studies 55, 3 (November 2019): 319-339 © 2019 ANU Indonesia Project
As Published http://dx.doi.org/10.1080/00074918.2019.1690411
Publisher Informa UK Limited
Version Author's final manuscript
Citable link https://hdl.handle.net/1721.1/130377
Terms of Use Creative Commons Attribution-Noncommercial-Share Alike
Designing Anti-Poverty Programs
in Emerging Economies in the 21st Century:
Lessons from Indonesia for the World
1 Benjamin A. Olken, MITAugust 2019
ABSTRACT
Governments of developing countries around the world have dramatically expanded social protection programs for the poor in recent decades. In doing so, they face a host of challenges in the targeting, design, and implementation of these programs. In this paper, I describe the results from more than a decade of collaboration with the Indonesian Government to understand how best to tackle these challenges, drawing primarily on evidence from randomized controlled trials. I highlight results that show the advantages of both community-based targeting and self-targeting, the importance of tangible information about beneficiaries’ rights in minimizing leakage, and the remarkable impacts of conditional cash transfers in the medium term. I also describe several recent
studies that use randomization at scale to generate policy-relevant evidence.
1Contact email: bolken@mit.edu. The results described here draw on my collaborations with many people, including Vivi Alatas, Abhijit Banerjee, Nur Cahyadi, Gabriel Kreindler, Jordan Kyle, Junko Onishi, Rizal Adi Prima, Ririn Purnamasari, Audrey Sacks, Elan Satriawan, Sudarno Sumarto, Ekki Syamsulhakim, Julia Tobias, Matthew Wai-Poi, Susan Wong, and particularly Rema Hanna. I thank our many partners in the Government of Indonesia, particularly Rudy Prawiradinata, Pungky Sumadi, Maliki, and Vivi Yulaswati at the Ministry of National Development Planning/Bappenas, BPS, the Ministry of Home Affairs, the Ministry of Social Affairs, and Bambang Widianto at TNP2K for their openness to using evidence to inform policy decisions and for their support of the many projects described here. I thank the many staff members at J-PAL Southeast Asia for outstanding work implementing these projects, including Talitha Chairunissa, Masyhur Hilmy, Amri Ilmma, Nurzanty Khadijah, Chaerudin Kodir, Nadira Purdayinta, Hector Salazar Salame, Ritwiki Sarkar, Prani Sastiono, Freida Siregar, Jurist Tan, Poppy Widyasari, and particularly Lina Marliani; Gregorius Kelik and Yulia Herawati for their help with the Generasi project; and SurveyMETER and Mitra Samya for their partnership on many of these projects. I thank Yuen Ho, Evelina Smirnitskaya, and Claire Walsh for help preparing this lecture, and Pierre van der Eng and two anonymous referees for helpful comments. Finally, I thank Sudarno Sumarto for hosting me as a young graduate student at SMERU studying the OPK/Raskin program in the summer of 2001; Lant Pritchett for introducing me to some of the challenges of social assistance in Indonesia in the fall of 2000; the Henry Luce Foundation for sending me to Indonesia in the first place in 1997-1998; and Scott Guggenheim for almost two decades of unwavering support and encouragement. Funding for the projects described here came from the Australian Government (AusAID and DFAT), the Royal Netherlands Embassy, 3ie, and the World Bank. All of the views expressed in the paper are those of the author and do not necessarily reflect the views of any of the many institutions or individuals acknowledged here.
I. Introduction
Governments of developing countries around the world have dramatically expanded social protection programs for the poor in recent decades: between 2000 to 2017, the number of developing countries with at least some type of social safety net program expanded from 72 to 149 countries (World Bank 2017). As a result, most countries in the world now have some type of social protection program. Conditional cash transfers (CCTs) are a particularly popular type of program, which typically give cash to poor households with some conditions, usually related to child health and education. More than 60 countries have some type of CCT program, up from 27 in 2008, and more than 90 countries have some type of unconditional cash transfer program (UCT) (Honorati et al. 2015).
Of course, the idea of helping poor citizens is not a new idea in developing countries. But there has been a global shift over the past two or three decades: away from subsidizing basic commodities, such as food or energy, and towards more targeted programs, where aid is only given to households deemed eligible. One reason for this shift is that subsidies, while simple and transparent, may not actually have a large impact on reducing poverty. For example, if a country subsidizes fuel, but consumption of fuel is proportional to income, then most of the benefits of the subsidy will end up going to the middle or upper classes, rather than to the poor. While it is possible to find amenities that are only consumed by the poor, generally the middle and upper classes consume more of most commodities. Thus, subsidizing basic commodities is generally less efficient than targeted transfer programs for reducing poverty. One reason this shift is happening now, rather than say 30 or 40 years ago, is that implementing targeted transfer programs is logistically more complicated and often requires information technology. For example, targeted programs require keeping track of a country’s population, figuring out who is poor, and making sure that people only receive the transfer once without double-collecting.
The evolving situation in Indonesia mirrors these global trends. Over the past two decades, Indonesia has implemented a number of social protection programs targeted directly towards poor households, including rice subsidy programs (Rastra/BPNT and its predecessor programs Raskin and OPK), direct cash transfer programs (Bantuan Langsung Tunai (BLT) and
Bantuan Lansung Sementara Masyarakat (BLSM)); CCT programs (Program Keluarga Harapan (PKH)), and cash transfers for poor students (Bantuan Siswa Miskin (BSM)), among others. The introduction of these new programs has coincided with a scaling back of blanket subsidies, particularly of energy, in Indonesia. The trend away from across-the-board energy subsidies towards targeted transfer programs improves the ability of the government to ensure assistance reaches those who need it the most. This shift also reduces the distortions associated with social protection programs, since cash grants are less distortionary than subsidies, which change the marginal price of a good.
Implementing targeted transfers, however, creates a number of new policy challenges. If we want to give assistance to only poor households, how do we identify which households are poor and should be eligible? What type of assistance should we provide: cash, in-kind transfers, or something else? Related to implementation and governance, how do we ensure that eligible beneficiaries are actually receiving the transfers they are entitled to? And finally, when looking at the bigger picture, does any of this actually matter? Are these programs effective in reducing poverty and improving wellbeing?
This lecture will focus on identifying those challenges, sharing findings from some of the work I have done in Indonesia, with a large number of collaborators, that has helped shed light on different aspects of these questions. In particular, I will draw out some of the lessons we have learned from our decades-long work with the Government of Indonesia to bring evidence to bear on these issues, both for the future of anti-poverty programs in Indonesia and for other emerging economies facing similar challenges.
The answers to these questions are going to be very different in a developing country context, such as Indonesia, compared to a developed country context. For example, for the question around targeting – in developed countries, the government typically can observe almost everyone’s income, so it can target transfers to people with low income. Granted, targeting by income may not be a perfect solution (because it essentially taxes earnings, thus potentially discouraging work, see e.g., Moffit 2002; Krueger and Meyer 2002). Nevertheless, it is typically not a viable solution in a developing country context because governments typically do not
observe income, particularly for the poor as most of the poor are out of the tax net (Jensen 2016). Instead, other approaches need to be designed that are customized to the realities of the
developing country context. But these alternative approaches involve tradeoffs, and it is an empirical question as to which methods work best. The answer may also depend on how to define what “best” means in a particular context.
In terms of what kind of assistance to provide – cash, in-kind transfers, or something else – the answer to this question will also differ between contexts. For example, there is less banking infrastructure in many developing countries, which may make distribution of cash more difficult. Supply issues may also be important to consider. If a government provides subsidies in remote areas, but the subsidized good is not readily available in that remote context, then subsidies may affect local prices (Cunha, De Diorgi, and Jayachandran 2019).
Challenges around program implementation, governance, and leakages may also be particularly severe in many developing countries (Olken 2006). Transparency and access to information may be particular challenges as well. For example, developing countries may
experience relatively low levels of literacy, particularly among poor beneficiaries, who might not understand their rights under a given program.
Finally, we also need to understand the impact of these types of social protection programs on reducing poverty and improving well-being. While there has been a lot of work done to understand the impact of these programs in the short-run, understanding their impact over the longer term is more difficult and an important area for new research.
For the past decade in Indonesia, in collaboration with many government colleagues, we have tried to understand the answers to these questions in a developing country context.
Throughout this process, we have collaborated with many different government agencies in Indonesia, including Kementerian PPN/Bappenas, Badan Pusat Statistik (BPS) [the Statistics Bureau], Kemensos [the Ministry of Social Affairs], and TNP2K under the Vice President’s office. Through this unique partnership, we have worked together to conduct a number of randomized policy evaluations – the gold standard of evidence. By randomizing which locations
get which treatment, we are able to truly understand the impacts of particular policies. This lecture describes our findings, the implications for current and future anti-poverty programs in Indonesia, and the implications for other countries facing similar challenges.
II. Targeting: How Do You Identify Who Is Poor?
A. Targeting Methods
There are three main approaches to thinking about poverty targeting in a developing country context. The first approach is a proxy means test (PMT). In a traditional means test, if a person’s income is below a given level, they are eligible for the program. When a government cannot observe income, they can instead use a PMT, which predicts a person’s income based on variables that can be observed, creating proxies for income. The government can then determine eligibility based on this predicted income. In other words, a PMT is a means test that is based on proxies of income rather than actual income.
To conduct a PMT, the government usually goes door to door and conducts a census of observable assets for all potentially poor households, such as house building materials,
household vehicles, TV ownership, etc. They then run a regression in a different dataset, collected for research purposes, that estimates the relationship between the assets they can observe and the income or consumption level of a household, which is observed in research data but not observed for the entire population. Once they have that regression, they can return to their census assets data and predict a household’s income. As such, a PMT typically involves a large data collection effort. In Indonesia, for example, a PMT census has occurred approximately once every three years since 2005 through the Pendataan Program Perlindungan Sosial (PPLS) survey. Depending on the year, the government will visit between 15 to 20 million households to collect data on different asset characteristics.
Moreover, the proxies created for income may be imperfect. For example, people have different tastes and consumption patterns. Given the same level of income, some people may prefer to spend money on a nice house while other people may prefer to save money in a bank account. A PMT will estimate that people who prefer to consume money in the form of a house are richer than those who prefer to save money in a bank, because bank savings are not observed
in a PMT. A PMT may also not reflect income shocks. For example, if someone was recently laid off from their job, they may still own the same house and assets but their actual income may be quite low.
None of this is to say that a PMT is not valid. Rather, I just want to highlight that the proxies are imperfect. At a technical level, one can measure the predictive power of a PMT through the R2, which captures how well the variables in the PMT predict actual per-capita
consumption. In examples we’ve done, these R2 are usually between 0.4 and 0.6, confirming that
the PMT asset variables have substantial predictive power, but that there is still substantial residual variation in per-capita consumption that is not captured.
A second approach is community-based targeting, which is based on the idea that communities may have better information than the government about which households are poorest. However, if the government asks a community for this information, and links money to being identified as poor, elite capture may be a concern. For example, a commonly cited concern is that local elites may try to manipulate the process by putting their nephews or cousins on the eligibility list instead of the people that are most deserving. How the community defines poverty may also be different than what the central government has in mind; I will return to this issue in more detail later.
A third approach is “self-targeting,” where poor households are asked to apply for a program. The PMT I described above entailed automatic enrollment—the government goes door to door to screen households and places households below a certain poverty threshold on the eligibility list automatically, without households needing to take any action. In a self-targeting approach, by contrast, the government first asks anyone who is interested in the program to apply. If people apply, they are then screened with a PMT to determine whether they are eligible.
There are potential advantages and disadvantages to a self-targeting approach. In automatic enrollment, the government tries to identify all potentially poor households but may miss a few, particularly if poor households live on the margins of villages. With a self-targeting approach, the poor can make themselves known, potentially reducing so-called “exclusion error.”
This can be particularly useful if the on-demand application process is open continually;
households who were previously better off, but recently experienced a negative economic shock, could potentially come apply under an on-demand application system. Under self-targeting, the upper or middle classes can also screen themselves out: if someone is in a relatively well-off household, they may not bother to apply for the program because they do not think they will pass the PMT screening test. This type of self-selection can help the government reduce so-called “inclusion error” in the PMT formula. To continue the earlier example, the household that may choose to keep their money in a bank rather than spend it on building a nice house would perhaps pass a PMT test, but they may not bother to apply for the program if they do not understand the screening formula.
However, a disadvantage to self-targeting is that all poor households may not necessarily apply. Poor households could feel intimidated by the application process, or they could face time constraints. For example, to apply for the program, a poor household may need to take time off of work to show up at an application office, which may mean they do not earn any money that day and may have to skip some meals in order to apply.
B. Comparing Targeting Methods Using Randomized Trials
It is not obvious ex ante which targeting method is most effective, as they all involve tradeoffs. Hence, we conducted two different randomized evaluations to understand, in an empirical manner, which of these targeting methods was most effective. In the first study, which is joint work with Vivi Alatas, Abhijit Banerjee, Rema Hanna, and Julia Tobias (Alatas et al. 2012), we compared a PMT approach to a community-based targeting approach and a hybrid method for a one-time cash transfer of around US$3. In the second evaluation, which is joint with Vivi Alatas, Abhijit Banerjee, Rema Hanna, Ririn Purnamasari, and Matthew Wai-Poi (Alatas et al. 2016), we conducted a larger experiment in the context of the expansion of the PKH/BPT program. We compared an automatic enrollment PMT to a self-targeting based PMT, which required households to apply before receiving the same means test.
Comparing PMT with Community Targeting: In the first evaluation, we randomly assigned 640
hybrid method (note that this experiment included both rural desa and urban kelurahan; I will henceforth refer to both of them as villages for simplicity). In the PMT, we used 49 indicators that were created by the BPS statistics office, using their normal PMT method. In the community method, we facilitated community meetings where communities ranked households from richest to poorest. Communities first discussed what their view of poverty was, and then community members took turns ranking everyone in the community from richest to poorest, placing name cards on a string. This produced a complete rank ordering of the relative perceived poverty levels of everyone in the neighborhood. The households ranked poorest received the transfer. The third method was a hybrid, where we first conducted the community-based approach and then applied the PMT as a way to screen out incompatibility. In conjunction, we also conducted an
independent survey to measure a household’s true poverty level to measure which of these targeting methods was most effective at identifying poor households.
For outcomes, we looked at both targeting error and community satisfaction. Targeting error was defined as either giving the transfer to a non-poor household or failing to give the transfer to a poor household. We measured whether a household was actually poor or not by conducting a consumption survey prior to the targeting process and matching the results of that consumption survey to the targeting results. We measured community satisfaction in an endline survey in a variety of ways and also established a comment box where people could leave feedback about the targeting method used.
The results indicate that the PMT method had lower targeting error compared to the other two methods by about 3 percentage points (10 percent); see Figure 1. If we actually look at the data more closely, the targeting methods appear to mostly agree on which households are the rich and which are the very poor. Where the PMT does a slightly better job of sorting households is with people very close to the threshold. Thus, the overall impact on poverty from using one method versus another actually looks very similar. In cases where the methods disagree, the differences in incomes are very small. In other words, even though the PMT technically does a somewhat better job of reducing targeting errors, our calculations suggest that the PMT would not reduce poverty substantially more than other targeting methods if scaled up.
We also asked households which targeting method they preferred, and how well they thought each method performed. Did they think the method was reasonable? Would they prefer to use this method again if there was another targeting project in their village? We also showed participants the final list of eligible beneficiaries and asked if there was anyone they thought should be added or removed from the list.
Our results indicate that community targeting led to much higher community satisfaction and better selected households that self-identified as poor; see Figure 2. Under the community targeting method, the community wanted to make relatively fewer changes to the beneficiary list and also submitted fewer complaints, about a third lower than with the PMT.
The reason for these differences was not that the community performed worse or did not have local information. Rather it appears that the community had more information than the central government and had chosen to weight this information differently. In other words, the community had a slightly different definition of poverty, which differed from the government’s definition of poverty, which was based on per capita consumption. For example, widows self-identified as poorer than other people with the same per-capita consumption level, perhaps reflecting a lower earning ability in their households. Communities also agreed and included widow-headed households on their targeting lists at a higher rate.
Not surprisingly, if the community has a different notion of what poverty is, and it targets based on its own definition, then it will also think it did a better job at targeting. Ultimately the tradeoffs between these two approaches come down to whether the government wants to target strictly based on per capita consumption, which is the typical measure used by the government to measure poverty, or whether it wants to recognize that communities have slightly different local perceptions of poverty and include those as well.
A second potential reason why satisfaction was higher in the community-based approach may be because it is a much more transparent method than a PMT. Because a PMT is based on complicated formulas, it is inherently less transparent than a community-based approach. For example, a household may have a TV but also have a dirt floor and a thatched roof, while
another household may have no TV and a cement floor and a tin roof. Under a PMT test, a household has no idea why those variables are relevant and how they combine to determine eligibility, and hence why one household receives the program while the other does not. We also found no evidence of elite capture in the community-based approach.
Taken together, these results imply that there are important tradeoffs to consider when choosing a targeting approach, and there can be benefits to adding a community-based approach to existing targeting methods.
Comparing Self-Targeting with PMT: In the second targeting evaluation, we studied an
automatic targeting approach compared to an on-demand application in the context of the expansion of the PKH program. The PKH program, Indonesia’s CCT program, targets the very poorest population in Indonesia. Targeting for this program is high-stakes, as households receive about 11 percent of their consumption, or about US$900, over six years.
For the study, a facilitator visited each village and explained that this program was opening and was going to screen on poverty, without giving the exact screening formula. If people were interested in the program, they had to apply at a specific time and nearby location, either at the subdistrict (kecamatan) or the village (desa/kelurahan) office or in their hamlet (dusun). Under the automatic PMT method, the government conducted a PMT door to door and automatically enrolled households below the poverty threshold. Under the on-demand
application method, households were required to apply for the program in advance. If they applied, their poverty status was verified by a PMT, and for those households close to the margin of eligibility, by a follow-up home visit as well.
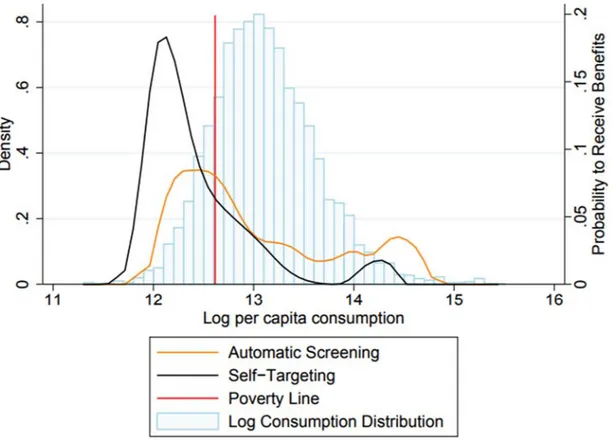
The results from this study indicate that requiring households to apply for benefits led more poor and fewer non-poor households to receive benefits compared to automatic screening; see Figure 3. In other words, in on-demand application villages a person had a higher probability of receiving benefits if they were very poor and a lower probability of receiving benefits if they were non-poor.
There are several different mechanisms driving these impacts. First, in the automatic enrollment villages, it is possible that, despite their best efforts, government enumerators may have missed some poor households during the PMT identification process. In comparison, in the on-demand approach, any poor household could make themselves known and apply, leading more poor households to receive the program and to a reduction in exclusion error.
Second, wealthier, ineligible households appear to have chosen not to apply. This can have significant budget implications because most of the population is ineligible (see the
histograms in the background in Figure 3). In general, since there are errors in the PMT, a small fraction (around 2 to 3 percent) of households over the eligibility threshold end up on the eligibility list. While there is a very small probability that these households receive the benefit, since 90 percent of the population is ineligible, the 2-3 percent of ineligible households that pass the PMT screen by mistake actually make up a relatively large proportion of total beneficiaries. In comparison, under self-targeting, many of those ineligible households self-select out of applying. In particular, under self-targeting, 61 percent of eligible households apply, while only 10 percent of ineligible households apply, indicating that households take their own income status into account when deciding to apply.
On net, these two effects combined meant that beneficiaries that were selected were 20 percent poorer on average in the on-demand application villages compared to automatic
enrollment. On-demand application, even though it has some potential risks, seems practical and effectively reduces both inclusion and exclusion errors.
One important issue is that different targeting methods may work better in different types of areas. To test this, both our targeting studies – comparing PMT vs. community, and
comparing on-demand application to PMT – took place in a mix of urban/per-urban and rural environments. In most cases, our results are broadly similar in both environments – though the differences between both PMT and community and on-demand vs. PMT are somewhat less pronounced in urban areas, the difference between urban and rural is not statistically significant in most cases.
The (Lack of) Distortionary Effects from PMT Targeting: A third question we have examined is
whether knowledge of what variables enter into the eligibility criteria for the PMT affects households’ investment decisions. In other words, when you tell people you will determine whether they get benefits based on a specific set of possible assets, does this distort their investment decisions?
To investigate this question, Abhijit Banerjee, Rema Hanna, Sudarno Sumarto and I have been working with BPS to conduct a randomized evaluation where the government randomly varied the questions asked in Indonesia’s 2015 National Social Welfare Screening (PBDT) in different provinces (Banerjee, Hanna, Olken, and Sumarto 2018). To keep the number of questions on the survey constant, each randomized question had one of two options. In half of the provinces, households received (1) either a question on flat screen television ownership or a question on the number of rooms in their house and (2) either a question on the number of active cell-phone SIM card numbers the household had or whether they had a modern toilet installed. We specifically chose our two key treatment questions—flat screen televisions and SIM card ownership—because we had access to independent data sources on actual asset ownership that did not rely on household self-reports.
We find that people appear to be paying attention, but the distortions seem limited. In provinces where we asked about TVs in the PBDT questions, households were about 16 percent less likely to report owning a flat-screen television in the next round of the SUSENAS survey, carried out six months later. However, by the next year, this effect disappears. More importantly,
actual TV sales—as measured by an independent survey of television retailers—did not appear
to decline. We also saw no changes on any of the other assets we tracked. Thus, while there is some evidence that asking those asset questions may change how people strategically report on a government survey, it does not seem to actually change consumption behavior.
C. Is Targeting Worth It?
The final topic I want to discuss in this section is the decision of whether to target at all. There has been tremendous attention in the world recently around the so-called Universal Basic Income (UBI). The general idea of a UBI is that instead of trying to figure out who is eligible,
the government should simply give the transfer to everybody. Such a scheme is still redistributive: if a country taxes in proportion to consumption, the rich are still paying
substantially more than the poor. So if everyone is receiving the same transfer, the scheme on net redistributes towards the poor.
The main downside of a universal transfer is that the beneficiaries receive less per person. For a given budget, if the government is aiming only at 10 percent of the population, it can give each beneficiary 10 times as much than if it gave the transfer to 100 percent of the population. In other words, when countries face a fixed budget, the transfer per person mechanically decreases when more people are included. With a universal transfer the government does save money because it does not have to run a poverty census, but it turns out that the cost of running a poverty census, even though it is large in dollar terms, tends to be very small compared to the budget of the transfer program itself.
An additional potential benefit from conducting a universal transfer is that the
government saves the cost of the targeting process. While intuitively this may seem large – after all, the government is going door-to-door to survey tens of millions of households – these costs pale in comparison to the magnitudes of benefits delivered. To be concrete, the 2015 Indonesian poverty census cost the Government of Indonesia approximately IDR 900 billion. The
Indonesian government typically conducted a new census once every 3 years; the annualized cost of doing the targeting is therefore about IDR 300 billion. By contrast, in 2019, total expenditures on targeted social protection expenditures (i.e. the value of all transfers allocated using the targeting census) amount to IDR 98 trillion (TNP2K, 2019). The annualized cost of running the targeting census, expressed as a fraction of the total amount of assistance being targeted, is therefore about three-tenths of one-percent. Given this, the benefits of not having to run the targeting census tend to be swamped by other considerations.
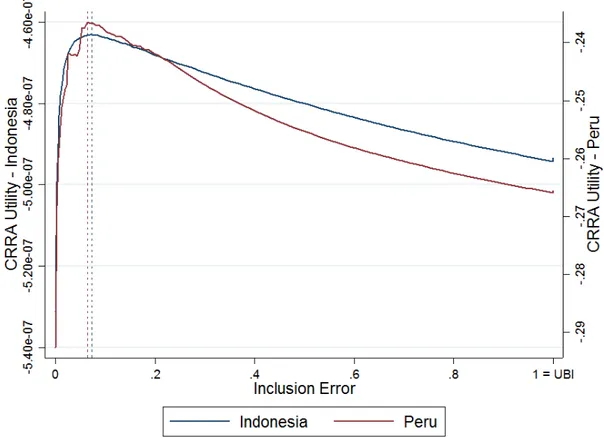
To quantify the remaining tradeoffs, Rema Hanna and I conducted a simulation where we considered different targeting approaches and their related targeting errors, holding the budget constant, and compared them to a universal program (Hanna and Olken 2018). How well a targeted program performs depends in part on the accuracy of the targeting. If the targeting is
very accurate, then a targeted transfer will perform relatively well at improving social welfare. If the targeting is not very accurate, then a universal transfer might perform better.
Figure 4 shows the results for simulations we conducted using data from both Indonesia and Peru. The results indicate that a program that is relatively narrowly targeted (i.e., one that targets about 19 percent of the population), which is reasonably close to the current Indonesian national targeting policy for many programs, achieves a much higher level of social welfare compared to universal programs. This result holds even when accounting for the cost savings from not having to run a poverty census, which, as discussed above, turn out to be very small in comparison to the transfers given out. In other words, targeted transfers, while imperfect, deliver a far greater improvement in welfare than a UBI would because they can transfer much larger amounts per beneficiary. The downside is that such a program does miss deserving people: in our calculations, exclusion error from such a program would be about 30 percent in Indonesia and about 20 percent in Peru.
* * *
In sum, findings from these studies on different targeting methods suggest that
community feedback can improve targeting, as it can improve perceived legitimacy and citizen satisfaction by making targeting lists conform better to local perceptions of poverty. Adding on-demand application to a PMT can improve targeting, both by reducing inclusion and exclusion errors. We do not see any distortion in household consumption or investment behaviors from the PMT surveys. And when countries have fixed budgets, targeted transfers—at least based on our simulations—look much more effective than universal transfers for helping the poor and
improving social welfare.
III. What Type of Assistance Should We Provide?
What type of assistance should we provide: cash, vouchers, or in-kind transfers? With each type of transfer, there is a trade-off between placing restrictions on how transfers can be used versus giving people more choice. Transferring cash allows the most choice for individuals. In-kind transfers, where the government gives recipients the good itself, offers the most
government control. Vouchers are an in-between option, where the government typically allows people to choose where to spend the transfer, but only for a restricted set of goods.
There are pros and cons to each of these options. Cash is very flexible, but there are political concerns around how people will spend the money, and concerns that prices may rise if there is limited supply. In-kind transfers can improve the supply of the subsidized good, which can be helpful in a limited supply environment, but also raise concerns around quality and leakages. In addition, people may not need the particular good they are given and value it lower than if they were given cash to buy what they needed most.
To the extent that the goal of the transfers is to stimulate health and educational investments (as in conditional cash transfer programs, for example), other questions come up, and in particular different approaches may be needed in more remote areas with less developed supply. I will discuss some pioneering work that Indonesia did in this area to adapt the ideas of CCTs to these kinds of environments.
A. Some Global Evidence
There is some existing global evidence on these questions. For example, Cunha, De Diorgi, and Jayachandran (2019) conducted a randomized trial in Mexico, where the government randomized whether beneficiaries in particular communities received in-kind transfers or cash. They found that in isolated communities, giving out cash caused prices for basic commodities to increase. The cash transfers created a demand shock, and with limited supply, caused prices to rise. In comparison, giving out in-kind assistance actually lowered prices in isolated
communities, acting as a positive supply shock. In Indonesia, one can imagine that price effects would not be a large concern in areas with thick markets, such as Java. However, in more remote areas, price effects could be very important to consider. Overall, this evidence suggests that existing supply constraints should be considered when switching from in-kind transfers to cash in isolated areas. We are currently exploring these questions in ongoing work in Indonesia.
A second study by Aker (2017) compared cash transfers to vouchers in a randomized evaluation in an internally displaced person (IDP) camp in the Democratic Republic of the
Congo. The study found little difference in overall wellbeing under either method, in part because people purchased similar goods. In urban Ecuador, Hidrobo et al. (2014) conducted a randomized evaluation to compare cash to in-kind transfers and to vouchers and found that all three types of transfers improved the quantity and quality of food consumption. The in-kind food transfers increased calories the most, while vouchers increased dietary diversity the most.
One other finding from these studies, as well as others, is worth noting. Across these studies, and in many other randomized evaluations on cash transfers,2 there is no evidence for the
commonly cited political concern that people spend cash transfers on “temptation goods,” such as tobacco or alcohol. However, there may be other important concerns around giving cash, such as if the government wants beneficiaries to spend the transfer on food or a specific good, or if there is limited supply.
B. Conditional Community Transfers in Indonesia
An important idea of conditional cash transfers is that, by incentivizing health and education, they may stimulate demand for these services. But in areas that are supply
constrained, stimulating demand for these services (and potentially leading to price increases if private providers are involved) without necessarily increasing actual service uptake. For remote locations, another approach may make sense.
Indonesia again was a leader worldwide in thinking about these issues. In 2005, Indonesia began planning the introduction of a CCT program in a working group led by Pak Bambang Widyanto, then at Bappenas. Given the concerns raised above, Indonesia chose to pilot two different types of programs: a traditional, household-based cash transfer program (a CCT), and a new program, aimed at more rural locations, that moved cash transfers to the community level rather than the individual level. The idea behind the community level grants was to use the block grants to directly increase supply in more rural locations. For example, a village could use the funds to hire a midwife or to start a remote school classroom (kelas jauh)—rather than stimulate demand through household cash transfers. This program was launched in 2007 and
2 Aker 2017; Banerjee et al. 2015; Banerjee et al. 2017; Blattman et al. 2017; Evans and Popova 2016; Haushofer and Shapiro 2016.
called Generasi Sehat Dan Cerdas (the Healthy and Smart Generation), or Generasi for short. The idea of incentives from CCTs was incorporated into Generasi. Each village received points for various health and education services it obtained, such as for each child immunized, each mother who received maternal care, each child enrolled in school, and so on, following the same set of conditions used in the household CCT. Villages in each kecamatan who earned more points would get a larger block grant the next year.
Moreover—and I want to emphasize how remarkable this is—the Government of Indonesia chose to evaluate both programs using randomized controlled trials, at the subdistrict (kecamatan) level. That is, the government first drew up a list of possible locations where the programs could take place. As funds were limited, not all kecamatans could receive the programs. The government therefore decided to randomly select which kecamatans would receive the program—176 kecamatans for Generasi and about 438 kecamatans for PKH—and which kecamatans would serve as control groups. Each of these evaluations separately
represented one of the largest randomized evaluations conducted anywhere in the world at the time. For Generasi, the government chose to evaluate both the program with incentives as described above, and an identical program without incentives, in order to test if the incentives mattered. I worked most closely on the Generasi evaluation, along with Junko Onishi and Susan Wong from the World Bank, and Vivi Alatas from the World Bank led the team on the PKH evaluation.
The conditional cash transfer found quite positive results after two years – consistent with evidence from around the world (Alatas 2011). It is important to note that the hypothesized supply side concerns were important. Even though PKH was focused on so-called “supply-side ready” locations, Triyana (2016) found that in the short run, Indonesia’s CCT program (the PKH program) increased delivery fees charged by midwives. However, this did not prevent the
program from increasing medical care overall. The number of midwives increased too, and on net medical care increased in PKH.
What about Generasi? We found that the program was also effective in increasing use of maternal and child health services, particularly weight checks for young children, and resulted in
reductions in malnutrition (Olken, Onishi, and Wong 2014). The program also increased school enrollments. The incentives in Generasi sped up how quickly the program results materialized. The program was also most effective in areas with the lowest levels of service delivery at baseline, such as rural locations in the NTT province. A cost-effectiveness calculation we conducted suggested that the program was similarly cost-effective to PKH, at least in the first two years.
On net, these two evaluations suggested that “one size may not fit all.” That is, different approaches may work best in different areas. Programs like Generasi may be particularly appropriate in areas with relatively low level of service supply. In terms of policy impact, both programs, PKH and Generasi, were subsequently scaled up. However, the scale-up of Generasi took this evidence in mind and focused primarily on the more rural and remote locations, where the program was found to be most effective.
C. How Do We Ensure that Assistance Reaches Eligible Families?
As in many developing countries, the Government of Indonesia wants to ensure that all of the benefits from social protection programs actually reach intended beneficiaries. However, challenges with leakages can reduce program impacts. How do we reduce leakages and ensure that all program benefits are reaching targeted beneficiaries? In particular, can strengthening access to information improve service delivery?
To study this question, Abhijit Banerjee, Rema Hanna, Jordan Kyle, Sudarno Sumarto and I conducted a randomized evaluation of Indonesia’s Raskin/Rastra program and studied whether providing people with information on program benefits for eligible households increased the amount of benefits that eligible households received (Banerjee, Hanna, Kyle, Olken, and Sumarto 2018). Raskin, as it was called at the time, was a program where the poorest 30 percent of households were entitled to about 15 kg of rice per month at about one-fifth of the market price. However, there were substantial leakages in the implementation of this program, both with ineligible households receiving subsidized rice and with actual delivery of the rice.
At the time we started, the Government of Indonesia was considering introducing identification (ID) cards as tangible proof for beneficiaries of what their rights were under the program. Providing this information to citizens could both inform them of their eligibility and entitlements under the program and also enable them to better bargain for their rights with local officials. However, it was unclear whether introducing the cards would actually work and be worth the potential economic or social costs. So the government invited us to work with them to conduct a randomized policy evaluation to determine whether these identification cards actually improve the functioning of the program.
In addition to testing the impact of the ID cards overall, the government also wanted to know what variation of cards would work best. We therefore also tested different variations, such as whether cards included information on just the quantity of subsidized rice that households were entitled to or both the quantity and price of subsidized rice, and whether beneficiary lists were shared publicly. We designed this evaluation explicitly in collaboration with the
government to help inform their decision between different program design choices they were considering.
Our results indicated that identification cards increased the subsidy eligible households received by about 26 percent, relative to comparison villages where identification cards were not mailed out (Figure 5). These results were despite the fact that not every eligible household actually received an ID card in treatment villages for various reasons. Interestingly, ineligible households received no less, indicating that there was an overall reduction in leakage, rather than just a transfer.
The content of the cards also mattered. Conditional on sending out the cards, the impact of the subsidy was doubled in villages where the cards included both price and quantity
information, compared to villages that received ID cards with only quantity information.
Publicizing beneficiary lists also increased the subsidy received by eligible households by around 25 percent, compared to villages that received ID cards without public information.
These results indicate that information matters, even for a program like Raskin, which in various ways had been around since 1999. Giving people tangible information about their rights seems to be an important component in ensuring they receive what they are entitled to. These positive results were one of many factors that led the government to actually scale up this program. In 2013, the government of Indonesia provided social protection identification cards to 15.5 million poor households, reaching approximately 65.67 million people. This is an example of how research can have concrete implications for policy, both in Indonesia but also more generally.
IV. What is the Impact of Assistance on Poverty and Well-Being? Evidence from Conditional Cash Transfers
A. Global Evidence
What is the impact of these transfer programs on poverty and wellbeing? I will focus my attention here on conditional cash transfers (CCTs), which as described above are a common type of social protection program. CCTs are typically conditional long-term programs where transfers are given regularly to poor households on the condition that households make human capital investments in their children. For example, for expectant parents conditions may include prenatal care, deliveries by a trained medical professional, and so on. After the child is born, the conditions continue through early childhood health investments and enrollment in primary and secondary schools. CCTs generally aim to not only improve the welfare of the recipient but also their children, through improving their children’s human capital accumulation.
CCTs began in the 1990s in Mexico, Bangladesh, and Brazil and have since spread worldwide. In 2014, over 60 countries had some type of CCT program. There has been some existing rigorous evidence conducted, in part by J-PAL affiliates, on the impact of CCT
programs in the short-run. This body of evidence has generally found that CCTs are effective in improving incentivized outcomes.3 There have also been a few studies on whether conditions are
even necessary, as they are costly to enforce, that compare conditional transfers to unconditional transfers. For example, in Morocco, Benhassine et al. (2015) compared a CCT to a “labeled” cash transfer (LCT), where the programs were described similarly but conditions were enforced
under the CCT and not enforced under the LCT. They found that outcomes under the CCT and LCT programs were very similar; adding conditionality in this context made almost no
difference.
In comparison, in Malawi, Baird, McIntosh, and Ozler (2011) conducted a randomized evaluation to compare unconditional cash transfers (UCTs), to CCTs, and found that there were tradeoffs with conditionality. Similar to other studies, they found that CCTs were effective at improving incentivized behaviors, but they also found that UCTs were more effective for certain types of individuals. For example, they found that UCTs were more effective in helping girls in this context delay marriage and child-bearing. They surmise that the CCTs successfully
incentivized some households to fulfill the incentivized requirements. However, there were other types of households who were so far below the margin of completing the incentivized activity that they did not respond to the incentive. Such households might have really benefitted from the cash transfer. In those cases, enforcing conditionality cut off cash from those households, which had a countervailing negative effect on that class of households. While these results confirm that CCTs improved incentivized indicators, they also indicate that enforcing conditions may have consequences, such as excluding benefits from households who are unable to meet conditions for various reasons.
B. Medium-Term Evidence from Indonesia
Most of the existing evidence on cash transfers looks at the short-run, but what happens in the longer run? As noted by Santiago Levy, a pioneer of the Progresa-Oportunidades CCT program in Mexico, “clearly achieving good health is a cumulative process, temporary investments in nutrition are of little help. The same is true of education: children must be supported year after year” (Levy 2006). This theory helps to explain why CCT programs
typically determine eligibility once and then give transfers to households for many years, as they want to support children as they grow up. However, it is difficult to study the long-term impact of CCTs. In most cases, the government gave the program to the comparison group after a relatively short period of time, making it difficult to learn about the long-run impacts of these types of programs. For example, in the well-known case of Progresa in Mexico, the control group received the program just 18 months after the study began.
In Indonesia, Nur Cahyadi, Rema Hanna, Rizal Adi Prima, Elan Satriawan, Ekki Syamsulhakim, and I recently conducted a medium-run study of the impacts of the PKH program, Indonesia’s CCT program (Cahyadi et al. 2018). As described above, in the original program design, 736 subdistricts, or kecamatans, were randomized to either receive PKH or to serve as a comparison group. The two-year results were analyzed by Alatas (2011).
It turns out that as the government expanded the PKH program after the initial evaluation, they prioritized expanding to new provinces and districts, to ensure that the program spread nationwide, rather than prioritizing the original comparison groups. Thus, without any researcher intervention, by 2013, more than six years after the program started, all of the original treatment locations from the first evaluation were still receiving PKH, and 60 percent of the original control group remain untreated. This created a unique opportunity to measure the impact of the CCT program over the longer run.
We found substantial improvements in health and education behaviors in both the short-run and the long-short-run. For example, the PKH program improved maternal delivery behaviors after two years, and effects increased in magnitude after six years. While there were no impacts on child immunizations after two years, the PKH program increased child immunizations after six years. Similarly, for school enrollment for older students (ages 15-17) there were no effects after two years, but there were positive effects after six years. This may be because the program was too late to affect this outcome in the original study, but the program increased enrollment for older students as children were exposed to the program year after year.
Perhaps most remarkably, after six years there is also some evidence of cumulative health impacts, particularly with reductions in stunting. Stunting is a major policy challenge in
Indonesia and can only be reduced through prolonged attention to weight and nutrition over a child’s early life cycle. Our results indicate that the PKH program actually reduced stunting after six years. This may be because the children evaluated in the long-term study benefitted from the PKH program for a substantial part of their early childhood, where they and their mothers were
supported by the program for six years through cash transfers, better maternal health investments, and childhood investments.
Overall, what we find is not that the PKH program is radically transforming the economic wellbeing of households. Rather, evidence suggests that sustained investments in these
households over time can lead to better human capital investments in their children. This in turn could help break the inter-generational cycle of poverty and improve things in the longer term.
We also came back to Generasi in the same way, almost 10 years after the program started. Similar to PKH, when Generasi was expanded, the government prioritized new areas of the country (and in particular, more remote areas, following the results of the original
evaluation). As a result, the original control group received no special priority in receiving the program but the treatments continued in treatment areas, creating an opportunity to evaluate the longer-term impacts of the program.
We found that as Indonesia experienced economic growth, the supply-side conditions grew in both treatment and control areas. Many of the original areas that were initially supply-deficient were no longer so 10 years later. As a result, the program, which was most effective in areas with low levels of service delivery at baseline originally, had substantially muted effects 10 years later (Olken and Sacks 2018). The program was still effective in areas with the lowest levels of service delivery, particularly on outcomes such as child weight checks, immunizations, and Vitamin A levels. However in general, the changing health and education environment in Indonesia suggests that which policy mix is most appropriate for a given place may need to change too. The contrasting results—with increasing effects over time for PKH but decreasing effects over time for Generasi in most locations—suggest the importance of continuing to gather evidence on program effectiveness over the longer-term, as the environments in which programs operate evolve.
V. Conclusions
Throughout all of these examples, I have described an iterative process between the Government of Indonesia and both domestic and international scholars to identify key policy
challenges and generate evidence to improve the design of social programs. Over more than a decade-long partnership, we have together generated policy lessons around improving the targeting of social protection programs, strengthening transparency and reducing leakages, moving from in-kind transfers to cash, and addressing policy challenges such as stunting. As challenges have evolved, we have worked closely with the government to answer new policy questions in a rigorous way. As a result, Indonesia has become a leader for generating rigorous policy-relevant evidence for the rest of the world.
The results of the process described here are useful far beyond Indonesia. Indeed, part of the iterative process here is that the topics we prioritized for new studies are those which are not only immediately relevant to Indonesian policymakers, but also are helping contribute to global knowledge. The work in Indonesia has led to renewed academic interest in related targeting questions, which have taken place in multiple countries in sub-Saharan Africa (Dupas et al 2016; Dizon-Ross et al 2017) and elsewhere. As other countries reform their targeting systems and benefit the lessons learned from Indonesia can help inform them as well.
References
Alatas, Vivi. 2011. Program Keluarga Harapan: Impact Evaluation of Indonesia's Pilot
Household Conditional Cash Transfer Program (English). Washington, DC: World Bank.
http://documents.worldbank.org/curated/en/589171468266179965/Program-Keluarga-Harapan-impact-evaluation-of-Indonesias-Pilot-Household-Conditional-Cash-Transfer-Program.
Alatas, Vivi, Abhijit Banerjee, Rema Hanna, Benjamin A. Olken, and Julia Tobias. 2012. "Targeting the Poor: Evidence from a Field Experiment in Indonesia." American Economic
Review 102(4): 1206-40.
Alatas, Vivi, Abhijit Banerjee, Rema Hanna, Benjamin A. Olken, Ririn Purnamasari, and Matthew Wai-Poi. 2016. "Self-targeting: Evidence from a Field Experiment in
Indonesia." Journal of Political Economy 124(2): 371-427.
Aker, Jenny C. 2017. “Comparing Cash and Voucher Transfers in a Humanitarian Context: Evidence from the Democratic Republic of Congo.” The World Bank Economic Review 31(1): 44-70.
Baird, Sarah, Ephraim Chirwa, Craig McIntosh, and Berk Ozler. 2010. “The Short-Term Impacts of a Schooling Conditional Cash Transfer Program on the Sexual Behavior of Young Women.”
Health Economics 19(S1): 55-68.
Baird, Sarah, Francisco Ferreira H. G., Berk Ozler, and Michael Woolcock. 2014. “Conditional, Unconditional, and Everything in Between: A Systematic Review of the Effects of Cash Transfer Programs on Schooling Outcomes.” Journal of Development Effectiveness 6(1): 1-43.
Baird, Sarah, Craig McIntosh, and Berk Ozler. 2011. “Cash or Condition? Evidence from a Cash Transfer Experiment.” The Quarterly Journal of Economics 126(4): 1709-1753.
Banerjee, Abhijit, Esther Duflo, Nathanael Goldberg, Dean Karlan, Robert Osei, William Pariente, Jeremy Shapiro, Bram Thuysbaert, and Christopher Udry. 2015. “A Multifaceted
Program Causes Lasting Progress for the Very Poor: Evidence from Six Countries.” Science 348(6236): 1260799.
Banerjee, Abhijit, Rema Hanna, Gabriel Kreindler, and Benjamin A. Olken. 2017. “Debunking the Stereotype of the Lazy Welfare Recipient: Evidence from Cash Transfer Programs.” The
World Bank Research Observer 32(2): 155-184.
Banerjee, Abhijit, Rema Hanna, Jordan Kyle, Benjamin A. Olken, and Sudarno Sumarto. 2018. “Tangible Information and Citizen Empowerment: Identification Cards and Food Subsidy Programs in Indonesia.” Journal of Political Economy 126(2): 451-491.
Banerjee, Abhijit, Rema Hanna, Benjamin A. Olken, and Sudarno Sumarto. “The (Lack of) Distortionary Effects of Proxy-Means Tests: Results from a Nationwide Experiment in
Indonesia.” National Bureau of Economic Research Working Paper No. 25362, December 2018. Benhassine, Najy, Florencia Devoto, Esther Duflo, Pascaline Dupas, and Victor Pouliquen. 2015. “Turning a Shove into a Nudge? A “Labeled Cash Transfer” for Education.” American Economic
Journal: Economic Policy 7(3): 86-125.
Blattman, Chris, Julian Jamison C., and Margaret Sheridan. 2017. “Reducing Crime and Violence: Experimental Evidence from Cognitive Behavioral Therapy in Liberia.” American
Economic Review 107(4): 1165-1206.
Cahyadi, Nur, Rema Hanna, Benjamin A. Olken, Rizal Adi Prima, Elan Satriawan, and Ekki Syamsulhakim. “Cumulative Impacts of Conditional Cash Transfer Programs: Experimental Evidence from Indonesia.” National Bureau of Economic Research Working Paper No. 24670, November 2018.
Cunha, Jesse M., Giacomo De Giorgi, and Seema Jayachandran. 2019. "The Price Effects of Cash versus In-Kind Transfers." The Review of Economic Studies 86(1): 240-281.
Dizon-Ross, Rebecca, Pascaline Dupas, and Jonathan Robinson. 2017. "Governance and the effectiveness of public health subsidies: Evidence from Ghana, Kenya and Uganda." Journal of
public economics 156: 150-169.
Dupas, Pascaline, et al. 2016. "Targeting health subsidies through a nonprice mechanism: A randomized controlled trial in Kenya." Science 353.6302: 889-895.
Evans, David K., and Anna Popova. 2017. "Cash Transfers and Temptation Goods." Economic
Development and Cultural Change 65(2): 189-221.
Gertler, Paul. 2004. "Do Conditional Cash Transfers Improve Child Health? Evidence from PROGRESA's Control Randomized Experiment." American Economic Review 94(2) : 336-341. Hanna, Rema, and Benjamin A. Olken. 2018. "Universal Basic Incomes versus Targeted Transfers: Anti-Poverty Programs in Developing Countries." Journal of Economic
Perspectives 32(4) : 201-26.
Haushofer, Johannes, and Jeremy Shapiro. 2016. “The Short-Term Impact of Unconditional Cash Transfers to the Poor: Experimental Evidence from Kenya.” The Quarterly Journal of
Economics 131(4): 1973-2042.
Haushofer, Johannes, and Jeremey Shapiro. “The Long-Term Impact of Unconditional Cash Transfers: Experimental Evidence from Kenya.” Working Paper, January 2018.
Hidrobo, Melissa, John Hoddinott, Amber Peterman, Amy Margolies, and Vanessa Moreira. 2014. “Cash, Food, or Vouchers? Evidence from a Randomized Experiment in Northern Ecuador.” Journal of Development Economics 107: 144-156.
Honorati, Maddalena; Gentilini, Ugo, Yemtsov, Ruslan G. 2015. The State of Social Safety Nets
http://documents.worldbank.org/curated/en/415491467994645020/The-state-of-social-safety-nets-2015
Krueger, Alan B., and Bruce D. Meyer. 2002. "Labor Supply Effects of Social Insurance." Handbook of Public Economics 4: 2327-2392.
Levy, Santiago. 2006. Progress Against Poverty: Sustaining Mexico’s Progresa-Oportunidades
Program. Washington, DC: Brookings Institution Press.
Moffitt, Robert A. 2002. "Welfare Programs and Labor Supply." Handbook of Public
Economics 4: 2393-2430.
Olken, Benjamin A. 2006. "Corruption and the Costs of Redistribution: Micro Evidence from Indonesia." Journal of Public Economics 90(4-5): 853-870.
Olken, Benjamin A., Junko Onishi, and Susan Wong. 2014. "Should Aid Reward Performance? Evidence from a Field Experiment on Health and Education in Indonesia." American Economic
Journal: Applied Economics 6(4): 1-34.
Olken, Benjamin and Audrey Sacks. Indonesia - Long-Term Impact Evaluation of Generasi
(English). Washington, D.C.: World Bank Group, 2018.
Shultz, T. Paul. 2004. “School Subsidies for the Poor: Evaluating the Mexican Progresa Poverty Program.” Journal of Development Economics 74(1): 199-250..
Triyana, Margaret. 2016. “Do health care providers respond to demand-side incentives? evidence from Indonesia.” American Economic Journal: Economic Policy 8(4): 255-88.
World Bank Group. 2017. Closing the Gap: The State of Social Safety Nets 2017. Washington, DC: World Bank. https://openknowledge.worldbank.org/handle/10986/26655.
Figure 1: Targeting Error Under Each Targeting Method
Notes: Results show targeting errors, as defined as either inclusion or exclusion error, and error bars represent 95% confidence intervals from Alatas et al. (2012).
30% 33% 33% 0 0.05 0.1 0.15 0.2 0.25 0.3 0.35 0.4
Figure 2: Impact of Three Different Targeting Methods on Community Satisfaction
Notes: Results show measures of community satisfaction, and error bars represent 95% confidence intervals from Alatas et al. (2012). 1.46 0.97 1.69 0.88 0.41 0.61 1.54 0.80 1.14 0.0 0.2 0.4 0.6 0.8 1.0 1.2 1.4 1.6 1.8 2.0
Number of households that should be added to
beneficiary list
Number of households that should be removed from
beneficiary list
Number of complaints in suggestion box PMT method Community method Hybrid method
Figure 3: Distribution of Beneficiaries Under Self-Targeting vs. Automatic Screening
Notes: Author’s calculation showing probability of receiving benefits by per-capita consumption level and treatment, using data from Alatas et al. (2016). The light blue histogram shows the overall distribution of log per-capita consumption.
Figure 4: Social Welfare vs. Inclusion Error Tradeoff, Simulations for Indonesia and Peru
Notes: Reproduced from Hanna and Olken (2018). For each cutoff value c, we calculate the per-capita benefit amount
for included households and then calculate constant relative risk-aversion utility with 𝜌 3. If a household is not included in the program at a given value of c, we simply set bi = 0. Dashed lines indicate the point of maximum social
Figure 5: Impact of Raskin Cards on Subsidy Received Per Eligible Household (Rp/month)
Notes: Results show the average amount of benefits received by eligible households in treatment and control villages, and error bars represent 95% confidence intervals from Banerjee, Hanna, Kyle et al. (2018).
28,605 36,060 0 5000 10000 15000 20000 25000 30000 35000 40000