Determining the Concentration and Source of Lead in Chocolate Using Lead Isotopes
by
Jessica A. Thompson
Submitted to the Department of Earth, Atmospheric and Planetary Sciences in Partial Fulfillment of the Requirements for the Degree of
Bachelor of Science in Earth, Atmospheric and Planetary Sciences at the Massachusetts Institute of Technology
June 1, 2007
Copyright 2007 Jessica A. Thompson. All rights reserved.
The author hereby grants to M.I.T. permission to reproduce and distribute publicly paper and electronic copies of this thesis
and to grant others the right to do so.
Author:
Signature redacted
Departient of Ba ,o ric and Planetary Sciences June 1,2007
Cetii
__b:
Signature redacted_________lBowin
Certified by:__ __________
>1 -Samuel Bowring
Accepted
by:_Signature
redacted
Thesis Supervisor Samuel Bowring MASS ITE N51UTE C) Chair, Committee on Undergraduate Program
TE N 0fG Y
MITLibraries
77 Massachusetts Avenue
Cambridge, MA 02139 http://Iibraries.mit.edu/ask
DISCLAIMER NOTICE
Due to the condition of the original material, there are unavoidable flaws in this reproduction. We have made every effort possible to
provide you with the best copy available. Thank you.
The following pages were not included in the original document submitted to the MIT Libraries. This is the most complete copy available.
Determining the Concentration and Source of Lead in Chocolate Using Lead
Isotopes
by
Jessica A. Thompson
Submitted to the
Department of Earth, Atmospheric and Planetary Sciences
June 1, 2007
In Partial Fulfillment of the Requirements for the Degree of
Bachelor of Science in Earth, Atmospheric and Planetary Sciences
ABSTRACT
Single-origin dark chocolate samples derived from cocoa grown in developing countries from around the world were analyzed to determine their lead concentrations and the isotopic composition of the lead. The lead isotope ratios were compared with published data from aerosols and volcanic rocks nearest to the cocoa growing regions. Samples from different
countries and manufacturers were compared, and we conclude that the source of lead depends on the country of origin and not the manufacturer. Chocolates grown in the Northern Hemisphere usually had lead isotope ratios that matched the global atmospheric lead isotopic signature from the Northern Hemisphere. Chocolates grown in the Southern Hemisphere did not match the global signature, but rather more closely matched the lead isotopic signature from volcanic rocks in their respective countries, and had a lower average lead concentration than chocolates from the Northern Hemisphere. Soils from Venezuela were also analyzed, and confirmed the conclusion that atmospheric lead is the predominant source of bioavailable lead. Many of the chocolates also had lead concentrations below the limit of 0.1 ppm set by the FDA; however, one manufacturer, Dagoba, consistently had lead concentrations above the limit. The percent of cocoa in each chocolate bar was also compared with the lead concentrations, concluding that the concentration of lead is not necessarily dependent on the amount of cocoa in the bar.
Thesis Supervisor: Samuel Bowring Title: Professor of Geology
Acknowledgements
Writing a thesis is never an easy thing, and I could not have done it without the help and patience of many people.
First, I am forever indebted to Sam Bowring and Frank Dudas for their countless hours of help, advice, and patience. Frank for all of his extra time training me in the clean lab, taking care of my samples when I wasn't around, running them on the mass spectrometer, helping me find references and Pb literature data when I was having difficulty, his many hours editing my writing, his encouragement, and his patience with me as I learned what writing a thesis was about. I would not have anything without his help. Sam, too, for hours of editing and advice at all hours of the day, pushing me to work my hardest despite it being spring term senior year, and letting me know when I'm very wrong and need to rethink something. Without his advice and support I couldn't have done it either.
I would also like to thank Kelly Roberts for all of her help in the clean lab as well - training me, and taking care of my chocolates when I wasn't around, and the rest of Sam's lab (especially for tolerating the horrible smell of burning chocolates).
I am also thankful for the help of Joe Hankins and Chris Sherratt in the Lindgren Library. They
spent many hours helping me gather resources that were sometimes difficult to track down, and were always willing to drop everything to give me a hand.
Others who have helped me along the way include Andy Wickert and Mariela Perignon, for their advice and time as they listened to me reason through my thesis, and especially Mariela for her help with information and samples regarding Venezuela. Also, my roommate and best friend Becky Idell, for her patience, encouragement, and support listening to me complain and talk for hours about my thesis. Vicki McKenna and Jane Connor were also a big help in writing and presenting my thesis.
I would also like to thank my parents, sister, and brother, for all of their support and
Contents
A bstract... . . 2
A cknow ledgem ents... 3
C ontents... . 4
L ist of F igures...5
L ist of T ab les...7
C hapter 1: Introduction ... 10
Chapter 2: Background Information...13
2 .1 L ead ... . . 13
2.1.1 Sources of Lead...13
2.1.2 Atmospheric Lead...17
2.1.3 L ead in Soils... 18
2.1.4 Lead as an Environmental Tracer...19
2.1.5 Health Effects of Lead Exposure... 21
2.2 Chocolate & C acao...24
2.2.1 Chocolate & Cacao Production...24
2.2.2 Lead in Chocolate...28
2.3 Previous Studies of Lead in Chocolate...29
C hapter ... . ..33
3.1 Preparation of the Samples...33
3.1.1 Preparation of Chocolate Samples...33
3.1.2 Preparation of Soil Samples...35
3.3 Mass Spectrometry...38
3.4 Possible Sources of Error...38
C hapter 4: D ata... 40
C hapter 5: D iscussion... 41
5.1 Comparison of Data in Determining the Source of Lead...41
5.1.1 Sam e L ocation...4 1 5.1.2 Same Manufacturer...42
5.1.2.1 Temporal Sample Heterogeneity: Same Product, Different Bar...42
5.1.2.2 Sample Heterogeneity: Same Product, Same Bar, Different Analysis Time...43
5.1.2.3 Different Product...45
5.2 Comparison of Data to Literature to Determine the Source of Lead...46
Case Studies: E cu ad or...4 8 V enezuela... 50
P eru ... . . 53
Central America & Caribbean...55
W estern A frica...57
Southeast A sia...58
Eastern Africa & Madagascar...60
5.3 Comparison of Data in Determining the Concentration of Lead...65
5.4 Soil Analysis from Venezuela...69
5.4.2 Lead Concentrations in Soil...73
5.5 Im plications... 74
Chapter 6: Conclusions... 77
Chapter 7: Future Studies...79
List of Figures
F igure 1: T he lead cycle...15
Figure 2: Atmospheric distribution of aerosols...18
Figure 3: A sample plot of Pb isotope ratios from sediment samples, Lima 2005...20
Figure 4: A sample plot of Pb isotope ratios showing how to determine sources...21
Figure 5: A graph of the average blood lead levels from various cities worldwide...23
Figure 6: A graph of vehicular lead emissions and median blood lead levels in the United States... . . .. 23
Figure 7: A map of cacao producing countries worldwide...25
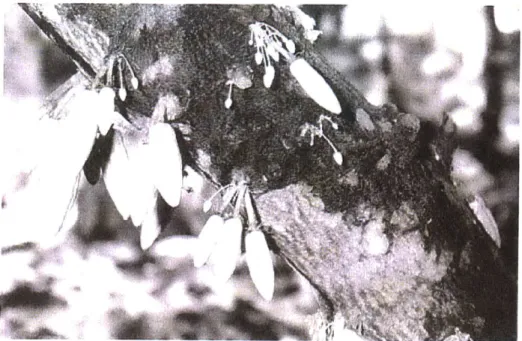
Figure 8: A photo of cacao pods still attached to the cacao tree...26
Figure 9: A photo of a cacao pod...26
Figure 10: A photo of cacao pods fermenting...27
Figure 11: A photo of cocoa beans...28
Figure 12: A bar graph of Pb concentrations in cocoa products from Rankin 2005 ... 30
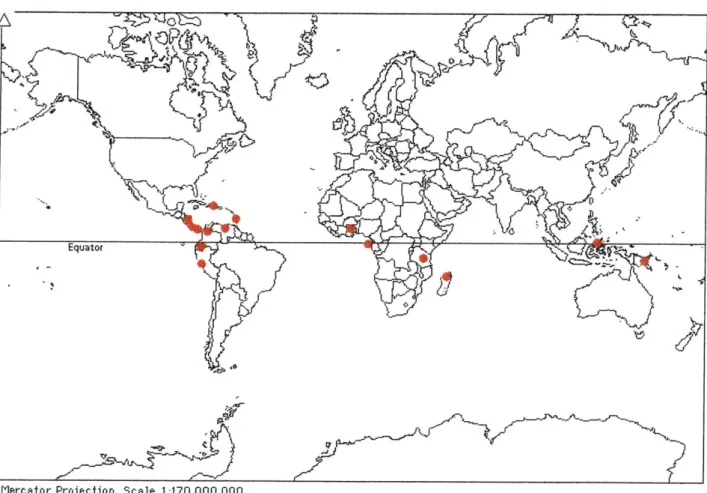
Figure 13: A map of chocolate sample locations...33
Figure 14: A graph of the comparison of lead isotope ratios of various countries...42
Figure 15: A graph of the comparison of lead isotope ratios of the same manufacturer...45
Figure 16: A graph of the comparison of lead isotope ratios of different manufacturers...46
Figure 17: A graph of the comparison of 206 Pb/ 204 Pb vs. 207 Pb204 Pb and 206 Pb/ 204 Pb vs. 208Pb!204 Pb isotope ratios of chocolate, atmospheric & rock samples, Ecuador ... 49
Figure 18: A graph of the comparison of 206 Pb/ 204 Pb vs. 207 Pb/204 Pb isotope ratios of chocolate, atmospheric & rock samples, Ecuador, and atmospheric data from the Northern H em isphere... . ... 50
Figure 19: A graph of the comparison of 206 Pb/ 204 Pb vs. 207 Pb/2 04 Pb and 206 Pb/ 204 Pb vs. 208Pb!204 Pb isotope ratios of chocolate, atmospheric & rock samples, Venezuela...51
Figure 20: A graph of the comparison of 206 Pb/ 204 Pb vs. 207 Pb!204 Pb isotope ratios of chocolate,
atmospheric & rock samples, Venezuela, and atmospheric data from the Northern
H em isphere... 52
Figure 21: A graph of the comparison of 206 Pb/ 204 Pb vs. 207 Pb!204 Pb and 206 Pb/ 204 Pb vs. 208Pb/ 04 Pb isotope ratios of chocolate, atmospheric & rock samples, Peru...54
Figure 22: A graph of the comparison of 206 Pb/ 204 Pb vs. 207 Pb204 Pb and 206 Pb/ 204 Pb vs. 208Pb!204 Pb isotope ratios of chocolate, atmospheric & rock samples, Central America & the C aribbean ... 56
Figure 23: A graph of the comparison of 206 Pb/ 204 Pb vs. 207 Pb204 Pb isotope ratios of chocolate, atmospheric & rock samples, Central America & the Caribbean, and atmospheric data from the N orthern H em isphere...57
Figure 24: A graph of the comparison of 206 Pb/ 204 Pb vs. 207 Pb204 Pb and 206 Pb/ 204 Pb vs. 208Pb!204 Pb isotope ratios of chocolate, atmospheric & rock samples, Western Africa... 59
Figure 25: A graph of the comparison of 206 Pb/ 204 Pb vs. 207 Pb204 Pb isotope ratios of chocolate, atmospheric & rock samples, Western Africa, and atmospheric data from the Northern H em isphere... 60
Figure 26: A graph of the comparison of 206 Pb/ 204 Pb vs. 207 Pb204 Pb and 206 Pb/ 204 Pb vs. 208Pb!204 Pb isotope ratios of chocolate, atmospheric & rock samples, Southeast Asia... 61
Figure 27: A graph of the comparison of 206 Pb/ 204 Pb vs. 207 Pb204 Pb and 206 Pb/ 204 Pb vs. 208Pb!204 Pb isotope ratios of chocolate, atmospheric & rock samples, Eastern Africa & M adagascar... 62
Figure 28: A graph of the comparison 208 of 206 Pb/ 204 Pb vs. 207 Pb204 Pb and 206 Pb/ 204 Pb vs. Pb!204 Pb isotope ratios of chocolate, atmospheric & rock samples, Madagascar...63
Figure 29: A frequency distribution of Pb concentrations in chocolate...66
Figure 30: A bar graph of the average Pb concentrations by manufacturer...67
Figure 31: A plot of the percent cocoa vs. the concentration of Pb in chocolate bars...68
Figure 32: A map showing the location of the soil sample collection site in Venezuela...69
Figure 33: A graph showing the 206 Pb/204 Pb isotope ratios vs. soil sample depth...71
Figure 34: A graph of the comparison of 206 Pb/ 204 Pb vs. 207 Pb204 Pb and 206 Pb/ 204 Pb vs. 208Pb 204 Pb isotope ratios of chocolate, atmospheric, rock, & soil samples, Venezuela.. .72
List of Tables
Table 1: Temporal sample heterogeneity: same product, different bar...43 Table 2: Differences in temporal sample heterogeneity of different manufacturers...43 Table 3: Sample heterogeneity: same product, same bar, different analysis time...44 Table 4: Differences in sample heterogeneity: same product, same bar, different analysis time..44 Table 5: Surface soil Pb concentrations...73 Table 6: 30 cm deep soil Pb concentrations...73
Chapter 1. Introduction
Lead contamination from anthropogenic sources has increased since the industrial revolution. The most common sources of anthropogenic lead include the combustion of leaded gasoline, the production of steel and base metals, the mining and smelting of lead ores, and the combustion of
coal. The global record of both natural and anthropogenic atmospheric transport and deposition of lead in the environment has been monitored using both lead concentrations and isotopic compositions in sediments, ice, soils, and peat bogs. Though lead is released into the
environment through natural weathering of rocks, several analyses of variations in the isotopic composition of lead (Bollhofer 2000, 2001, 2002, Gulson 1981, Lima 2005) have shown a strong correlation between the increase in anthropogenic lead emissions and the amount and source of lead detected in the environment.
Lead contamination in food has become a "hot button" environmental issue, leading the U.S. Food and Drug Administration (FDA) and the World Health Organization (WHO) to set limits on the maximum allowable concentrations. More recently, concern about the amount of lead in chocolate has become an issue in the United States. In 2003, the American Environmental Safety Institute (AESI) even went so far as to sue the Hershey Food Corporation and Mars Incorporated, two well-known chocolate manufacturers, for dangerous levels of lead in their chocolate
products (Morrison & Foerster, www.mofo.com/practice/practice/enivornmental/prop65/ overview.html). This case prompted an in-depth study of lead in chocolate and other candy products, focusing on whether the concentrations were high enough to cause danger to young
children, who are more susceptible to lead poisoning than adults. The studies determined that the amount of lead in one chocolate bar is not enough to be dangerous; however, lead is a cumulative poison (O'Neill 1993). While a single chocolate bar may not contain enough lead to be
concerned about, the average American consumes between 10-12 pounds of chocolate or chocolate products each year (http://www.rawcacao.com/). For the AESI case, some chocolates from common grocery stores in California were found to have concentrations as high as 0.11
g/g or ppm, while most were around 0.01 pg/g (Heneman 2006). Using the high value, over the
course of a year, the average American could ingest a total of 499 -599 pg of lead! Recently, a new trend has entered the market: single origin dark chocolate bars, specializing in rich
chocolate flavors, served at trendy chocolate cafes (Kauffman 2005). These dark chocolates have a higher cocoa bean and cocoa fat content than milk chocolates, which are often diluted with milk, sugar and other ingredients. The higher cocoa bean and cocoa butter content (which has been suggested to have higher lead concentrations than cocoa beans (Mounicou 2003)) in
dark chocolate means dark chocolates could, on average, a higher lead concentration.
The source(s) of lead contamination in chocolate are the subject of debate. Most manufactured chocolate comes from cacao plantations in developing countries situated within 20 degrees of the equator, where simple, non mechanized farming methods are often used to gather the cacao pods and remove the beans. The beans are laid out to ferment and dry under the sun before being shipped to more developed countries for further cleaning, roasting, and final processing. The long journey the beans take from cacao plant to manufactured chocolate bar allows for many possible sources of contamination along the way. A previous study (Rankin 2005) found a correlation between the isotopic composition of aerosol lead and that in chocolate, suggesting
that contamination may occur while drying or fermenting under the sun. However, these studies also found a relatively low lead concentration in cocoa beans compared to the manufactured chocolate products, leading Rankin to conclude that most lead contamination occurs in the shipping or manufacturing process.
Lead isotopic ratios are a powerful tool for recognizing contamination and tracing the source(s) of lead in food, and these are important steps in minimizing human exposure. Though chocolate is widely consumed, neither the sources nor levels of lead contamination have been thoroughly studied. This study focuses on the analysis of both concentrations and the isotopic composition of lead in chocolate to constrain the source(s) of lead. In this study I compare the isotopic composition of Pb in various chocolate samples with those from aerosols measured at various stations around the world in the 1990s and early 2000s, as well as rock lead and soil isotopic compositions from the regions near where cacao plantations exist. This should allow one to distinguish between "naturally occurring" Pb and anthropogenic Pb to determine the source of lead in chocolate.
Chapter 2. Background Information
2.1 Lead
2.1.1 Sources of Lead
Lead is a naturally occurring chemical element that occurs in concentrations from a few parts per billion (ppb) to tens's of parts per million (ppm) in most rocks and minerals. However Pb can also be highly concentrated by hydrothermal processes in ore deposits that are often mined for industrial uses. Terrestrial lead is a combination of the lead incorporated into the building blocks of the earth during condensation and accretion of our solar system, and lead that has formed due to radioactive decay of uranium and thorium. Primordial lead compositions have been obtained from metal or sulfide rich meteorites that contain very small amounts of uranium and thorium; thus their lead isotopic compositions have changed very little over the past 4.567 billion years, the conventionally accepted age of the earth. Lead is produced by the decay of three radioactive
isotopes. They are 2 3 2Th, 23 5U, and 2 3 8U, which decay into 20 8Pb, 207Pb, and 206Pb, respectively.
Although 204Pb is weakly radioactive (TI/2= 1.4 x 10¹⁷ years) it is often used as a reference
isotope because its quantities have remained essentially constant over earth history. Isotopic compositions of lead are usually expressed as ratios of the abundances of a lead isotope with a standard, such as 206Pb, to 204Pb. The primordial composition of different lead ratios is (Oversby
1970): 206Pb /204Pb 9.346 207Pb /204Pb 10.218 208Pb /214Pb 28.96
The isotopic composition of any lead is variable and depends on the U/Pb ratio of the mineral it resides in. For example, the isotopic composition of galena ore (PbS) does not change once it is precipitated because the U/Pb ratio is essentially zero. However, a zircon crystal has a very high
U/Pb ratio and over time the U decays to Pb. In fact, since we know the rate of radioactive
decay, this mineral can be used to calculate geological ages. Lead in ore minerals such as galena is scavenged from large volumes of rocks through which hydrothermal fluids circulate. Thus, the ore's isotopic composition reflects the age and U/Pb ratio of all the rocks that contributed Pb and the values are very much average values. This, however, is why each ore deposit tends to have a distinctive range of isotopic compositions and why we can then use that to trace Pb as it moves through the environment. Lead in minerals and rocks is released during chemical
weathering (Faure 1991). Although there are small amounts of lead in the soil, the water, and the air, it tends to be in low concentration, is not a hazard to humans, and is referred to as "naturally occurring".
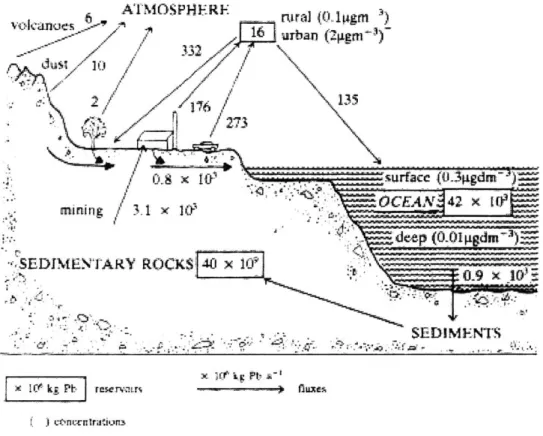
.- I, - 6 ATPf M0.5P H E-_R F ta ~16 urban (2g.r) 0.8 x surfae (0.igdm-) .0CEA 42 X 1 mining I X 1/ deep (O Dipgdn)i SEDIMENTARY ROCKS 40 x 105 SEDIMF 'Ih x I rf k_; b rsre ue ( j contcntrak'in
Figure 1: The lead cycle (from O'Neill 1993). A diagram showing the distribution and flows of lead in the environment.
Much of the lead in our environment today is anthropogenic. For example, natural sources only contribute about 4% to the total lead in the atmosphere (Faure 1991). Figure 1 illustrates the lead cycle, showing the flow and distribution of natural and anthropogenic sources within the environment. Natural lead in the atmosphere derives from windblown dust, plant exudates, forest fires, volcanic eruptions and seasalt spray (Faure 1991). A history of lead accumulation is recorded in snow, ice, lacustrine sediments, and plants (Faure 1991). In fact, Greenland ice cores have shown a 400 -fold increase in lead concentration between 800 BC and
1965 AD (O'Neill 1993). Anthropogenic sources of lead include the combustion of leaded
gasoline, the production of steel and base metals, the mining and smelting of lead, and the combustion of coal (Faure 1991). There are two major uses of lead by humans: in lead-acid
largest source of lead in the environment, particularly in developing countries where leaded gasoline is still used today.
The use of lead in gasoline as an anti-knock additive was common in the US for over 50
years until the mid 1970s when it was mandated that it be removed (Elsom 1992). Lead as a gasoline additive only contributes about 2.2 percent of the total lead use worldwide in contrast to
63 percent that is used in the manufacturing of batteries - yet it is the lead in gasoline additives that has had the largest effect on human health worldwide (Finkelman 1996); this is because vehicle emissions are directly into the environment. To combat this, as of 1996, two years after the Summit of the Americas where governments agreed to phase out leaded gasoline, 6 countries in the Western Hemisphere have completely removed the lead in gasoline, 13 countries have reduced to levels of 0.4 g/L, and 16 countries continue to sell leaded gasoline with levels of 0.8
g/L (Finkelman 1996). As of 2007, only 17 nations worldwide still regularly sell gasoline,
mostly in the Middle East and Africa (http://www.lead.org.au/fs/fst27.html). However, though the amount of lead in gasoline is being reduced worldwide, the number of vehicles that operate on gasoline is increasing. In Venezuela, for example, lead levels in gasoline have been reduced from 0.84 g/L to 0.45 g/L in the late 1990s (Venezuela has recently passed laws to phase out
leaded gasoline), but the number of vehicles has nearly tripled since the 1970s, creating a large increase in the total amount of lead released into the environment (3,763 to 5,492 tons/year) (Finkelman 1996). While leaded gasoline may no longer be a significant contributor to atmospheric lead in developed countries, in developing countries, some with higher lead concentrations in gasoline and economic and population increases, lead contamination from gasoline remains a serious issue.
2.1.2 Atmospheric Lead
Before the mid twentieth century, atmospheric pollutants were thought to affect only the areas immediately surrounding the emission sources (Elsom 1992). However we now understand that atmospheric contaminants may travel very long distances, and can affect locations far from the emission source (Elsom 1992). Atmospheric pollution can affect the quality of soils, water, vegetation, climate, animals, and buildings (Elsom 1992). While air pollution control measures have been put in place in many developed countries, most of the developing countries still lack proper plans to control or deal with air pollution, worried that such restrictions could negatively
affect their economic and industrial growth (Elsom 1992).
As previously mentioned, leaded gasoline is a large contributor to lead aerosols in the
atmosphere. Over 70% of the lead in combusted gasoline enters the atmosphere, and of this, 40% falls quickly nearby on roads or surrounding areas, 8% within average city limits of a few miles, and up to 24% becomes widely dispersed (Elsom 1992). This widely dispersed lead is caught in atmospheric circulation, where it has a residence time of 1-2 weeks and can travel thousands of kilometers (Elsom 1992). Figure 2 illustrates the paths some aerosol particles can take.
18Or 90W 0" 0E1 Is ~ i-F Tr ~ 1 1 T- I I I -9CZ40" I .r 2 2.I.SAL .. 90*S b Fr0 90"1 1 -72 ~ 1BOO
Figure 2: A map of the world, from Elsom 1992, showing the atmospheric circulation of aerosols. The top image shows atmospheric circulation during January, and the bottom image shows atmospheric circulation during July.
Anthropogenic lead in the atmosphere accounts for 96-99% of the total atmospheric lead deposition (Erel 1997). The concentration of aerosol lead particles varies significantly with location, with large cities having 2-4 jg/cubic meter, and suburban and rural areas often having 2 jig/cubic meter or less (Elsom 1992).
2.1.3 Lead in Soils
Lead accumulates in soils from a combination of airfall deposition and bedrock weathering (Erel
1997). Lead is found in soil as a trace element in both primary and secondary silicate minerals.
in the upper few centimeters (O'Neill 1993). Lead levels in soils vary a great deal, depending on atmospheric deposition and proximity to point sources of pollution. The residence time of lead in soil is between 17 and 80 years (Miller and Friedland 1994).
2.1.4 Lead as an Environmental Tracer
Lead isotopes can be used to fingerprint different sources of lead in the environment, including distinguishing between rock-derived and anthropogenic lead (Erel 1997). In general, the isotopic ratios of ore deposits, which are sources for anthropogenic uses through mining, are often less radiogenic than lead that is released from the weathering of rocks (Erel 1997) and large ore deposits have distinctive isotopic signals. This is a basis for distinguishing between
anthropogenic lead (ie, lead from ore deposits) and so called "natural" lead. By analyzing the isotopic composition of lead in environmental samples, it is possible to trace the origin of the lead by comparing the ratio from the sample to known anthropogenic and natural ratios from previous studies.
Lead isotopes have another major attribute that make them an excellent proxy for tracing environmental pollutants, particularly in the United States. Lead's isotopic composition is not affected by changes in the geological environment, such as weathering (Gulson 1986), and therefore it can travel in the environment without changing its isotopic composition, allowing for it to be traced to a source.
There is a great deal of information in the isotopic composition of lead and over the years a number of plotting schemes have been developed to deconvolve multiple components in
environmental lead samples. Lead isotopes are usually plotted in ratio/ratio space such as (206Pb
/204Pb ) versus
(207Pb /204
Pb). When conducting environmental studies, this is useful to explore
and constrain different sources of Pb. Figure 3 is an example of this, with the lead isotope compositions of various ore deposits and coal plotted with samples taken from lake Erie,
Pettaquamscutt River and Chesapeake Bay demonstrating that the leads in the sediment samples are averages of industrial Pb (from Lima 2005).
2.8 -Possible Sources 2.7 2.6 2.5 c~4 4- 4E ~2.4 4s.~ . 2.3
4-2.2 m Lake Erid A Upper Mississippi 0 Pettaquamscutt River A SE Missouri
A Chesapeake Bay o Central MissourilTri-State
2.1 - Coals + Other Districts
1.0 1.1 1.2 1.3 1.4 1.5 1.6
20Pb / 2Pb Figure 3: A plot of 206Pb /207Pb and 20'Pb /207
Pb isotope ratios from ores, coals and recent
sediment samples, from Lima 2005.
Plotting the 206Pb /204Pb vs. 207Pb /204Pb and 206Pb /204Pb vs. 208Pb /204Pb ratios is also useful in
constraining sources. The isotopic compositions of ore deposits reflect the average U/Pb and Th/Pb ratio of the source from which the Pb is derived. The 206Pb /2 04Pb vs 207Pb /204Pb plot is for
uranogenic Pb and the 2 06Pb /204Pb or 207Pb /204Pb vs 20 8Pb /204Pb highlights differences in
thorogenic Pb (2 08
environmental Pb samples. Figure 4 shows an example of how using both the 206Pb /204Pb and
207Pb /204Pb and 206Pb /204Pb and 208Pb /204Pb ratios is useful in constraining a source. By plotting
the different ratios, the source of lead can be determined (in this case, sample series A is contaminated by "ore", whereas sample series B is not).
2..0H-thEfet cfLa Exposur
MFsguema.sAwplo arefaffePb ed bPb ead 0 PisoniPg a 2 Pbee /ePsnd toP /lead fraticosm
household items (Faure 1991). These include paint, water pipes, solder, leaded gasoline,
ammunition, storage batteries in automobiles, and glaze on pottery to name a few (Faure 1991). Those who work in a lead-rich environment, such as miners and smelters of lead, have a high risk of lead poisoning (Faure 1991). Young children are especially at risk for lead poisoning. Children with high exposure to lead at an early age are at risk for neurobehavioral disorders (Heneman 2006).
The World Health Organization has set the lead exposure standards at 3 pg per person per week for adults, and less than 1 ptg per person per week for children and infants (O'Neill 1993). The rate of absorption of dietary lead is about 8 percent per year, but if lead enters the lungs, over 40 percent is absorbed. The absorbed lead enters the bloodstream, and is distributed throughout the body. The lead then accumulates in different locations throughout the body, most commonly in soft tissues, bones, and hair, for up to one month. Lead that accumulates in the bones can remain there for anywhere from 40-90 years (O'Neill 1993).
Lead is a cumulative poison, with over 90 percent of ingested lead retained in our bones (O'Neill
1993). It binds strongly to many molecules, such as amino acids, hemoglobin, many enzymes,
RNA and DNA; it disrupts metabolic pathways and impairs blood synthesis, causing
hypertension, hyperactivity, and brain damage (O'Neill 1993). Early lead poisoning symptoms include loss of appetite, colic, pallor, weight loss, fatigue, and irritability (Faure 1991).
The more serious symptoms of lead poisoning are well documented. Anemia, with a decrease in hemoglobin levels, is an early sign, usually occurring around blood levels of 50 pg/dl in adults, and 40 ptg/dl in children (Betts 1973). Brain dysfunction begins at levels of 50-60 [ig/dl in
children and 60-70 ptg/dl in adults. Acute or chronic encephalopathy and kidney damage occur at levels of 60-70 pg/dl in children and 80 tg/dl in adults (WHO 1977).
Average blood lead levels worldwide range from 6 pig/dl in Beijing, China, to 10-20 ptg/dl in Europe, to 22 pg/dl in Mexico, to as low as 3 tg/dl in the United States (UK Royal Commission on Environmental Pollution 1983). Figure 5, from Lovei 1998, shows the drastic difference in
blood lead levels between different cities worldwide. However, the blood lead levels have dropped considerably with the reduction of lead in gasoline. In the United States alone, average levels dropped from 15.8 pg/dl in the 1970s to 10 gg /dl in the 1980s (Elsom 1992), and even lower, to around 3 gg/dl in 1990 (USEPA), as depicted in Figure 6.
40/ I- 35-26-6 a 10 600 20 -116 80 -1-2 600 a)W
Figure 5: A graph fromwoe 9,dpcing the deveasrageea bloo d levels for vaius ciearmion
ithe word.Tentd deas0 Stfrtes975-v9r.ae muloweprd tedvdo mainyoer iies worldwde.
1n e 20104 .2 60 ) 0 __ I I 10 V20 0O D-C n q ' ' 00.C P0m
Vehiculr Leadtisiossk -Median Blood Lead Lvl
Figure 6: A graph showing the decrease in median blood lead levels and vehicular lead emissions in the United States from 1975-1990. The blood lead level drop coincides directly with the decrease in vehicular lead emissions (USEPA).
2.2 Chocolate & Cacao
2.2.1 Chocolate and Cacao Production
Chocolate is produced in the equatorial regions of the world (see Figure 7), limiting cultivation to between about 20 degrees north and south of the equator (Urquhart 1966). Cacao grows mostly in fertile soils with rainfall between 1250 - 3000 mm/year and a dry season of no longer
than three months (Clay 2004). Cacao plants are sensitive to heat, sunlight and wind. They grow best between a temperature of 18-32 degrees Celsius (with an absolute minimum of 10 degrees
C), and within the shelter of an older forest that serves as both a windbreak and shade from the
sunlight. Cacao plants are also sensitive to both waterlogged soils and dry soils, and cannot be grown in previously cultivated soils (Clay 2004). In addition to these strict environmental conditions, cacao plants also only grow at low elevations (Urquhart 1966). Cacao plants
themselves are usually between 115 meters in height. The plants begin producing pods after
2-3 years, and by 6-7 years will produce a full harvest (Beckett 2000). Flowers on the cacao plants
grow into small pods (Figure 8), called cherelles, and take 5-6 months to develop into mature pods (Figure 9), each containing between 30-45 beans (Beckett 2000).
NQRTH AMERICAn ivolorWASIA - ATi'ANtiC~ AFR3CA~ 0 Equator ~TH AMERICA
lb
20rFigure 7: A map of the world, with major cacao-producing countries highlighted in yellow (from www.guittard.com). All cacao is grown near the equator, where there are warm temperatures, low elevations, and a fair amount of rainfall.
Many cacao plantations harvest cacao pods every 1-4 weeks over a period of a few months. The pods are opened, often with a machete, and the beans are removed. When first removed, the beans are covered in a white pulp that must be removed by hand. The beans are fermented, sometimes by placing them within a pile of banana leaves on the ground (Figure 10).
Fermentation differs for each type of cacao, and varies between 1 and 6 days. After the beans are fermented, they are laid out to dry in the sun (Figure 11). They are usually spread out on mats, trays, or terraces in a layer about 100 mm thick, and are raked at intervals throughout the day. In Venezuela, the beans are sometimes laid out to dry along the side of the road (M. Perignon, personal communication). If drying takes more than one day or if it rains, the beans are heaped up and covered at night. Laying the beans out leads to risk of contamination from the
surroundings, atmosphere, and from farm and wild animals wandering through them.
~~hAN.
Figure 8: Cacao pods while still attached to the tree. These are cut from the tree with a machete before being opened and the cocoa beans removed (Urquhart 1966).
Figure 9: Cocoa beans in a cacao pod. The beans are still surrounded by a white pulp that must
be removed before further processing (http://chocolate.org/health/cocoa-beans.jpg).
The dried beans are stored in jute sacks, and usually transported by ship, where care is taken to prevent moisture from entering the sacks, which causes the beans to mold and lose their flavor.
Upon arrival to the country where they will be processed, the beans are cleaned and their shells removed. After all impurities, such as stones and dust, have been removed from the beans, they are roasted and ground for further processing.
Figure 10: Cacao pods fermenting on top of banana leaves (Urquhart 1966).
There are three main varieties of cacao plants: the criollo, forastero, and trinitarios, each associated with a different quality of cocoa produced from the fruits. Forastero produces a rich chocolate flavor suitable for milk chocolate while criollo and trinitarios produce a more bitter flavor that is usually blended (Lass 1985). The different flavors of the beans also depend on the climate and soil conditions as well (Beckett 2000).
Figure 11: Cocoa beans after they have been removed from the cacao pod (http://www.gourmetsleuth.com/images/cocoabeans.jpg ).
There are three main cocoa producing areas in the world. These include countries such as Ghana and the Ivory Coast in Western Africa, South-East Asia, and South America. Currently, over 40% of the world's cocoa is grown in the Ivory Coast, and 14% is grown in Ghana (Beckett 2000).
2.2.2 Lead in Chocolate
Chocolate, like many foods, contains trace metals, such as lead and cadmium. However, the amount of the trace metal that is available for the body to retain is quite small (Mounicou 2003).
A study by Mounicou concluded that less than 10 percent of the lead in ingested chocolate was
retained the body.
2006). The FDA has set the limit at 0.1 ppm for chocolate products. Almost all chocolates that
have been analyzed worldwide have been found to fall well below this limit (Heneman 2006).
2.3 Previous Studies of Lead in Chocolate
Recent studies have shown that chocolate manufactured in the United States has relatively low levels of lead, often ranging from 0.01 pg/g to 0.0965 ptg/g (Heneman 2006). A study performed
by a Swiss research group in 2002 tested chocolate products worldwide, and also found them to
fall well below the limit set by the FAO and the WHO (Heneman 2006). However, other studies have shown that there is contamination in manufactured chocolate products, despite the fact that previously analyzed cocoa beans have some of the lowest reported lead concentrations among all
foods worldwide (Taylor 2005). An analysis of the cocoa bean shells by Rankin et al 2005 indicated elevated lead concentrations. While the average concentration for cocoa beans was around 0.512 ng/g or ppb, cocoa bean shells had values as high as 160 ng/g (Rankin 2005). Even higher were the lead concentrations in manufactured cocoa and chocolate products, which had values as high as 230 ng/g and 70 ng/g, respectively, shown in Figure 12 (Rankin 2005).
A previous study by Mounicou et al 2003 found that the amount of lead in cocoa products
changes during the processing. During the roasting of the beans, the concentration rises due to water loss, but during the cleaning and grinding that follows, there is a large (fivefold) decrease in the concentration (Mounicou 2003). After further processing, the concentration drops further, but increases during the production of cocoa butter (Mounicou 2003).
Cocoa beans
Cocoa bean shells
---Chocolate products
Manufactured cocoa ___________________
0 50 100 150 200
Lead concentration (ng/g)
Figure 12: (from Rankin, 2005) A graph showing the differences between manufactured cocoa products, cocoa beans, and shells.
It has been proposed that much of the lead in the chocolate products is from atmospheric
deposition onto growing cacao plants which is dominated by lead from gasoline (Rankin 2005). Previous studies have shown that cocoa bean shells have higher lead concentrations, protecting the cocoa bean while in the shell, and suggesting that contamination must occur later in the process, possibly during the fermentation and drying of the cocoa beans, after the bean is
removed from the pod (Rankin 2005). If the pods or shells are imperfectly removed and crushed with the beans, the resulting product could have elevated lead despite a relatively small volume of shell.
The isotopic composition of lead in manufactured chocolate products is within the range of industrial lead aerosols, providing evidence that most of the contamination occurs during the transportation of the cocoa beans, and final processing and manufacturing of the bean, cocoa, and chocolate products (Rankin 2005).
One possible pathway for contamination is from atmospheric deposition on the cocoa beans while drying. Here the beans are outside of the protective pod and exposed to the air. A study by Bollhofer concluded that most of the lead found in the atmosphere is from coal burning, mining and smelting operations, and gasoline emissions because of a close lead isotopic match between the atmospheric signature and these sources (Bollhofer et al 2005).
While Rankin's study presents a strong argument for contamination of chocolate during the drying and manufacturing process given the high concentrations of lead in manufactured
products, there are several points that need to be considered before accepting his thesis. First, the cocoa shells have much higher concentrations of lead, by an order of magnitude, than the beans. During the harvesting and manufacturing of cocoa, the beans are removed from the shells and go through various cleaning stages to remove the excess shells before final processing. However, it is impossible to remove all of the shells - a few are bound to slip through, and be processed with the remaining cocoa beans. Because the shells have such a higher concentration of lead than the beans, just a small amount of shells mixed in with the beans could greatly change the
concentration of the end product. Another point to consider is that sizes of the samples that Rankin measured for lead concentrations. A bean or a shell is significantly smaller, and the lead less concentrated, than an average-sized candy bar, so then naturally it would have less lead in it. It is difficult to draw a conclusion about the concentrations of lead in manufactured cocoa
products and cocoa beans if the cocoa content or addition of ingredients is not taken into account. Also, Rankin reports lead concentrations and ratios of manufactured products that are milk chocolate. The additional ingredients in milk chocolate lower the overall concentration of lead, and Rankin fails to mention how various kinds of chocolate might be affected. Dark
chocolate, with a higher concentration of cocoa, is likely to have a higher concentration of lead. Finally, Rankin's analysis of manufactured chocolate is only from companies that purchase beans from multiple continents, thereby creating a mixture of various cocoa beans, while the cocoa beans he analyzed in his study are only from a few farms in Nigeria. Comparing the two values yields inconclusive results. Rankin's study, currently the most well known analysis of lead in chocolate, requires more information before anything conclusive can be determined.
Chapter 3. Methods
3.1 Preparation of the samples
3.1.1 Preparation of the chocolate samples
Mercator Projection, Scale 1:170,000,000
Figure 13. Map of locations (shown as red dots) of chocolate samples that were analyzed during this study.
A variety of chocolates from developing, cacao-producing countries around the world were
bought at a local grocery store. The locations of samples are shown on a map in Figure 13. The chocolate samples were prepared for analysis. First, a clean, empty silica glass crucible, with
A 1tZ Equator 0 AX p ifJ
crucible, broken into smaller pieces. The chocolate samples were then heated in a muffle furnace to remove organics for 2 hours at 80 degrees C, 2 hours at 200 degrees C, and 12 hours at 600 degrees C. The samples were then cooled.
After the samples cooled, 1 mL concentrated nitric acid was added to each sample and the samples were dried down on hot plate. The purpose of the nitric acid steps is to oxidize the remaining organics, to take the entire sample into solution, and to homogenize the sample. This step was repeated after the samples had dried down. Then 0.2 mL concentrated nitric acid was added to each beaker, along with 3 aliquots of 100 ptL hydrogen peroxide. The peroxide reacted with each sample before the next aliquot was added. This step should have destroyed all
remaining organic matter in the sample. The nitric acid - peroxide solution was then dried down. Two mL 6 M HCl were added to each beaker, the beakers capped, and placed on the hot plate to reflux for at least an hour. This step washed the spatter that collected on the walls of the beaker back into the sample solution and converted the sample to chloride form. After the samples refluxed for more than an hour, the caps were removed and the samples dried down.
When the samples were dry, the crucibles were taken off the hot plate and cooled. The samples were taken up in 0.5 mL 1.1 M HBr. The samples were spiked with a 208Pb spike. The weight of
the crucible with the HBr-sample solution was recorded. A clean Teflon beaker, with 3 drops of
208
Pb spike, was also weighed, recording the weight of the spike. Fifty ptL of the HBr-sample
solution was pipetted into the Teflon beaker, and the total sample weight recorded. These spiked samples were used for concentration determinations by isotope dilution (ID). The samples were
dried down, and then taken up in 0.5 mL 1.1 HBr. The remaining unspiked HBr solution was transferred into clean Teflon beakers for isotopic composition (IC) analysis.
3.1.2 Preparation of the soil samples
Each soil sample was analyzed in duplicate. For each soil sample, approximately 0.3 g of soil was weighed into a 5 mL centrifuge tube. Two empty tubes were used for blanks, and processed along with the samples. Three mL reagent ethanol were added to each centrifuge tube. The tubes were placed in an ultrasonic bath for approximately 5 minutes to mix the ethanol with the soil. The tubes were then placed in a hot water bath on a hot plate for an hour. Twice during this 1 hour period, the tubes were removed and placed into the ultrasonic bath for 5 minutes. After one hour, the samples were centrifuged for 5 minutes. For each sample, a clean, empty, 15 mL Teflon beaker was labeled and weighed. The ethanol was pipetted from the centrifuge tube into the beaker as cleanly as possible. The beaker was capped and set aside. Three mL hot MQ water were added to each centrifuge tube. The samples were placed in the ultrasonic bath for at least 5 minutes to suspend the solids in the water. The centrifuge tubes were placed into the hot water bath for 15 minutes. After 15 minutes, the samples were put into the ultrasonic bath for 5 minutes. The samples were centrifuged for another 5 minutes. The water was pipetted from the centrifuge tubes and added to the ethanol extracted in step 4. The ethanol - water mixture was allowed to cool for at least 1 hour, then the Teflon beakers with the extracted liquid were
weighed. Three mL hot 1 M HCl were added to the solid residue from the ethanol extraction and the centrifuge tubes placed into the ultrasonic bath for 10 minutes, making sure that all of the soil was suspended in the acid. After 10 minutes, the samples were centrifuged for 5 minutes. For each sample, a clean, empty, 15 mL Teflon beaker was labeled and weighed. The HCl was
pipetted from the centrifuge tube into the beaker. The beaker was capped and set aside. Three mL hot MQ water were added to each centrifuge tube. The samples were placed in the ultrasonic bath for at least 10 minutes to suspend the solids in the water. After 10 minutes, the samples were centrifuged for 5 minutes and the water was pipetted from the centrifuge tubes and added to the HCl extracted in step 9. The HC1 - water mixture cooled for at least 1 hour, then the Teflon beakers with the extracted liquid were weighed. MQ water was used, sparingly, to transfer the solid residue as completely as possible to clean, weighed 15 mL Teflon beakers. The samples were dried. When the samples were dry, the beakers and sample were weighed, then 3 mL fresh aqua regia were added to each sample. The beakers were capped lightly and placed on the hot plate to reflux for at least 8 hours. The beakers were left loosely capped overnight to prevent buildup of gases in the beaker. After 8+ hours of reaction, the samples were transferred to 15 mL centrifuge tubes and centrifuged for 5 minutes. For each sample, a clean, empty, 15 mL Teflon beaker was labeled and weighed. The aqua regia was pipetted from the centrifuge tube into the beaker. The beaker was capped and set aside. Ten mL hot MQ water were added to the residue. The tube was mixed with the vortex mixer to suspend the solids, and set aside for 10 minutes. After 10 minutes, the tube was mixed on the vortex mixer again, then centrifuged for 5 minutes. The water from the centrifuge tube was added to the Teflon beakers with the aqua regia. The samples cooled for at least 1 hour, then were weighed. MQ water was used to suspend the solids, and transfer the residues to clean, weighed, 15 mL Teflon beakers. The samples were dried, then 1 mL conc. nitric acid and 3 mL conc. hydrofluoric acid were added to each. The beakers were capped and refluxed on the hot plate at least 8 hours. The samples were dried down. One mL conc. nitric acid was added to each, then the samples were dried down again. This process was repeated twice more. Then 3 mL 6 M HCl were added to each sample, and the beakers were
capped and refluxed for 8 hours. The samples were then aliquotted for IC and ID. The IC aliquot is used to determine the isotopic composition of the Pb, and the ID aliquot is used for calculating the concentration of Pb by adding a known amount of 208 Pb. For IC, 1 mL of each solution was
aliquotted. For ID, 0.1 ml of each solution was spiked with 2-3 drops of 208 Pb spike. An ID
solution weight and a spike weight were recorded, and the samples pipetted into clean, labeled beakers. The samples were then prepared for column chemistry. The samples were dried down, and 1 mL conc. nitric acid was added to each, then the samples were dried down again. 0.2 mL conc. nitric acid were added to each, then 3 increments of 100 pL of hydrogen peroxide were added to each. The samples were allowed to react with the peroxide before the next increment was added. The samples were then dried down, and 1 mL 6 M HCl was added, and the beakers were capped and refluxed for an hour. After being dried down, 0.5 mL 1.1 M HBr were added to each.
3.2 Column Chemistry
Pb column chemistry was performed for both the IC and ID samples. First, 120 pL columns were
cleaned with MQ-water and set up using Eichrom AGl-X8, 200-400 mesh Cl- form resin. The columns were cleaned twice using 1000 tL of 6 M HCl, and equilibrated using 500 pL of 1.1 M HBr. The samples were then loaded into the columns, with small plastic cups placed underneath to catch the waste. The empty Teflon beakers with 2 mL 6 M HCl were placed on the hot plate to be cleaned while continuing with columns. A drop wise rinse was performed by dropping one drop of 1.1 M HBr through the columns 5 times, followed by a bulk rinse using 500 pL of 1.1 M HBr. The bulk rinse was repeated, this time using 500 pL of 2 M HCl. The samples were eluted
using 1000 ptL of 6 M HCl to extract the lead, then dried down on the hot plate using 1 gL of 0.1M H3PO4.
Once the samples were dried down, they were loaded on Re filaments for analysis in the mass spectrometer.
3.3 Mass Spectrometry
The chocolate samples were analyzed using a TIMS (Thermal Ionization Mass Spectrometer). Mass spectrometers are instruments that measure the abundance of isotopes through separating charged atoms based on mass dependent deflection in a magnetic field. The sample, loaded on a Re filament in silica gel and phosphoric acid, is heated until it is volatized, causing ionization of the atoms into vapor. The ions are accelerated into a beam, and enter a magnetic field that deflects the ions into certain paths depending on their mass. The heavier ones are deflected less than the lighter ones.
3.4 Possible Sources of Error
During the course of this study we were concerned with identifying and quantifying the sources of uncertainty in both the concentrations and isotopic compositions of lead in the chocolate samples. The concentration data are dependent on quantitative extraction of all the Pb from the chocolate, weighing errors, and sample heterogeneity. Apparent variations in lead content could be caused if extraction were not 100%. The simplest way to quantify this is by replicate analyses which are a measure of the heterogeneity of Pb in individual bars as well as our ability to extract the Pb. Based on our data this is about 0.16-0.20 %.
The use of thermal ionization mass spectrometry for measuring isotopic ratios results in relatively small error bars on all isotopic ratios (in general < 0.05 %) which in most cases is many times smaller than the variability in composition that we are interpreting. Sources of uncertainty in Pb isotopic measurements include total processing blank (includes incineration, digestion, and chemical separation), uncertainty in mass dependent fractionation, and counting statistics.
Chapter 4. Data
A total of 52 analyses was done on 41 different chocolate and cacao products. These represent 13 different distributors and manufacturers, and cacao sources in 15 different countries.
Additionally, 16 analyses were done on two soil samples. Samples and raw data are listed in the appendix.
Chapter
5.
Discussion
5.1 Comparison of Data in Determining the Source of Lead
The typical one sigma analytical uncertainties for the TIMS isotopic analyses in this study are 206Pb /204Pb
0.008, 207Pb /204Pb 0.010,208 /204Pb = 0.033, based on analysis of NBS 981 Pb standard (N=36).
5.1.1 Same Location
Chocolate samples that are from the same geographic location but manufactured by different companies were found to have similar lead isotopic ratios. These data, shown in Figure 14, suggest that the lead in chocolate is a function of the location where the beans are grown. With a few exceptions, the lead isotopic composition of chocolates from the same country plot near each other, which is expected if they have the same source of lead. A comparison of the manufacturers follows in a later section.
Comparison of Lead Isotope Ratios from Various
Countries
15.8- Ecuador .P +7Venezuela C,, 15.7 -a A a Sao Thome - 15.6- A A Madagascar CL o Peru o 15.5 -4 Dominican Republic 15.4- m Costa Rica 17.6 17.8 18 18.2 18.4 18.6 18.8 19 Data Error 206 Pb 1204 PbFigure 14: A plot showing the 20 6Pb /204Pb vs. 207Pb /204Pb ratios of chocolate samples, labeled by the country where the beans were grown. The data suggest that chocolate from each locality has a distinctive isotopic composition. With only a few exceptions, such as two data points from Ecuador and one from Costa Rica, all of the ratios from chocolate from the same location plot relatively close to each other. A small data point showing the typical one sigma analytical uncertainty is shown.
5.1.2 Same Manufacturer
5.1.2.1 Temporal Sample Heterogeneity: Same Product, Different Bar
Several of the chocolates were processed and analyzed a second time to determine if the manufacturer is the source of lead contamination, and to check the reproducibility of the first analysis. These samples are from the same manufacturer and the same product, but a different chocolate bar, purchased in two locations and at different times, probably representing different cacao crops. The lead isotopic compositions are listed in Table 1, and the differences in the ratios are shown in Table 2. Neither is within a typical one sigma analytical uncertainty of one
the different cacao crops and plantations used throughout the years. More work will be necessary to understand this.
Table 1: A table showing the 206Pb /204Pb, 207Pb /204Pb and 208Pb /204Pb ratios of two chocolate
bars where the samples were run a second time to check reproducibility and determine if the manufacturer is a possible source of contamination. The difference between replicates in the case of Los Rios #2 is quite large, suggesting heterogeneous distribution of Pb throughout time.
Sample
Number Sample Name 206Pb /204Pb 207Pb /204Pb 208Pb /204Pb
T 1273 Dagoba Pacuare Costa Rica 18.459 15.645 38.435
T 1288 Dagoba Pacuare #2 Costa Rica 18.402 15.611 38.276
T 1274 Dagoba Los Rios Ecuador 18.338 15.590 38.181
T 1289 Dagoba Los Rios #2 Ecuador 17.796 15.561 37.591
Table 2: Table showing the differences in the 206Pb /204Pb, 207Pb /204Pb and 208Pb /204Pb ratios
from "replicate" chocolate bars
Sample 206 Pb /204Pb 207Pb /204Pb 208Pb /204Pb
Newman's Own Costa Rica- minimum 0.059 0.005 0.006
Newman's Own Costa Rica-maximum 0.173 0.033 0.155
Dagoba Pacuare Costa Rica 0.057 0.034 0.159
Dagoba Los Rios Ecuador 0.542 0.029 0.590
5.1.2.2 Sample Heterogeneity: Same Product, Same Bar, Different Analysis Time
Analysis of a suite of samples was repeated in order to compare with previous measurements that were done in April of 2004. These samples are from the same manufacturer, and the same
chocolate bar of the same product. Results are shown in Table 3 and Figure 15. The differences between the ratios of samples are shown in Table 4. However, they agree within two-sigma analytical uncertainty for all ratios except 208Pb/206Pb suggesting reasonably good reproducibility
despite the complex dissolution and separation procedure. The discrepancy needs further investigation.
Table 3: A table showing the data plotted in Figure 15. The JF samples were 2004, and the T samples were analyzed in 2007.
analyzed in April of
Sample
Number Sample Name 20 6
Pb /204Pb 207 /204Pb 208Pb /204Pb
T 1220(2) Chocovic Ocumare Venezuela 18.221 15.637 38.248
JF 2(2) Chocovic Ocumare Venezuela 18.180 15.608 38.101
T 1221(2) Chocovic Guaranda Ecuador 18.552 15.666 38.614
JF 3(2) Chocovic Guaranda Ecuador 18.541 15.648 38.601
T 1222 Trader Joe's, Sao Tome 18.144 15.630 38.149
JF 4(2) Trader Joe's, Sao Tome 18.163 15.623 38.149
T 1223 365 Organic Swiss, Dominican Republic 18.493 15.669 38.754
JF 7 365 Organic Swiss, Dominican Republic 18.481 15.648 38.394
T 1224 Newman's Own #2, Costa Rica/Panama 18.631 15.665 38.427
JF 8 Newman's Own #2, Costa Rica/Panama 18.583 15.627 38.282
T 1224(2) Newman's Own #2, Costa Rica/Panama 18.533 15.634 38.266
JF 1(2) Newman's Own #1, Costa Rica/Panama 18.706 15.660 38.421
T 069(3) Newman's Own #1, Costa Rica/Panama 18.690 15.648 38.384
Table 4: Table of difference between the ratios of the samples analyzed in 2004 and 2007.
Manufacturer 206Pb /204
Pb 207Pb /04 Pb 208
Pb /204Pb
Chocovic Ocumare Venezuela 0.041 0.029 0.147
Chocovic Guaranda Ecuador 0.011 0.018 0.013
Trader Joe's, Sao Tome 0.019 0.007 0.000
365 Organic Swiss, Dominican Republic 0.012 0.021 0.360
Newman's Own #1, Costa Rica/Panama 0.098 0.038 0.161
Newman's Own #2, Costa Rica/Panama 0.016 0.012 0.037
Pb Ratio Comparison of Replicate Analyses of the Same
Chocolate Bar
15.70
-Chocovic Ocumare Venezuela
o ChocovicGuaranda Ecuador
0.- 15.65
-Trader Joe's Sao Tome
15.60 - 365 Organic Swiss Dominican
Republic
Newman's Own Costa Rica/Panama
15.55
17 70 17.90 18.10 18-30 18.50 18.70 18.90
206 1204 Pb
Figure 15: A plot of 206Pb /204Pb vs. 207Pb /204Pb from analyses of different chips from the same chocolate bar. The samples analyzed in 2004 are in solid shapes, and the samples analyzed in
2006/2007 are in open shapes. The chocolate bars analyzed in April of 2004 have relatively
similar ratios to the chocolate bars analyzed in 2007.
5.1.2.3 Different Product
There does not appear to be any simple relationship between the manufacturer or distributor of a particular chocolate product and its isotopic composition. Target is considered a distributor because they market chocolates from an unknown manufacturer. All of the major manufacturers whose chocolates were analyzed in this study were compared by plotting the 206Pb /204Pb vs. 207Pb /204
Pb (Figure 16), and no relationship between the same manufacturers was observed, with the scatter appearing random, well outside the typical one sigma analytical uncertainty of the mass spectrometer (also shown in Figure 16). It can be concluded, then, that the different
manufacturers are not the predominant cause for the varying lead isotope ratios in chocolate and that the observed Pb is not introduced during making of the confections.