Elevated blood pressure (BP) is one of the most prevalent cardiovascular risk factors1 and strongly associated with the occurrence of major cardiovascular events.2–5 In this con-text, BP-induced myocardial damage is one of the best stud-ied consequences of elevated BP, and by itself an important predictor of cardiovascular outcomes.6,7 The potential value of biomarkers to detect BP-induced left ventricular hyper-trophy has been described previously.8,9
Cardiac troponins (cTn) are released from myocardial cells in case of overt myocardial injury and can be easily quantified in this context.10 However, current cTn assays have a variable sensitivity to detect cTn levels in lower risk populations.11 For example, a prior population-based study among middle-aged individuals found detectable high-sensitivity (hs) cTnT levels in only 25% of the population.12
Despite this limitation, a significant association with left ventricular hypertrophy has been observed in this study, underscoring the great potential of cTn for this purpose.12 On the other hand, one study found that 82.6% of men and 67.0% of women had detectable cTnI levels in a middle-aged population, providing evidence that quantification of cTn levels is feasible in the majority of individuals.13
Although the clinical utility to detect low levels of cTn in healthy population samples is currently unknown, hs-cTn assays may nevertheless be very useful to improve our mechanistic understanding of cTn turnover and its associa-tions with cardiovascular risk factors. In the current study, we therefore aimed to elucidate the distribution of cTn lev-els in a young and healthy population using a state-of-the-art high-sensitivity cardiac tropononin (hs-cTnI) assay.11
Relationship Between High-Sensitivity Cardiac Troponin I
and Blood Pressure Among Young and Healthy Adults
Stefanie Aeschbacher,
1,2Tobias Schoen,
1,2Matthias Bossard,
1,2Stephanie van der Lely,
1,2Kathrin Glättli,
1,2John Todd,
3Joel Estis,
3Martin Risch,
4,5Christian Mueller,
1,2,6Lorenz Risch,
4,7,8and
David Conen
1,2BACKGROUND
The aim of this study was to evaluate the relationship of cardiac tro-ponin (cTn) levels with conventional and ambulatory blood pressure (BP) in young and healthy adults.
METHODS
We performed a population based cross-sectional analysis among 2,072 young and healthy adults aged 25–41 years free of cardiovascular disease and diabetes mellitus. cTnI was measured using a highly sensi-tive (hs) assay. The relationships of high sensitivity cardiac tropononin I (hs-cTnI) with office and 24-hour BP were assessed using multivariable regression analyses.
RESULTS
Median age was 37 years and 975 (47%) participants were male. hs-cTnI levels were detectable in 2,061 (99.5%) individuals. Median (interquartile range) hs-cTnI levels were 0.98 (0.71; 1.64) ng/L among men and 0.48 (0.33; 0.71) ng/L among women. Systolic BP, but not
diastolic BP, gradually increased across hs-cTnI quartiles (118, 120, 121, and 122 mm Hg for conventional BP; P = 0.0002; 122, 123, 124, and 124 mm Hg for 24-hour BP, P = 0.0001). In multivariable linear regres-sion analyses, the β estimates for systolic BP per 1-unit increase in log transformed hs-cTnI were 2.52 for conventional BP (P = 0.0001); 2.75 for 24-hour BP (P < 0.0001); 2.71 and 2.41 (P < 0.0001 and P = 0.0002) for day and nighttime BP, respectively. There was a significant relationship between hs-cTnI and the Sokolow–Lyon Index (odds ratio (95% confi-dence interval): 2.09 (1.37; 3.18), P < 0.001).
CONCLUSION
Using a hs assay, hs-cTnI was detectable in virtually all participants of a young and healthy population. hs-cTnI was independently associated with systolic BP and left ventricular hypertrophy.
Keywords: ambulatory blood pressure monitoring; blood pressure;
car-diac troponins; hypertension; population based. doi:10.1093/ajh/hpu226
Initially submitted July 24, 2014; date of first revision August 19, 2014; accepted for publication October 22, 2014; online publication November 25, 2014.
© American Journal of Hypertension, Ltd 2014. All rights reserved. For Permissions, please email: [email protected]
1Department of Medicine, University Hospital Basel, Basel, Switzerland; 2Cardiovascular Research Institute Basel, Department of Cardiology,
University Hospital Basel, Basel, Switzerland; 3Singulex Inc., Clinical
Research, Alameda, California; 4Labormedizinisches Zentrum Dr Risch,
Schaan, Principality of Liechtenstein; 5Division of Laboratory Medicine,
Kantonsspital Graubünden, Chur, Switzerland; 6Cardiology Division,
University Hospital Basel, Basel, Switzerland; 7Division of Clinical
Biochemistry, Medical University Innsbruck, Innsbruck, Austria; 8Private
University, Triesen, Florida. Correspondence: David Conen ([email protected]).
790 American Journal of Hypertension 28(6) June 2015 We then sought to assess the relationships of hs-cTnI with conventional and ambulatory BP in the same sample population.
METHODS Study participants
Starting in 2010, all inhabitants of the Principality of Liechtenstein aged 25 to 41 years were invited to partici-pate in the ongoing genetic and phenotypic determinants of BP and other cardiovascular risk factors (GAPP) study. Individuals with a body mass index >35 kg/m2, known car-diovascular disease, known sleep apnea syndrome, renal failure, current intake of antidiabetic drugs, or other severe illnesses were excluded. The detailed design and methodol-ogy of the GAPP cohort have been described previously.14 Of the 2,159 participants with available hs-cTnI measure-ments, 87 individuals (4.0%) with no or insufficient ambu-latory BP information as defined below were excluded, such that 2,072 participants remained in the current analyses. The study protocol was approved by the local ethics com-mittee, and informed written consent was obtained from each participant.
BP assessment
After at least 5 minutes of rest, three conventional BP meas-urements were obtained using a validated oscillometric device (Microlife BP3AG1, Microlife AG, Widnau, Switzerland). For this study, conventional BP was defined as the mean of the second and third BP measurement. Ambulatory 24-hour BP monitoring was performed using a validated automatic device (BR-102 plus, Schiller AG, Baar, Switzerland). BP was obtained every 15 minutes from 07.30 to 22.30 and every 30 minutes during nighttime. If participants had less than 80% of valid BP measurements, the BP recording was repeated whenever possible. Day and nighttime BP were defined according to individually completed diaries. Individuals with <10 valid daytime or <5 valid nighttime measurements were considered to have insufficient ambulatory BP information and were excluded from this study.
Assessment of high-sensitivity Troponin I and other biomarkers
A fasting venous blood sample was obtained from each participant and stored immediately after centrifugation at −80 °C. hs-cTnI was assayed from frozen EDTA plasma sam-ples using a single-molecule counting technology (Erenna Immunoassay System, Singulex, Alameda, CA) with a limit of detection of 0.04 ng/L,15 and intra-/inter-assay coefficients of variation of 6%/6% at a hs-cTnI concentration of 8.3 ng/L, and 8%/9% at a hs-cTnI concentration of 79.7 ng/L. Eleven individuals with undetectable hs-cTnI levels in our sample were assigned a hs-cTnI value of 0.04 ng/L.
The measurement of other biomarkers used in this analy-sis has been described in detail previously.14 Glomerular fil-tration rate was estimated using the formula of the chronic kidney disease epidemiology collaboration.16
Assessment of left ventricular hypertrophy
A standardized 12-lead resting electrocardiogram (ECG) was obtained in every participant using a vali-dated device (Schiller AG). Sokolow–Lyon Index (SLI) was calculated as the sum of the higher S-Wave in lead V1 or V2 and the higher R-Wave in lead V5 or V6. A SLI >3.5 mV was defined to indicate left ventricular hypertrophy.17
Assessment of other study variables
Information about personal, medical, lifestyle, and nutri-tional factors were evaluated using standardized question-naires. Smoking status was self-assessed as current, past, or never. Physical activity was evaluated with the validated individual physical activity questionnaire.18 Regular physical activity was defined as vigorous physical activity >180 min-utes per week. Weight and height was measured in a standard-ized manner by trained study nurses. Body mass index was calculated as body weight in kilogram divided by height in meters squared.
Statistical analysis
Baseline characteristics were stratified by sex-specific hs-cTnI quartiles. Distribution patterns for continuous variables were checked using skewness, kurtosis, and visual inspection of the histograms. Baseline character-istics of continuous variables were presented as mean ± SD or median (interquartile range), and compared using analysis of variance or Kruskal–Wallis tests, as appropriate. Categorical variables were compared using chi-square tests.
Multivariable linear regression models were constructed to compare the β-coefficients of various systolic and diastolic BP indices (conventional BP, 24-h BP, daytime BP, and night-time BP) across sex-specific quartiles of hs-cTnI. Because the observed associations were approximately linear, we per-formed additional analyses with hs-cTnI as a continuous vari-able as the predictor of interest. As the distribution of hs-cTnI levels was not normal, this variable was log-transformed for all continuous analyses. All analyses were adjusted for a pre-defined set of potential confounders including age, sex, body mass index, current smoking, high density lipoprotein cho-lesterol, low density lipoprotein chocho-lesterol, hemoglobin A1c, glomerular filtration rate, antihypertensive treatment, and physical activity.
Multivariable logistic regression analyses were performed to correlate sex-specific quartiles of hs-cTnI with a positive SLI (SLI >3.5 mV) as a marker of left ventricular hyper-trophy. In addition to adjusting these models for the same covariates indicated above, we also included plasma levels of N-Terminal B-type natriuretic peptide (NT-pro BNP) in these models.
Vigorous physical activity is a known determinant of left ventricular mass,19,20 and may therefore modify the relation-ship between BP and hs-cTnI. We therefore constructed addi-tional multivariable regression analyses stratified by physical
activity. Formal interaction tests between hs-cTnI and physi-cal activity were performed in the nonstratified models.
Linear trends were calculated across sex-specific quartiles of hs-cTnI. Categorical variables were entered in the multi-variable models using binary indicator multi-variables. All statis-tical analyses were performed using SAS version 9.3 (SAS Institute, Cary, NC). A P-value of <0.05 was prespecified to indicate statistical significance.
RESULTS
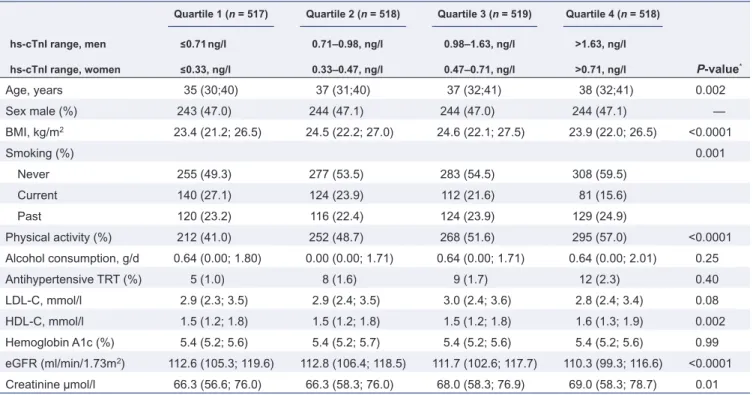
Baseline characteristics of the 2,072 participants according to sex-specific quartiles of hs-cTnI are presented in Table 1. hs-cTnI levels were detectable in 2,061 (99.5%) individuals. Median (interquartile range) hs-cTnI levels were 0.98 (0.71; 1.64) ng/L among men and 0.48 (0.33; 0.71) ng/L among women. Quartile-specific medians (interquartile range) were 0.56 (0.46; 0.63), 0.85 (0.78; 0.91), 1.25 (1.13; 1.41), and 2.58 (1.97; 4.28) for men; and 0.24 (0.18; 0.28), 0.40 (0.37; 0.43), 0.56 (0.51; 0.62), and 1.11 (0.84; 1.86) for women. The 99th percentile of hs-cTnI was 15.76 ng/L in men and 6.06 ng/L in women, respectively. Participants with higher hs-cTnI levels were less often current smokers (P < 0.0001) and more often physically active (P < 0.0001). High density lipoprotein cholesterol levels increased and glomerular fil-tration rate decreased across quartiles of hs-cTnI (P = 0.002 and P < 0.0001, respectively). There were nonlinear differ-ences across hs-cTnI quartiles for age (P = 0.002) and body mass index (P < 0.0001), as shown in Table 1.
BP and high-sensitivity cTnI
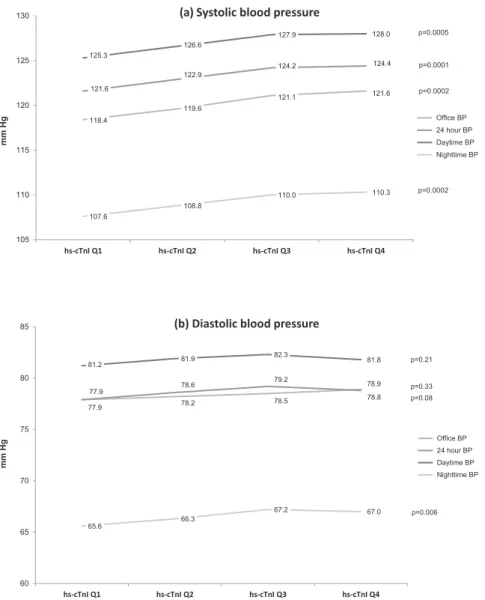
Systolic and diastolic BP levels across quartiles of hs-cTnI are shown in Figure 1. We observed a significant increase in mean systolic BP for all BP indices, whereas no relationship was seen between hs-cTnI and diastolic BP. Pearson correlation coefficients between systolic BP and log-transformed hs-cTnI were 0.34, 0.34, 0.34, and 0.28 (all P < 0.0001) for office, 24-h, daytime, and nighttime systolic BP, respectively.
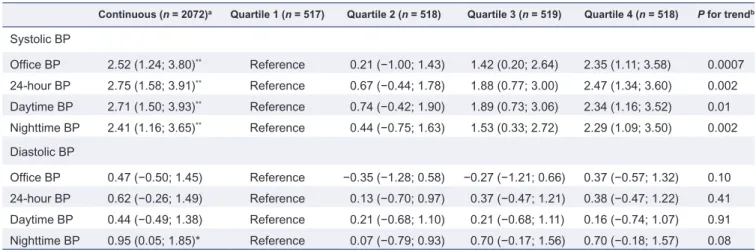
Multivariable linear regression analyses were consistent with a linear relationship between all systolic BP indices and hs-cTnI, as shown in Table 2. Compared to individuals in the lowest hs-cTnI quartile, those in the highest quartile had an increase in systolic BP of approximately 2 mm Hg after adjustment for other covariates. On a continuous scale, the β-regression coefficients (95% confidence intervals) for log-transformed hs-cTnI levels and systolic office, 24-h, day and nighttime BP were 2.52 (1.24; 3.80), P = 0.0001; 2.75 (1.58; 3.91), P < 0.0001; 2.71 (1.50; 3.93), P < 0.0001, and 2.41 (1.16; 3.65), P = 0.0002, respectively. Diastolic BP indices were not associated with hs-cTnI in any of these multivariable analy-ses (Table 2).
Analyses stratified by physical activity are shown in
Table 3. These analyses consistently showed on average stronger associations for the relationship between BP and hs-cTnI among physically less active participants, although the interaction P values were not statistically significant.
Table 1. Baseline characteristics according to sex-specific quartiles of high-sensitivity cardiac troponin I
Quartile 1 (n = 517) Quartile 2 (n = 518) Quartile 3 (n = 519) Quartile 4 (n = 518)
hs-cTnI range, men ≤0.71 ng/l 0.71–0.98, ng/l 0.98–1.63, ng/l >1.63, ng/l
P-value*
hs-cTnI range, women ≤0.33, ng/l 0.33–0.47, ng/l 0.47–0.71, ng/l >0.71, ng/l
Age, years 35 (30;40) 37 (31;40) 37 (32;41) 38 (32;41) 0.002 Sex male (%) 243 (47.0) 244 (47.1) 244 (47.0) 244 (47.1) — BMI, kg/m2 23.4 (21.2; 26.5) 24.5 (22.2; 27.0) 24.6 (22.1; 27.5) 23.9 (22.0; 26.5) <0.0001 Smoking (%) 0.001 Never 255 (49.3) 277 (53.5) 283 (54.5) 308 (59.5) Current 140 (27.1) 124 (23.9) 112 (21.6) 81 (15.6) Past 120 (23.2) 116 (22.4) 124 (23.9) 129 (24.9) Physical activity (%) 212 (41.0) 252 (48.7) 268 (51.6) 295 (57.0) <0.0001 Alcohol consumption, g/d 0.64 (0.00; 1.80) 0.00 (0.00; 1.71) 0.64 (0.00; 1.71) 0.64 (0.00; 2.01) 0.25 Antihypertensive TRT (%) 5 (1.0) 8 (1.6) 9 (1.7) 12 (2.3) 0.40 LDL-C, mmol/l 2.9 (2.3; 3.5) 2.9 (2.4; 3.5) 3.0 (2.4; 3.6) 2.8 (2.4; 3.4) 0.08 HDL-C, mmol/l 1.5 (1.2; 1.8) 1.5 (1.2; 1.8) 1.5 (1.2; 1.8) 1.6 (1.3; 1.9) 0.002 Hemoglobin A1c (%) 5.4 (5.2; 5.6) 5.4 (5.2; 5.7) 5.4 (5.2; 5.6) 5.4 (5.2; 5.6) 0.99 eGFR (ml/min/1.73m2) 112.6 (105.3; 119.6) 112.8 (106.4; 118.5) 111.7 (102.6; 117.7) 110.3 (99.3; 116.6) <0.0001 Creatinine µmol/l 66.3 (56.6; 76.0) 66.3 (58.3; 76.0) 68.0 (58.3; 76.9) 69.0 (58.3; 78.7) 0.01
Data are median (interquartile range) or number (percentage).
Abbreviations: BMI, body mass index; HDL-C, high density lipoprotein cholesterol; hs-cTnI, high sensitivity cardiac Troponin I; LDL-C, low density lipoprotein cholesterol; GFR, glomerular filtration rate; TRT, treatment.
792 American Journal of Hypertension 28(6) June 2015 Left ventricular hypertrophy and high-sensitivity cTnI
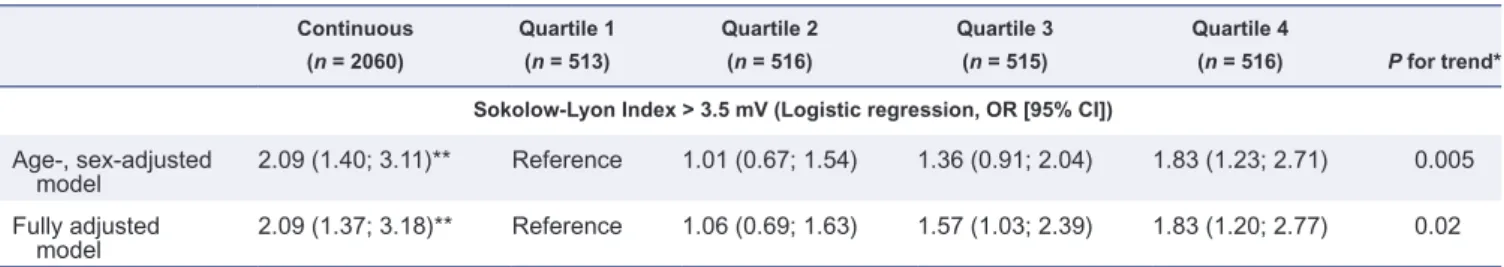
Left ventricular hypertrophy according to the SLI criteria was present among 267 (13.0 %) individuals. The prevalence of left ventricular hypertrophy across quartiles of hs-cTnI was 11.1, 11.1, 13.4, and 16.3% (P for trend = 0.04). Multivariable adjusted odds ratios (95% confidence intervals) across hs-cTnI quartiles were 1.00 (reference), 1.06 (0.69; 1.63), 1.57 (1.03; 2.39), and 1.83 (1.20; 2.77) (P for trend = 0.02), as shown in Table 4. Consistent results were observed in analy-ses stratified by physical activity. Accordingly, none of the P values for interaction were statistically significant (data not shown).
DISCUSSION
In this large population-based study of young and healthy adults without prior cardiovascular disease, we observed
several important and novel findings. First, using a new highly sensitive (hs) assay, we were able to detect hs-cTnI levels in virtually all participants. Only eleven of 2,072 (0.5%) individuals had undetectable hs-cTnI levels in our sample population. This prevalence of undetectable cTn lev-els is lower than in most contemporary hs-cTn assays,12–14 although a previous study has suggested that several other hs-cTnI assays probably have a similar detection rate of over 80%.11 These data indicate that using the appropriate assay, cTn can now be used as a truly quantitative, continuous parameter even in healthy, low risk populations.
Second, the 99th percentile of hs-cTnI was 15.76 ng/L in men and 6.06 ng/L in women, which is similar to another study using the same hs-cTnI assay.21 The 99th percen-tile is an important parameter in the current definition of myocardial infarction,22 and the skewed distribution in the current study using the most sensitive troponin assay sug-gests that this parameter will still be useful in the future.23
Figure 1. Mean (a) systolic and (b) diastolic BP levels by quartiles of high-sensitivity cardiac troponin I. Values represent mean BP values (in mm Hg)
across sex-specific quartiles of high-sensitivity cardiac troponin I. P values are based on analysis of variance (ANOVA). Abbreviations: BP, Blood pressure; hs-cTnI, high sensitivity cardiac troponin I; Q, Quartile.
However, further studies are needed to define the ideal cut-off, given that current hs-cTnI assays are not standardized and the characteristics of the populations studied differ.11,23
For this reason, it should be highlighted that the clinical significance of hs-cTnI levels above the 99th percentile of this low-risk population is currently unknown. Finally, the
Table 2. Multivariable linear regression analyses for the relationship between blood pressure and high-sensitivity cardiac troponin I
Continuous (n = 2072)a Quartile 1 (n = 517) Quartile 2 (n = 518) Quartile 3 (n = 519) Quartile 4 (n = 518) P for trendb
Systolic BP Office BP 2.52 (1.24; 3.80)** Reference 0.21 (−1.00; 1.43) 1.42 (0.20; 2.64) 2.35 (1.11; 3.58) 0.0007 24-hour BP 2.75 (1.58; 3.91)** Reference 0.67 (−0.44; 1.78) 1.88 (0.77; 3.00) 2.47 (1.34; 3.60) 0.002 Daytime BP 2.71 (1.50; 3.93)** Reference 0.74 (−0.42; 1.90) 1.89 (0.73; 3.06) 2.34 (1.16; 3.52) 0.01 Nighttime BP 2.41 (1.16; 3.65)** Reference 0.44 (−0.75; 1.63) 1.53 (0.33; 2.72) 2.29 (1.09; 3.50) 0.002 Diastolic BP Office BP 0.47 (−0.50; 1.45) Reference −0.35 (−1.28; 0.58) −0.27 (−1.21; 0.66) 0.37 (−0.57; 1.32) 0.10 24-hour BP 0.62 (−0.26; 1.49) Reference 0.13 (−0.70; 0.97) 0.37 (−0.47; 1.21) 0.38 (−0.47; 1.22) 0.41 Daytime BP 0.44 (−0.49; 1.38) Reference 0.21 (−0.68; 1.10) 0.21 (−0.68; 1.11) 0.16 (−0.74; 1.07) 0.91 Nighttime BP 0.95 (0.05; 1.85)* Reference 0.07 (−0.79; 0.93) 0.70 (−0.17; 1.56) 0.70 (−0.18; 1.57) 0.08 Data are β (95% confidence intervals). All coefficients are adjusted for sex, age, body mass index, current smoking, low density lipoprotein cholesterol, high density lipoprotein cholesterol, hemoglobin A1c, glomerular filtration rate, antihypertensive treatment, and physical activity.
aLog-transformed variable.
bP for trend across quartiles of high-sensitivity Troponin I.
Abbreviation: BP, blood pressure.
*P < 0.05; **P < 0.01.
Table 3. Multivariable linear regression analyses for the relationship between blood pressure and high-sensitivity cardiac troponin I stratified
by physical activity
Variable Physical activitya β (95% confidence intervals) P-value P for interaction
Systolic BP Office BP Vigorous 0.93 (−0.85; 2.70) 0.30 0.07 Usual 4.19 (2.34; 6.04) <0.0001 24-hour BP Vigorous 1.73 (0.12; 3.35) 0.04 0.20 Usual 3.79 (2.09; 5.48) <0.0001 Daytime BP Vigorous 1.64 (−0.04; 3.32) 0.06 0.18 Usual 3.85 (2.07; 5.63) <0.0001 Nighttime BP Vigorous 1.91 (0.17; 3.65) 0.03 0.90 Usual 2.79 (0.99; 4.59) 0.002 Diastolic BP Office BP Vigorous 0.38 (−1.76; 0.99) 0.58 0.13 Usual 1.39 (0.001; 2.78) 0.05 24-hour BP Vigorous −0.02 (−1.21; 1.17) 0.97 0.08 Usual 1.29 (0.002; 2.57) 0.05 Daytime BP Vigorous 0.21 (−1.48; 1.07) 0.75 0.08 Usual 1.15 (−0.22; 2.53) 0.10 Nighttime BP Vigorous 0.45 (−0.81; 1.71) 0.48 0.55 Usual 1.37 (0.07; 2.67) 0.04
Data are β (95% confidence intervals).
aVigorous physical activity was defined as vigorous activity > 180 minutes per week. All coefficients are adjusted for sex, age, body mass
index, current smoking, low density lipoprotein cholesterol, high density lipoprotein cholesterol, hemoglobin A1c, glomerular filtration rate, and antihypertensive treatment.
794 American Journal of Hypertension 28(6) June 2015 marked differences between men and women are also in-line with prior studies and should be taken into account in future definitions.11,21,24
Third, using hs-cTnI as a quantitative variable allowed us to detect a significant relationship between hs-cTnI and systolic BP, independent of whether we used conventional or 24-h ambulatory BP indices. The relationship between conventional systolic BP and hs-cTnI has previously been observed in an older population.25 We are not aware of large studies assessing the relationship between cTn and ambula-tory 24-h BP. It is noteworthy that hs-cTnI was also associ-ated with nighttime BP, suggesting that hs-cTnI levels reflect increased myocardial stress associated with an increased overall BP burden. In this context, it is very plausible that hs-cTnI was associated with systolic but not diastolic BP, given that systolic BP is a much more important determinant for cardiac afterload than diastolic BP. In addition, a recent study has found differential effects of systolic and diastolic BP on adverse cardiac outcomes, providing indirect clinical sup-port for our findings.26 However, it should also be noted that the clinical relevance of small absolute differences of hs-cTn levels within the normal range is currently unknown. Future studies are needed to assess the clinical role of low levels of hs-cTn and the usefulness of their changes over time.
Fourth, hs-cTnI levels were not only associated with systolic BP levels, but also with ECG-determined left ven-tricular hypertrophy. Individuals with hs-cTnI levels in the highest quartile had an odds ratio for left ventricular hypertrophy of 1.83 (95% confidence interval: 1.20, 2.77; P = 0.005) compared to the lowest quartile. This relation-ship was independent of systolic BP. Our data are in agree-ment with prior studies,12,27–29 and suggest that hs-cTnI may become an important tool to rule out left ventricular hyper-trophy.30 Future studies using imaging tools are needed to confirm this hypothesis. In addition, hs-cTnI quantified by the same assay has recently been associated with the occur-rence of cardiovascular outcomes in prospective studies, further underscoring its potential value in improving car-diovascular risk stratification.31,32
Based on findings of prior studies, we believe that the rela-tionships of hs-cTnI with systolic BP and left ventricular hyper-trophy may be explained by the increased amount of cTn in hypertrophic myocardial cells.33,34 Elevated hs-cTnI levels may
also represent subendocardial hypoperfusion or myocardial fibrosis, whose development is supported by high mechanical load.35,36 This hypothesis is supported by prior studies show-ing a higher risk of adverse outcomes among individuals with left ventricular hypertrophy on magnetic resonance imaging who also have elevated levels of cTnT and NT-proBNP.30,37 In our study, the relationship between hs-cTnI and BP seemed to be stronger among individuals with lower levels of physical activity than among those indicating vigorous physical activity, although the P value for interaction was not statistically signifi-cant. Our data therefore support the concept that hs-cTnI lev-els mainly reflect BP-induced myocardial hypertrophy among individuals with low to moderate physical activity, while among those with a high level of physical activity, it may be a marker of a physiologically induced increase in left ventricular mass, but not reflecting BP-induced damage.19,20 An alterna-tive explanation for the elevated hs-cTnI levels among those with vigorous physical activity may be an increased turnover and renewal of cardiomyocytes.38 Future studies are needed to elucidate in greater detail these relationships.
Strengths and limitations
Major strengths of this study include the population-based study design with a large number of well-characterized young and healthy adults enrolled, and the concomitant recording of both office and 24-h ambulatory BP. Moreover, cTn was measured with a very sensitive assay providing a detection rate of 99.5%. There are some potential limita-tions that should be taken into account in the interpretation of this study. First, we performed a cross-sectional analy-sis which does not allow any causal inference. Second, the great majority of enrolled individuals were white, and the generalizability of our results to other population groups is uncertain. However, white women had among the lowest cTn levels in a prior study,12 suggesting that the assay used should provide similar quantitative results in other ethnic groups as well. Third, although well-validated and specific, ECG-based measures of left ventricular hypertrophy lack sensitivity. We therefore expect even stronger associations in studies where left ventricular mass is measured by imaging. Fourth, hs-cTnI levels may have been influenced by physical activity prior to the blood draw. However, all blood samples were taken in the
Table 4. Multivariable regression analyses for the relationship between the Sokolow–Lyon Index and high-sensitivity cardiac troponin I
Continuous (n = 2060) Quartile 1 (n = 513) Quartile 2 (n = 516) Quartile 3 (n = 515) Quartile 4 (n = 516) P for trend*
Sokolow-Lyon Index > 3.5 mV (Logistic regression, OR [95% CI]) Age-, sex-adjusted
model 2.09 (1.40; 3.11)** Reference 1.01 (0.67; 1.54) 1.36 (0.91; 2.04) 1.83 (1.23; 2.71) 0.005
Fully adjusted
model 2.09 (1.37; 3.18)** Reference 1.06 (0.69; 1.63) 1.57 (1.03; 2.39) 1.83 (1.20; 2.77) 0.02
Fully adjusted model: sex, age, body mass index, current smoking, low density lipoprotein cholesterol, high density lipoprotein cholesterol, hemoglobin A1c, glomerular filtration rate, antihypertensive treatment, physical activity, and nt-pro brain natriuretic peptide. n = 12 with missing ECG data.
Abbreviations: OR, odds ratio; CI, confidence intervals.
*P for trend across quartiles of high-sensitivity cardiac Troponin I. **P < 0.001.
fasting state early in the morning, and study nurses instructed participants to avoid intense physical activity the day before study inclusion. Therefore, we believe that the influence of vigorous physical activity on hs-cTnI levels should be mini-mal. Fifth, our study does not provide any direct clinical implications. However, we believe that our findings improve the understanding of the physiological and pathological underpinnings of cTn levels, which will help to define the clinical role of modern hs-cTnI assays in the future.
CONCLUSION
Using a highly sensitive assay, cTnI levels were detectable in virtually all participants of a young and healthy popula-tion, thereby revealing a strong relationship of hs-cTnI with systolic BP. These tests may therefore be useful to directly quantify subclinical myocardial damage associated with elevated BP. Prospective studies are needed to verify these hypotheses.
ACKNOWLEDGMENTS
The GAPP work was supported by the Liechtenstein Government, the Swiss Heart Foundation, the Swiss Society of Hypertension, the University of Basel, the University Hospital Basel, the Hanela Foundation, Schiller AG, and Novartis. D.C. was supported by a grant of the Swiss National Science Foundation (PP00P3_133681). cTnI was assayed free of charge by Singulex, Alameda, CA.
DISCLOSURE
John Todd and Joel Estis are employees of Singulex. Dr Mueller has received research grants from Abbott, BRAHMS, Critical Diagnostics, Nanosphere, Roche, Siemens, and 8sense, as well as speaker honoraria from Abbott, BG Medicine, Brahms, Novartis, Roche, and Siemens.
REFERENCES
1. Kearney PM, Whelton M, Reynolds K, Muntner P, Whelton PK, He J. Global burden of hypertension: analysis of worldwide data. Lancet 2005; 365:217–223.
2. Conen D, Ridker PM, Buring JE, Glynn RJ. Risk of cardiovascular events among women with high normal blood pressure or blood pres-sure progression: prospective cohort study. BMJ 2007;335:432. 3. Levy D, Larson MG, Vasan RS, Kannel WB, Ho KK. The
progres-sion from hypertenprogres-sion to congestive heart failure. JAMA 1996; 275:1557–1562.
4. Lewington S, Clarke R, Qizilbash N, Peto R, Collins R. Prospective Studies Collaboration. Age-specific relevance of usual blood pressure to vascular mortality: a meta-analysis of individual data for one million adults in 61 prospective studies. Lancet 2002; 360:1903–1913. 5. Conen D, Tedrow UB, Koplan BA, Glynn RJ, Buring JE, Albert CM.
Influence of systolic and diastolic blood pressure on the risk of incident atrial fibrillation in women. Circulation 2009; 119:2146–2152. 6. Verdecchia P, Carini G, Circo A, Dovellini E, Giovannini E, Lombardo
M, Solinas P, Gorini M, Maggioni AP; MAVI (MAssa Ventricolare sinistra nell’Ipertensione) Study Group. Left ventricular mass and
cardiovascular morbidity in essential hypertension: the MAVI study. J
Am Coll Cardiol 2001; 38:1829–1835.
7. Bombelli M, Facchetti R, Carugo S, Madotto F, Arenare F, Quarti-Trevano F, Capra A, Giannattasio C, Dell’Oro R, Grassi G, Sega R, Mancia G. Left ventricular hypertrophy increases cardiovascular risk independently of in-office and out-of-office blood pressure values. J
Hypertens 2009; 27:2458–2464.
8. Conen D, Zeller A, Pfisterer M, Martina B. Usefulness of B-type natriu-retic peptide and C-reactive protein in predicting the presence or absence of left ventricular hypertrophy in patients with systemic hyper-tension. Am J Cardiol 2006; 97:249–252.
9. Courand PY, Gaudebout N, Mouly-Bertin C, Thomson V, Fauvel JP, Bricca G, Lantelme P. Biological, electrical and echocardiographic indi-ces versus cardiac magnetic resonance imaging in diagnosing left ven-tricular hypertrophy. Hypertens Res 2014; 37:444–451.
10. Adams JE III, Bodor GS, Dávila-Román VG, Delmez JA, Apple FS, Ladenson JH, Jaffe AS. Cardiac troponin I. A marker with high speci-ficity for cardiac injury. Circulation 1993; 88:101–106.
11. Apple FS, Ler R, Murakami MM. Determination of 19 cardiac troponin I and T assay 99th percentile values from a common presumably healthy
population. Clin Chem 2012; 58:1574–1581.
12. de Lemos JA, Drazner MH, Omland T, Ayers CR, Khera A, Rohatgi A, Hashim I, Berry JD, Das SR, Morrow DA, McGuire DK. Association of troponin T detected with a highly sensitive assay and cardiac structure and mortality risk in the general population. JAMA 2010; 304:2503–2512.
13. Zeller T, Tunstall-Pedoe H, Saarela O, Ojeda F, Schnabel RB, Tuovinen T, Woodward M, Struthers A, Hughes M, Kee F, Salomaa V, Kuulasmaa K, Blankenberg S; MORGAM Investigators. High population preva-lence of cardiac troponin I measured by a high-sensitivity assay and cardiovascular risk estimation: the MORGAM Biomarker Project Scottish Cohort. Eur Heart J 2014; 35:271–281.
14. Conen D, Schön T, Aeschbacher S, Paré G, Frehner W, Risch M, Risch L. Genetic and phenotypic determinants of blood pressure and other cardiovascular risk factors (GAPP). Swiss Med Wkly 2013; 143:w13728. 15. Todd J, Freese B, Lu A, Held D, Morey J, Livingston R, Goix P.
Ultrasensitive flow-based immunoassays using single-molecule count-ing. Clin Chem 2007; 53:1990–1995.
16. Levey AS, Stevens LA, Schmid CH, Zhang YL, Castro AF III, Feldman HI, Kusek JW, Eggers P, Van Lente F, Greene T, Coresh J; CKD-EPI (Chronic Kidney Disease Epidemiology Collaboration). A new equa-tion to estimate glomerular filtraequa-tion rate. Ann Intern Med 2009; 150:604–612.
17. SOKOLOW M, LYON TP. The ventricular complex in left ventricular hypertrophy as obtained by unipolar precordial and limb leads. Am
Heart J 1949; 37:161–186.
18. Craig CL, Marshall AL, Sjöström M, Bauman AE, Booth ML, Ainsworth BE, Pratt M, Ekelund U, Yngve A, Sallis JF, Oja P. International physi-cal activity questionnaire: 12-country reliability and validity. Med Sci
Sports Exerc 2003; 35:1381–1395.
19. Batterham AM, George KP, Birch KM, Pennell DJ, Myerson SG. Growth of left ventricular mass with military basic training in army recruits.
Med Sci Sports Exerc 2011; 43:1295–1300.
20. Savage DD, Levy D, Dannenberg AL, Garrison RJ, Castelli WP. Association of echocardiographic left ventricular mass with body size, blood pressure and physical activity (the Framingham Study). Am J
Cardiol 1990; 65:371–376.
21. Apple FS, Simpson PA, Murakami MM. Defining the serum 99th
per-centile in a normal reference population measured by a high-sensitivity cardiac troponin I assay. Clin Biochem 2010; 43:1034–1036.
22. Thygesen K, Alpert JS, White HD, Jaffe AS, Katus HA, Apple FS, Lindahl B, Morrow DA, Chaitman BR, Clemmensen PM, Johanson P, Hod H, Underwood R, Bax JJ, Bonow JJ, Pinto F, Gibbons RJ, Fox KA, Atar D, Newby LK, Galvani M, Hamm CW, Uretsky BF, Steg PG, Wijns W, Bassand JP, Menasche P, Ravkilde J, Ohman EM, Antman EM, Wallentin LC, Armstrong PW, Simoons ML, Januzzi JL, Nieminen MS, Gheorghiade M, Filippatos G, Luepker RV, Fortmann SP, Rosamond WD, Levy D, Wood D, Smith SC, Hu D, Lopez-Sendon JL, Robertson RM, Weaver D, Tendera M, Bove AA, Parkhomenko AN, Vasilieva EJ, Mendis S, Bax JJ, Baumgartner H, Ceconi C, Dean V, Deaton C, Fagard R, Funck-Brentano C, Hasdai D, Hoes A, Kirchhof P, Knuuti J, Kolh P, McDonagh T, Moulin C, Popescu BA, Reiner Z, Sechtem U, Sirnes PA, Tendera M, Torbicki A, Vahanian A, Windecker S, Morais J, Aguiar C,
796 American Journal of Hypertension 28(6) June 2015
Almahmeed W, Arnar DO, Barili F, Bloch KD, Bolger AF, Botker HE, Bozkurt B, Bugiardini R, Cannon C, de Lemos J, Eberli FR, Escobar E, Hlatky M, James S, Kern KB, Moliterno DJ, Mueller C, Neskovic AN, Pieske BM, Schulman SP, Storey RF, Taubert KA, Vranckx P, Wagner DR; Joint ESC/ACCF/AHA/WHF Task Force for Universal Definition of Myocardial Infarction; Authors/Task Force Members Chairpersons; Biomarker Subcommittee; ECG Subcommittee; Imaging Subcommittee; Classification Subcommittee; Intervention Subcommittee; Trials & Registries Subcommittee; Trials & Registries Subcommittee; Trials & Registries Subcommittee; Trials & Registries Subcommittee; ESC Committee for Practice Guidelines (CPG); Document Reviewers. Third universal definition of myocardial infarction. J Am Coll Cardiol 2012; 60:1581–1598.
23. Hickman PE, Lindahl B, Potter JM, Venge P, Koerbin G, Eggers KM. Is it time to do away with the 99th percentile for cardiac troponin in the
diagnosis of acute coronary syndrome and the assessment of cardiac risk? Clin Chem 2014; 60:734–736.
24. Gore MO, Seliger SL, Defilippi CR, Nambi V, Christenson RH, Hashim IA, Hoogeveen RC, Ayers CR, Sun W, McGuire DK, Ballantyne CM, de Lemos JA. Age- and sex-dependent upper reference limits for the high-sensitivity cardiac troponin T assay. J Am Coll Cardiol 2014; 63:1441–1448.
25. McKie PM, Heublein DM, Scott CG, Gantzer ML, Mehta RA, Rodeheffer RJ, Redfield MM, Burnett JC Jr, Jaffe AS. Defining high-sen-sitivity cardiac troponin concentrations in the community. Clin Chem 2013; 59:1099–1107.
26. Rapsomaniki E, Timmis A, George J, Pujades-Rodriguez M, Shah AD, Denaxas S, White IR, Caulfield MJ, Deanfield JE, Smeeth L, Williams B, Hingorani A, Hemingway H. Blood pressure and incidence of twelve cardiovascular diseases: lifetime risks, healthy life-years lost, and age-specific associations in 1·25 million people. Lancet 2014; 383:1899–1911.
27. Wallace TW, Abdullah SM, Drazner MH, Das SR, Khera A, McGuire DK, Wians F, Sabatine MS, Morrow DA, de Lemos JA. Prevalence and determinants of troponin T elevation in the general population.
Circulation 2006; 113:1958–1965.
28. Eggers KM, Lind L, Ahlström H, Bjerner T, Ebeling Barbier C, Larsson A, Venge P, Lindahl B. Prevalence and pathophysiological mechanisms of elevated cardiac troponin I levels in a population-based sample of elderly subjects. Eur Heart J 2008; 29:2252–2258.
29. Masson S, Latini R, Mureddu GF, Agabiti N, Miceli M, Cesaroni G, Forastiere F, Wienhues-Thelen UH, Block D, Zaugg C, Vago T, Boccanelli A; PREDICTOR study. High-sensitivity cardiac troponin T for detection of subtle abnormalities of cardiac phenotype in a general population of elderly individuals. J Intern Med 2013; 273:306–317. 30. Nadir MA, Rekhraj S, Wei L, Lim TK, Davidson J, MacDonald TM,
Lang CC, Dow E, Struthers AD. Improving the primary prevention of cardiovascular events by using biomarkers to identify individuals with silent heart disease. J Am Coll Cardiol 2012; 60:960–968.
31. Wang TJ, Wollert KC, Larson MG, Coglianese E, McCabe EL, Cheng S, Ho JE, Fradley MG, Ghorbani A, Xanthakis V, Kempf T, Benjamin EJ, Levy D, Vasan RS, Januzzi JL. Prognostic utility of novel biomarkers of cardiovascu-lar stress: the Framingham Heart Study. Circulation 2012; 126:1596–1604. 32. Apple FS, Steffen LM, Pearce LA, Murakami MM, Luepker RV.
Increased cardiac troponin I as measured by a high-sensitivity assay is associated with high odds of cardiovascular death: the Minnesota Heart Survey. Clin Chem 2012; 58:930–935.
33. Azakie A, Fineman JR, He Y. Myocardial transcription factors are modulated during pathologic cardiac hypertrophy in vivo. J Thorac
Cardiovasc Surg 2006; 132:1262–1271.
34. Fernández-Jiménez R, López-Romero P, Suárez-Barrientos A, García-Rubira JC, Fernández-Ortiz A, Fuster V, Macaya C, Ibañez B. Troponin release overestimates infarct size in presence of left ventricular hyper-trophy. J Am Coll Cardiol 2012; 60:640–641.
35. Takashio S, Yamamuro M, Uemura T, Utsunomiya D, Morita K, Izumiya Y, Sugiyama S, Kojima S, Yamamoto E, Tsujita K, Tanaka T, Tayama S, Kaikita K, Hokimoto S, Yasuda O, Yamashita Y, Ogawa H. Correlation between extent of myocardial fibrosis assessed by cardiac magnetic resonance and cardiac troponin T release in patients with nonischemic heart failure. Am J Cardiol 2014; 113:1697–1704. 36. Bishop JE, Lindahl G. Regulation of cardiovascular collagen synthesis
by mechanical load. Cardiovasc Res 1999; 42:27–44.
37. Neeland IJ, Drazner MH, Berry JD, Ayers CR, deFilippi C, Seliger SL, Nambi V, McGuire DK, Omland T, de Lemos JA. Biomarkers of chronic cardiac injury and hemodynamic stress identify a malignant phenotype of left ventricular hypertrophy in the general population. J Am Coll
Cardiol 2013; 61:187–195.
38. Bergmann O, Bhardwaj RD, Bernard S, Zdunek S, Barnabé-Heider F, Walsh S, Zupicich J, Alkass K, Buchholz BA, Druid H, Jovinge S, Frisén J. Evidence for cardiomyocyte renewal in humans. Science 2009; 324:98–102.