FEATURE ARTICLE
Direct Evidence for Attention-Dependent In
fluences of the Frontal Eye-Fields
on Feature-Responsive Visual Cortex
Klaartje Heinen
1,2, Eva Feredoes
1,4, Nikolaus Weiskopf
2, Christian C. Ruff
2,3and Jon Driver
1,21
Institute of Cognitive Neuroscience,
2Wellcome Trust Centre for Neuroimaging, University College London, London WC1N 3BG,
UK,
3Laboratory for Social and Neural System Research (SNS-Lab), University of Zurich, Zurich CH-8006, Switzerland,
4School of
Psychology & Clinical Language Sciences, University of Reading, Reading RG6 7BE, UK
Address correspondence to Dr Klaartje Heinen, Email: [email protected]
Voluntary selective attention can prioritize different features in a visual
scene. The frontal eye-
fields (FEF) are one potential source of such
feature-speci
fic top-down signals, but causal evidence for influences
on visual cortex (as was shown for
“spatial” attention) has remained
elusive. Here, we show that transcranial magnetic stimulation (TMS)
applied to right FEF increased the blood oxygen level
–dependent
(BOLD) signals in visual areas processing
“target feature” but not in
“distracter feature”–processing regions. TMS-induced BOLD signals
in-crease in motion-responsive visual cortex (MT+) when motion was
at-tended in a display with moving dots superimposed on face stimuli, but
in face-responsive fusiform area (FFA) when faces were attended to.
These TMS effects on BOLD signal in both regions were negatively
related to performance (on the motion task), supporting the behavioral
relevance of this pathway. Our
findings provide new causal evidence
for the human FEF in the control of nonspatial
“feature”-based
atten-tion, mediated by dynamic in
fluences on feature-specific visual cortex
that vary with the currently attended property.
Keywords: concurrent TMS-fMRI, feature attention, frontal eye-
fields,
top-down control
Introduction
Causal (i.e., interventional) evidence for top-down modulation
of visual cortex by frontal eye-
fields (FEF) has started to emerge
from monkey studies (
Moore and Fallah 2004
;
Ekstrom et al.
2009
). Recent human studies have analogously revealed causal
in
fluences of FEF on visual cortex, by combining transcranial
magnetic stimulation (TMS) with concurrent fMRI (
Ruff et al.
2006
;
Blankenburg et al. 2010
) or with concurrent
electroence-phalography (EEG) (
Taylor et al. 2007
;
Morishima et al. 2009
).
Morishima et al. (2009)
tested speci
fically the role of human
FEF in the control of (nonspatial)
“feature-based” attention. By
applying TMS over a site close to right FEF, the authors
demon-strated that, subsequent to a single TMS pulse, evoked
poten-tials at posterior electrodes differed depending on whether the
participants attended faces or moving dot stimuli. The high
temporal resolution of EEG allowed demonstration of
differen-tial attention-effects on feature-speci
fic posterior EEG
com-ponents following a TMS pulse within 20
–40 ms, suggesting a
role for right FEF as an origin for top-down signals affecting
processing in posterior regions. However, the exact neural
origin of the EEG signals affected by TMS remains less clear
due to the technique
’s limited spatial resolution. Also, it did not
permit a distinction between FEF in
fluences on target and
dis-tracter representations. Finally, it was not considered whether
right FEF acts alone or in conjunction with left FEF.
To test whether and how signals are propagated from right
FEF to distinct feature-processing areas of the visual cortex (and
to left FEF) during feature attention, we combined right FEF
TMS concurrently with fMRI, while participants attended to
motion or faces (or passively viewed the stimuli) in a variant of
the task previously used with TMS-EEG (
Morishima et al. 2009
).
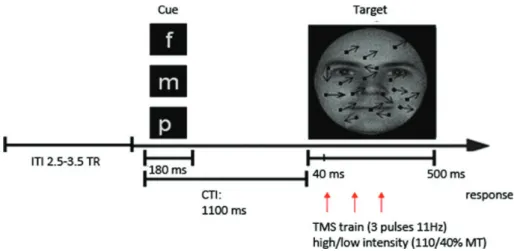
Participants were cued to report either the gender of a face or
the direction of a moving
field of dots that were always
superim-posed over the face stimulus. We also included a third condition
requiring passive viewing of this display, against which to
con-trast the attention conditions. TMS was applied in a train of 3
pulses starting 40 ms from the onset of the face + motion
display, either with high (neurally effective) or low (ineffective,
i.e., control) intensity during all 3 conditions (see Fig.
1
). The
experiment thus comprised 6 conditions in a 3 × 2 factorial
design, however, for simplicity of exposition, the dependent
variable referred to in the rest of the text is the difference
between the 2 TMS intensities (referred to as
“TMS effect”).
Materials and Methods
ParticipantsSixteen healthy participants (7 females, age range 19–36 years) were all right handed with normal or corrected visual acuity. Following screening for any contraindications to MRI and TMS, all provided in-formed consent in accord with local ethics clearance.
Stimuli and Procedure
Participants undertook a feature-based visual attention task in the scanner (see Fig.1), adapted fromMorishima et al. (2009). A letter cue appeared for 180 ms on each trial 1100 ms prior to the target display (500 ms) instructing the participant to attend to either to the gender of a face (F) and to make a gender judgment (male/female) or to attend to afield of moving dots (M) and to make a judgment on the motion direc-tion (leftward or rightward diagonal), with both types of stimuli super-imposed for all conditions (see Fig.1). In a third neutral condition (cued by the letter“P’), participants were instructed to passively view the same superimposed displays. Participants responded by pressing 1 of 2 keys on an MR-compatible button box or pressed a third key immediately following stimulus offset for the passive condition. Fix-ation had to be maintained throughout the trial and was monitored by infrared eye tracking (see below).
Seventy-two gray-scale face stimuli (36 males) were drawn from a face database (FaceGen 3.1; seeOosterhof and Todorov 2008). Face stimuli were cropped to a round shape, blurred (radius 15 Adobe Photoshop [CS4] blur tool) and hair was removed. Motion stimuli were generated such that 750 target dots were moving with a speed of 12°/s diagonally across the screen, either in leftward or upper-rightward direction (mean angle of ±45° [±15°] to vertical plane). © The Author 2013. Published by Oxford University Press.
This is an Open Access article distributed under the terms of the Creative Commons Attribution Non-Commercial License (http://creativecommons.org/licenses/by-nc/3.0/), which Cerebral Cortex November 2014;24:2815–2821
doi:10.1093/cercor/bht157
Randomly moving dots (190) were added to introduce 20% noise in the motion direction signal. The total display extended 6° of visual angle and was centered on a black background (∼30° × ∼22° of visual angle). A short train of TMS (3 pulses at 11 Hz) was delivered on each trial, starting 40 ms after target onset. Pulses were given on each trial either at high intensity (110% of individual resting motor threshold [RMT], see below) or at a much lower intensity (40% RMT), with a 50% prob-ability of occurrence. The high-intensity TMS was expected to be neurally effective whereas the low TMS should have no impact on neural processing but would control for nonspecific TMS effects (such as the acoustic“click” and tactile skin sensation accompanying a TMS pulse).
Each scanning session was comprised of 4 runs with 72 trials each (∼14 min per run). Task presentation, TMS triggering, intensity regu-lation, and relay settings were controlled using the Cogent toolbox (http://www.vislab.ucl.ac.uk/cogent_2000.php).
TMS
Individual RMT were obtained in a separate session prior to scanning, via stimulation over the right M1“hotspot” for inducing a visible twitch
of the first dorsal interosseus muscle in 5 of 10 trials (mean RMT: 72 ± 8% maximal output).
Scalp coordinates for the stimulation sites were first located outside the scanner via the Brainsight Frameless stereotaxic system and software package (Rogue Research, Montreal, Canada), using the native space of each participant’s own T1-weighted anatomical MR image. The target FEF site was identified in the right hemisphere based on anatomical landmarks in the posterior middle frontal gyrus, immediately ventral to the junction of superior frontal sulcus and ascending limb of precentral sulcus as described in earlier work from our laboratory (Ruff et al. 2006). The selected FEF site, after normalizing to MNI space, corresponded to mean XYZ coordinates of 31, 1, 58 (±2, 2, 1 SEM). See Figure2a for display of a 10-mm sphere centered at these mean MNI coordinates; see also Supplemen-tary Figure 1 for sites marked on each individual’s native anatomical scan.
Interleaved TMS-fMRI
Functional images were acquired on a 1.5 T MR system (Siemens Sonata, Erlangen, Germany), with a single channel receive head array. Figure 1. Schematic example of a single trial. Participants were instructed either to attend the gender of a face (as indicated by“f” cue) or the motion direction (“m” cue) in a field of dots (containing 20% random motion) or passively view the display (“p” cue), with both types of stimuli superimposed on displays that were visually equivalent across all conditions. Short bursts of transcranial magnetic stimulation (TMS) (3 pulses at 11 Hz at either 40% or 110% of RMT) were applied over right FEF, commencing 40 ms following target display onset. ITI, intertrial interval (2.5–3.5 volume repetitions [TR] or 8910 ± 1485 ms). CTI, cue-target interval. The TMS parameters were selected based on other recent TMS-fMRI studies (Feredoes et al. 2011;Heinen et al. 2011) and TMS safety guidelines (Rossi et al. 2009).
Figure 2. TMS effects on BOLD signal in the stimulated right FEF and the left FEF ROI, depend on active attention. (a) The brain image depicts the mean location, averaged across participants, of 10 mm spheres (shown in red) used as ROIs for the targeted right FEF, and for the left FEF, projected onto a MNI normalized brain (mean MNI coordinates right FEF: 31, 1, 58; mean MNI coordinates left FEF:−31 −3 57). (b) The bars display the TMS-induced difference (high minus low intensity) in BOLD signal extracted from the right FEF ROI for all 3 tasks conditions. TMS affected the BOLD signal for the motion and face tasks, but not for the passive viewing task (see main text). Error bars show ±SEM, and asterisks indicate significant (P < 0.05) differences in post hoc paired t-tests. See Supplementary Figure 2a for BOLD signals for all 6 conditions separately. (c) A similar pattern to right FEF-TMS effects on BOLD activity was found in the left FEF ROI (see also Supplementary Fig. 2b).
T2*-weighted echo planar image (EPI) volumes were acquired every 2.97 s covering the whole brain (TR = 90 ms, TE = 42 ms, 64 × 96 matrix, 33 axial slices, 3 × 3 × 2.5 mm, slice distance of 50%). For details regarding the custom MR sequence to account for artifacts due to presence of the TMS coil, seeRuff et al. (2006);Bestmann et al. (2008);Heinen et al. (2011). A field map scan (double-echo FLASH (gradient recalled echo) sequence with TE1 = 10 ms, TE2 = 12.46 ms; 3 × 3 × 2-mm resolution with 1-mm gap) was also acquired.
In the scanner, the TMS coil was positioned over the marked location with the cable oriented 45° from the vertical midline in a pos-teromedial direction. A Magstim Super Rapid2stimulator was used to generate TMS pulses (3 at 11 Hz), together with an MR-compatible, nonferrousfigure-of-eight coil (70 mm) (Magstim, Whitland, UK). TMS pulses were always given atfixed time points within the acquisition of subsequent MR slices, thus resulting infixed interpulse intervals of 90 ms (corresponding to 11 Hz). For further details of the concurrent TMS-fMRI set-up, see also (Bestmann et al. 2008;Heinen et al. 2011) and for details on the relay-based leakage current prevention solution seeWeiskopf et al. (2009).
Eye position was monitored with an ASL 504 Remote Infrared Eye-tracker (60 Hz; Applied Science Laboratories). Online inspection con-firmed good central fixation and post hoc analysis concon-firmed the occurrence of saccades >1° on only a small proportion of trials (<2%). No significant differences between conditions were observed (F5,11= 0.09, P > 0.7) and no trials were excluded. However, recorded eye position coordinates were added as regressors to the general linear model to account for and remove any possible small biases associated with eye gaze direction (see below).
Inverse Efficiency (IE) Score Calculation
Reaction times (RT) and accuracy were measured and then combined to yield IE scores (Townsend and Ashby 1982) as mean reaction time divided by proportion correct, thereby including speed and accuracy in one measure (but see Supplementary Fig. 2 for measures of RT and accuracy separately). Three subjects were excluded from behavioral analyses, 1 due to a faulty button response box and the other 2 due to near-chance performance on the motion task.
Data Analysis Functional MRI Data
Analysis of imaging data was undertaken using SPM5 (http://www.fil. ion.ucl.ac.uk/spm/) and Marsbar (http://marsbar.sourceforge.net/). The fMRI data were corrected for any possible TMS artifacts (see also:
Ruff et al. 2006;Bestmann et al. 2008;Weiskopf et al. 2009;Heinen et al. 2011) and high-passfiltered (128 s cut-off).
All volumes were realigned to the sixth volume (first 5 were dis-carded), geometrically unwarped using the acquired field maps, spatially normalized to Montreal Neurological Institute (MNI) anatom-ical standard space and spatially smoothed (8 mm). BOLD responses were modeled by convolution with the canonical hemodynamic response function (HRF) and its temporal derivative, using a General Linear Model, including regressors for each of the 6 experimental con-ditions. In addition, we included 6 head motion measures (translation variables x, y, and z and rotational variables pitch, roll, and yaw) and recorded eye-coordinates (x and y) as regressors of no interest (coordi-nate value averaged across scan).
Regions of Interest
Thefirst regions of interest (ROIs) was targeted right FEF. A 10-mm sphere was placed at the site of each individual’s native space TMS target and masked with a contrast for main task effects (P < 0.001 uncorrected). Left FEF ROI spheres were defined based on the same individual ana-tomical landmarks as applied to right FEF (but now in the left hemi-sphere) and again masked for main task effects. Note that this ROI was thus defined independent of any empirically measured impact of TMS. To identify candidate motion-responsive regions (MT+ complex), motion-cued trials were contrasted against face-cued trials regardless of TMS intensity at group level (thresholded at P < 0.05 uncorrected). The resulting activation maps were then inclusively masked by an MNI space anatomical map for MT+ (taken from MarsBar: http://marsbar. sourceforge.net/). The location for left and right MT+ is shown in Figure3a in the main text. Because the location and extent of the “fusi-form face area” (FFA) (Kanwisher and Yovel 2006;Meng et al. 2012) can vary considerably across individuals, a participant-by-participant ap-proach was undertaken for defining this region. For each participant,
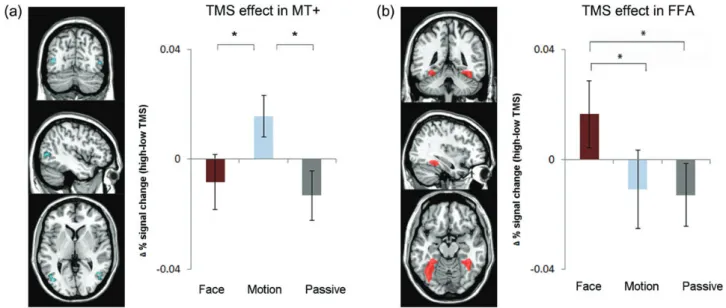
Figure 3. Remote effects of right FEF TMS on BOLD signal for MT+ and FFA are specific to the attended feature. (a) The left panel shows the group ROI for MT+ (centered on MNI coordinates−45, −70, 4 for left hemisphere and 46, −61, 2 for right) defined jointly by the Motion > Face task contrast and anatomical constraints (see Materials and Methods section). The plot to the right reveals significant TMS effects (high minus low TMS intensity) in MT+ (pooled across hemispheres) for attend-motion but not for attend-face or passive viewing conditions. Error bars are ±SEM and asterisks indicate significant (P < 0.05) differences in pairwise t-tests. See Supplementary Figure 2c for BOLD signal for all 6 conditions separately. (b) The left panel displays a compound image combining all individual FFA ROIs per participant (centered on MNI coordinates of −35 −54 −14 for left hemisphere, 36−43 −17 for right) as defined by the Face > Motion contrast for each participant individually together with anatomical constraints (see Materials and Methods section). TMS effects (high minus low intensity) were observed in FFA (averaged across right and left hemispheres) for the attend-face condition, but not for attend-motion or passive viewing conditions. See Supplementary Figure 2d for BOLD signal for all 6 conditions separately.
face-cued trials were contrasted against motion-cued trials. Responsive voxels (P < 0.05, uncorrected) were inclusively masked per individual by an anatomical fusiform ROI in MNI space (taken from MarsBar and adjusted, such that it comprised the posterior two-third of the fusiform gyrus). In this way, we were able to identify left and/or right FFA in each participant (15 of 16 for left hemisphere and 12 of 16 for right hemi-sphere). Compound images combining the ROIs of all participants for left and right FFA are displayed in Figure3c for illustrative purposes.
The mean percent signal change in each condition from the main experiment was then extracted, using MarsBar, for each ROI, in the fol-lowing way: for each participant, parameter estimates were scaled to reflect percent signal change relative to the voxel baseline and were averaged across all voxels within the ROIs, and then averaged across trial type.
Results
TMS-Dependent BOLD Effects in Right and Left FEF
We
first tested for effects of TMS on BOLD signals in the
stimu-lated
right
FEF
and
in
the
left
FEF
by
means
of
region-of-interest (ROI) analyses (see Fig.
2
a for spheres
cen-tered around the mean ROI coordinates averaged across
indi-viduals and Materials and Methods section for applied
method). We found positive TMS effects on BOLD signals in
the right FEF and left FEF ROI in both active attention
con-ditions, but not for the passive viewing condition (Fig.
2
b),
leading to a task-by-TMS interaction (right FEF: F2,14
= 3.6,
P < 0.05; pairwise contrasts: face vs. passive T
(15)= 2.4,
P < 0.05, motion vs. passive T(15)
= 3.0, P < 0.05; left FEF:
F
2,14= 6.0, P < 0.05; pairwise contrasts: face vs. passive
T(15)
= 2.5, P < 0.05, motion vs. passive T(15)
= 2.8, P < 0.05; see
Fig.
2
b,c and Supplementary Fig. S2a,b). TMS thus affected
local BOLD signals underneath the TMS coil and in
contralat-eral left FEF in a way that depended on attentional context.
TMS-Dependent BOLD Effects in Feature-Selective
Visual Cortex
Motion-Responsive MT+
In each participant, we
first identified visual areas sensitive to
motion in the left and the right hemisphere and then extracted
BOLD signal from these areas for each task condition (see
Materials and Methods section). Figure
3
a, left panel, shows
the MT+ ROIs at a group level. TMS effects on BOLD signal for
left and right MT+ did not differ signi
ficantly (T(15)
= 1.4,
P > 0.2), and were therefore pooled. TMS effects on MT+
BOLD signal are shown in Figure
3
a (right panel) and
Sup-plementary Figure 2c. Unlike FEF (cf. Fig.
2
), such BOLD
signal changes in MT+ increased only when participants were
instructed to make a judgment on the direction of moving dots.
In contrast, there was no signi
ficant effect of TMS on MT+
activity when participants were either attending to faces or
pas-sively viewing the stimuli, leading to a signi
ficant task-by-TMS
interaction (F2,14
= 4.0, P < 0.05; pairwise contrasts: motion vs.
face T(15)
= 2.1, motion vs. passive T(15)
= 3.1, P < 0.05).
Face-Responsive FFA
FFA ROIs were de
fined for each participant separately by
con-trasting attend-face trials with attend-motion trials (with
additional anatomical constraints; see Materials and Methods
section). Figure
3
b (left panel) shows the compound image
combining all individual FFA ROIs. The results for TMS effects
on BOLD in left and right FFA did not differ signi
ficantly
(T(10)
= 0.28, P > 0.7) and were again pooled. TMS enhanced
FFA BOLD now only during the condition in which faces
were attended, with no such TMS effects observed for the
other 2 conditions (task × TMS interaction (F
2,14= 3.3, P < 0.05;
pairwise contrasts: face vs. motion T(15)
= 2.2 face vs. passive
T
(15)= 2.6, P < 0.05; see right panel Fig.
3
b and Supplementary
Fig. S2d).
TMS Impact on Behavior and Brain-Behavior Relations
Across participants, right FEF stimulation impaired
perfor-mance mainly in the (more dif
ficult) motion task (see Fig.
4
a).
IE scores increased speci
fically for high-intensity TMS during
at-tention to motion, expressed as a task-by-TMS interaction
(F
3,10= 5.4, P < 0.05) with a disruptive TMS effect on motion
(T(12)
=
−2.8, P < 0.05) but not on face trials (T(12)
=
−1.0, P > 0.3
ns). Similar effects were observed for proportion correct and
re-action time scores separately (see Supplementary Fig. 3).
We next examined whether the participant-by-participant
impact of TMS on IE might have a corresponding impact on
BOLD signal in each of the ROIs. We found a positive
corre-lation between the TMS effect on BOLD signal in MT+ and
motion task performance (r(12) = 0.56, P < 0.05; Fig.
4
b).
Thus,
“higher” BOLD signals (due to high vs. low TMS) were
associated with impaired performance. A similar relationship
was found between the TMS impact on BOLD in the right FEF
and performance on the motion task (r(12) = 0.55, P = 0.05;
Fig.
4
c). There were no such brain
–behavior relations for the
(easier) face task (P > 0.45).
Discussion
We used concurrent TMS-fMRI to test the causal role of the FEF
in top-down modulation of neural responses in distinct visual
areas during nonspatial feature attention. We found that right
FEF TMS affected BOLD responses in posterior motion- and
face-responsive visual regions (MT+ and FFA, respectively) in a
manner that depended on the attended feature (motion or
faces; Fig.
3
). Importantly, we found only
“target”
feature-related effects of FEF TMS (i.e., in
fluences on MT+ but not FFA
when attending motion, and vice versa when attending to
faces), with no TMS effects in the unattended category ROIs.
This indicates that the FEF selectively highlights task-relevant
information (
Schall and Hanes 1993
), possibly by speci
fically
modulating functional connectivity with visual areas
proces-sing the target feature. This functional connectivity may re
flect
selective synchronization of activity patterns between neural
populations in the FEF and target feature-processing regions
(
Womelsdorf et al. 2007
;
Fries 2009
) facilitating transmission
of the TMS-induced signal during attention to the relevant
feature.
TMS increased BOLD signal both locally in right FEF and
contralaterally in left FEF during the feature-attention
con-ditions, but not during passive viewing (Fig.
2
b). The right FEF
was thus more in
fluenced by TMS while participants were
ac-tively attending to a feature and signals arising here were
pro-pagated interhemispherically in this context, akin to previous
TMS
findings in the motor system (
Wassermann et al. 1996
;
Bestmann et al. 2008
). Effects of right FEF TMS on contralateral
left FEF have been shown in a previous study, measuring
remote BOLD effects following off-line (thetaburst) TMS
appli-cation (
Hubl et al. 2008
). A recent DTI study demonstrated
fiber pathways that connect bilateral FEF via the
supplementary eye
fields in humans (
Anderson et al. 2012
).
This pattern of anatomical connections is consistent with the
known pathways between these regions in macaque monkeys
(
Stanton et al. 1995
) and may facilitate the signal transmission
from right to left FEF. We demonstrate here the involvement of
bilateral FEF during feature-based attention. However, to
assess whether left FEF plays a causal role in feature attention
would require a follow-up study directly targeting this area.
Our
findings of context-dependent FEF-TMS effects in
anatomically remote regions are consistent with recent
monkey studies demonstrating more pronounced
modula-tory effects on V4 by electrical stimulation in FEF during
increased task demands (
Premereur et al. 2013
).
Monosy-naptic anatomical connections are known to exist between
FEF and MT+ and FEF and temporal occipital cortex in
monkeys (
Stanton et al. 1995
;
Ninomiya et al. 2012
) and
using TMS, functional connectivity between FEF and MT+
has also been demonstrated in humans (
Silvanto et al.
2006
). The study of
Ninomiya et al. (2012)
furthermore
provides anatomical evidence that top-down modulation
from the FEF is not a unitary process but involves
segre-gated neuronal populations (within FEF) and pathways. To
our knowledge, there is no anatomical evidence for direct
fibers between right FEF to left MT or FFA. Activity in left
visual cortex may therefore have been modulated by TMS
polysynaptically, possibly via trans-callosal connections
between extrastriate visual areas (see
Pietrasanta et al.
2012
) or a subcortical pathway.
The induced and transmitted TMS signals were directly
linked to task performance, shown by a correlation between
the TMS-induced
“impairment” in performance on the motion
task (indexed by increased IE) and increased BOLD both in
right FEF and MT+ (Fig.
4
b,c). This effect is opposite to what
has been described earlier in the study by
Ruff et al. (2006)
.
However, in their study, the task was performed separately
outside the scanner, while the TMS effects on BOLD were
ob-tained with no task present. Furthermore, the nature of the
task was different. The seemingly counter-intuitive effect in
the current study could be due to the fact that the task involved
speci
fic neuronal populations (coding different motion
direc-tions) intermixed within the same visual area. An overall
en-hancement of BOLD signal by TMS therefore does not
necessarily imply an increased speci
ficity between activation
patterns of motion direction coding neurons, needed for the
Figure 4. TMS effect on performance and its relation to TMS effects on BOLD in right FEF and MT+ for the motion task. (a) Mean IE scores (see Materials and Methods section) are shown separately for the high- and low-intensity FEF TMS in the motion and face task, with error bars showing ±1 SEM. High TMS led to worse performance (higher IE) on the motion task. Performance on the face task was overall better than on the motion task, and there was no significant effect of effective versus ineffective TMS on the face task. (b) Scatterplot, with regression line, for TMS-induced differences in BOLD signal in MT+, plotted against TMS-induced differences in IE scores for the motion task. Each data point represents one participant. Larger TMS-induced BOLD increases in MT+ were correlated with larger decrements in performance for the motion task. (c) A similar relationship was found in right FEF, that is, larger TMS-induced increases in right FEF BOLD signal correlated with larger performance decrements during the motion task.discrimination task. On the contrary, due to spatial resolution
constraints of TMS, swaths of FEF, including neuronal
popu-lations coding for nonrelevant directions may have been
acti-vated (introducing neural noise), rather than discrete neuronal
populations, thereby impairing discrimination. The content of
the TMS-induced signal may thus have been noisy, while
pro-pagated along task-relevant pathways. Under normal
physio-logical circumstances however, signals from FEF may enhance
salience by speci
fically modulating motion direction coding
neurons activated by the stimulus (
Maunsell and Treue 2006
).
As for the face task, the TMS-induced enhancement in BOLD
signal in the FFA may have been too weak to interfere with
per-formance. Possibly because participants were closer to ceiling
on this task (so that TMS-induced neural noise has less
promi-nent effects), or it may re
flect that in contrast to motion
direc-tion discriminadirec-tion, the face gender discriminadirec-tion task
depends more on global processing than on competitive
inter-actions between different neural populations coding different
sensory alternatives (
Tanaka and Farah, 1993
). Any top-down
signal on the FFA from the FEF may thus not have had a
simi-larly disruptive effect on task-relevant
fine-grained neural
activity patterns in the FFA.
The way in which we de
fined the FFA ROIs (by attentional
modulation) differs slightly from conventional
“face localizer”
methods described in the literature. It is possible that the
atten-tion task in our study relied more on left than right FFA
proces-sing. For example, a recent study demonstrated that left FFA
involvement is more in
fluenced by task context (e.g.,
atten-tion) than right FFA (
Meng et al. 2012
). This may explain why
bilateral FFA was not reliably identi
fied in every participant.
Al-ternatively, the precise spatial extent of FFA may have been
slightly diluted by any responses to the
field of moving dots).
However, the average coordinates for our ROIs (
−35 −54 −14
for left FFA and 36
−43 −17 for right FFA) were nevertheless
well within the bounds reported in the literature for this
speci
fic area (
Kanwisher et al. 1997
).
Taken together, our
findings provide causal evidence
sup-porting the emerging view that FEF is not only involved in
dynamic, top-down modulation of posterior visual areas
during spatial attention, but also during nonspatial
feature-based attention (
Bichot et al. 1996
;
Hung et al. 2011
;
Liu et al.
2011
;
Zhou and Desimone, 2011
). These FEF in
fluences
mainly affect the currently relevant (rather than irrelevant)
feature, indicating that attentional top-down effects arising
from this area may serve to strengthen neural signals coding
behaviorally relevant stimulus features.
Supplementary Material
Supplementary material can be found at: http://www.cercor. oxfordjournals.org/.
Funding
K.H. and J.D. were supported by European Union BrainSynch
Network FP7 Grant 200728. E.F. was supported by an FP7
Marie Curie fellowship. C.C.R. was supported by the University
of Zurich. The Centre for Neuroimaging is funded by the
Well-come Trust, as were E.F. and J.D. J.D. held a Royal Society
An-niversary Research Professorship. Funding to pay the Open
Access publication charges for this article was provided by the
Welcome Trust (ref 087756/Z/08/Z).
Notes
We thank Andy Anderson, Sven Bestmann, and Oliver Josephs for their technical assistance. Conflict of Interest: None declared.
References
Anderson EJ, Jones DK, O’Gorman RL, Leemans A, Catani M, Husain M. 2012. Cortical network for gaze control in humans revealed using multimodal MRI. Cereb Cortex. 22(4):765–775.
Bestmann S, Swayne O, Blankenburg F, Ruff CC, Haggard P, Weiskopf N, Josephs O, Driver J, Rothwell JC, Ward NS. 2008. Dorsal pre-motor cortex exerts state-dependent causal influences on activity in contralateral primary motor and dorsal premotor cortex. Cereb Cortex. 18:1281–1291.
Bichot NP, Schall JD, Thompson KG. 1996. Visual feature selectivity in frontal eye fields induced by experience in mature macaques. Nature. 381:697–699.
Blankenburg F, Ruff CC, Bestmann S, Bjoertomt O, Josephs O, Deich-mann R, Driver J. 2010. Studying the role of human parietal cortex in visuospatial attention with concurrent TMS-fMRI. Cereb Cortex. 20:2702–2711.
Ekstrom LB, Roelfsema PR, Arsenault JT, Kolster H, Vanduffel W. 2009. Modulation of the contrast response function by electrical microstimulation of the macaque frontal eye field. J Neurosci. 29:10683–10694.
Feredoes E, Heinen K, Weiskopf N, Ruff C, Driver J. 2011. Causal evi-dence for frontal involvement in memory target maintenance by posterior brain areas during distracter interference of visual working memory. Proc Natl Acad Sci USA. 108:17510–17515. Fries P. 2009. Neuronal gamma-band synchronization as a fundamental
process in cortical computation. Annu Rev Neurosci. 32:209–224. Heinen K, Ruff CC, Bjoertomt O, Schenkluhn B, Bestmann S,
Blanken-burg F, Driver J, Chambers CD. 2011. Concurrent TMS-fMRI reveals dynamic interhemispheric influences of the right parietal cortex during exogenously cued visuospatial attention. Eur J Neurosci. 33:991–1000.
Hubl D, Nyffeler T, Wurtz P, Chaves S. 2008. Time course of blood oxy-genation level-dependent signal response after theta burst transcra-nial magnetic stimulation of the frontal eyefield. Neuroscience. 151 (3):921–928.
Hung J, Driver J, Walsh V. 2011. Visual selection and the human frontal eyefields: effects of frontal transcranial magnetic stimulation on partial report analyzed by Bundesen’s theory of visual attention. J Neurosci. 31:15904–15913.
Kanwisher N, McDermott J, Chun MM. 1997. The fusiform face area: a module in human extrastriate cortex specialized for face percep-tion. J neurosci. 17:4302–4311.
Kanwisher N, Yovel G. 2006. The fusiform face area: a cortical region specialized for the perception of faces. Philos Trans R Soc Lond B Biol Sci. 361:2109–2128.
Liu T, Hospadaruk L, Zhu DC, Gardner JL. 2011. Feature-specific atten-tional priority signals in human cortex. J Neurosci. 31:4484–4495. Maunsell JHR, Treue S. 2006. Feature-based attention in visual cortex.
Trends Neurosci. 29:317–322.
Meng M, Cherian T, Singal G, Sinha P. 2012. Lateralization of face processing in the human brain. Proc Biol Sci. 279(1735):2052–2061. Moore T, Fallah M. 2004. Microstimulation of the frontal eye field
and its effects on covert spatial attention. J Neurophysiol. 91:152–162.
Morishima Y, Akaishi R, Yamada Y, Okuda J, Toma K, Sakai K. 2009. Task-specific signal transmission from prefrontal cortex in visual selective attention. Nat Neurosci. 12:85–91.
Ninomiya T, Sawamura H, Inoue K, Takada M. 2012. Segregated path-ways carrying frontally derived top-down signals to visual areas MT and V4 in macaques. J Neurosci. 32(20):6851–6858.
Oosterhof NN, Todorov A. 2008. The functional basis of face evalu-ation. Proc Natl Acad Sci USA. 105:11087–11092.
Pietrasanta M, Restani L, Caleo M. 2012. The corpus callosum and the visual cortex: plasticity is a game for two. Neural Plast. 2012:838672.
Premereur E, Janssen P, Vanduffel W. 2013. FEF-microstimulation causes task-dependent modulation of occipital fMRI activity. Neu-roimage. 67:42–50.
Rossi S, Hallett M, Rossini PM, Pascual-Leone A. 2009. Safety, ethical considerations, and application guidelines for the use of transcra-nial magnetic stimulation in clinical practice and research. Clin Neu-rophysiol. 120:2008–2039.
Ruff CC, Blankenburg F, Bjoertomt O, Bestmann S, Freeman E, Haynes J-D, Rees G, Josephs O, Deichmann R, Driver J. 2006. Concurrent TMS-fMRI and psychophysics reveal frontal in flu-ences on human retinotopic visual cortex. Curr Biol. 16:1479–1488.
Schall JD, Hanes DP. 1993. Neural basis of saccade target selection in frontal eyefield during visual search. Nature. 366:467–469. Silvanto J, Lavie N, Walsh V. 2006. Stimulation of the human frontal eye
fields modulates sensitivity of extrastriate visual cortex. J Neurophy-siol. 96:941–945.
Stanton GB, Bruce CJ, Goldberg ME. 1995. Topography of projections to posterior cortical areas from the macaque frontal eye fields. J Comp Neurol. 353:291–305.
Tanaka JW, Farah MJ. 1993. Parts and wholes in face recognition. Q J Exp Psychol A. 46(2):225–245.
Taylor PCJ, Nobre AC, Rushworth MFS. 2007. FEF TMS affects visual cortical activity. Cereb Cortex. 17:391–399.
Townsend JT, Ashby FG. 1982. Experimental test of contemporary mathematical models of visual letter recognition. J Exp Psych Hum Percept Perform. 8:834–854.
Wassermann EM, Samii A, Mercuri B, Ikoma K, Oddo D, Grill SE, Hallett M. 1996. Responses to paired transcranial magnetic stimuli in resting, active, and recently activated muscles. Exp Brain Res. 109:158–163. Weiskopf N, Josephs O, Ruff CC, Blankenburg F, Featherstone E,
Thomas A, Bestmann S, Driver J, Deichmann R. 2009. Image arte-facts in concurrent transcranial magnetic stimulation (TMS) and fMRI caused by leakage currents: modeling and compensation. J Mag Res Imaging. 29:1211–1217.
Womelsdorf T, Schoffelen JM, Oostenveld R, Singer W, Desimone R, Engel AK, Fries P. 2007. Modulation of neuronal interactions through neuronal synchronization. Science. 316:1609–1612. Zhou H, Desimone R. 2011. Feature-based attention in the frontal eye