Protein Engineering vol.5 no.8 pp.729-738, 1992
Quantile distributions of amino acid usage in protein classes
Samuel Karlin, B.Edwin Blaisdell and Philipp Bucber1
Department of Mathematics, Stanford University, Stanford, CA 94305, USA and 'Bioinformatique, Institut Suisse de Recherches, ExpSrimentales sur le Cancer, Ch. des Boveresses 155, CH-1066 Epalinges s, Lausanne, Switzerland
A comparative study of the compositional properties of various protein sets from both cellular and viral organisms is presented. Invariants and contrasts of amino acid usages have been discerned for different protein function classes and for different species using robust statistical methods based on quantile distributions and stochastic ordering relationships. In addition, a quantitative criterion to assess amino acid compositional extremes relative to a reference protein set is proposed and applied. Invariants of amino acid usage relate mainly to the central range of quantile distributions, whereas contrasts occur mainly in the tails of the distributions, especially contrasts between eukaryote and prokaryote species. Influences from genomk. constraint are evident, for example, in the argininerlysine ratios and the usage frequencies of residues encoded by G + C-rich versus A + T-rich codon types. The structurally similar amino adds, glutamate versus aspartate and phenylalanine versus tyrosine, show stochastic dominance relationships for most species protein sets favoring glutamate and phenylalanine respectively. The quantile distribution of hydrophobk amino acid usages in prokaryote data dominates the corresponding quantile distribution in human data. In contrast, glutamate, cysteine, proline and serine usages in human proteins dominate the corresponding quantile distributions in
Escherichia colt. E.coli dominates human in the use of basic
residues, but no dominance ordering applies to acidic residues. The discussion centers on commonalities and anomalies of the amino acid compositional spectrum in relation to species, function, cellular localization, biochemical and steric attributes, complexity of the amino acid biosyn-thettc pathway, amino acid relative abundances and founder effects.
Key words: amino acid usages/quantile distributions/weak and
strong amino acid codon types Introduction
Detailed knowledge of amino acid (aa) usage within and among protein sets may assist in appraising a particular sequence. For example, if a certain protein is reported to be rich (or poor) in a given aa type, one would like to know how significant this cir-cumstance is among a broad collection of proteins from a similar source. From this perspective, invariants and contrasts with respect to aa usage are identified and interpreted for protein sequence collections of several species, including human,
Drosophila, yeast, Escherichia coli and Bacillus subtilis; for open
reading frames (ORFs) in three large human virus genomes, human cytomegalovirus (CMV), Epstein—Barr virus (EBV) and vaccinia; for various human protein subclasses (e.g. nuclear, glycoprotein and enzyme); and for E.coli enzyme.
Our motivation for these analyses derives from an interest in the following biological and evolutionary issues: (i) How do aa usages compare and contrast across species, say E.coli versus human, E.coli versus B.subtilis!; (ii) What is the nature of aa usage per protein in relation to function, cellular localization, evolutionary history and other biological criteria?; (iii) How do aa usages of similar biochemical, charge or steric attributes relate? For example, how do the quantile distributions compare for Lys and Arg (both positively charged), for Asp and Glu (both negatively charged), for Gly and Ala (bodi of small size), for Ser and Thr (having similar post-translational modification potential), for the amide side chains residues Gin and Asn, among strongly hydrophobic amino acids (Leu, He, Val, Phe, Met) and for relationships related to evolutionary substitutability?; (iv) other perspectives on aa compositional preferences relate to the complexity of the biosynthetic pathways for the different aa, to aa relative abundances, to aa distributions along the sequences, to intra and extracellular pH, to codon biases, and to founder effects.
Residue usage across protein subsets has been the subject of a number of comparative studies. Sueoka (1960) noticed a general correlation between deoxynucleotide and aa composition for a variety of organisms. King and Jukes (1969) determined the aa composition of 53 vertebrate polypeptides (total 5492 residues) and claimed, excepting arginine, concordance of observed frequencies with expectations derived from random codon choices. Nakashima et al. (1986) investigated the influence of folding types on residue usage. Doolittle (1986, pp. 55-59) compared the aa composition of E.coli and human protein sequences and observed the reduced use of cysteine in E.coli (putatively all prokaryotes versus higher eukaryotes). McCaldon and Argos (1988) organized peptides ranging from 2 to 11 residues and projected certain preferences in protein sequences. Dcemura et al. (1990) and D'Onofrio et al. (1991) analyzed the aa composition of individual mammalian proteins under the isochore hypothesis (see also Aissani et al., 1991). All these comparative studies have centered on average residue usages of different protein collections.
Our results are based on more robust quantile distributions and stochastic ordering concepts applied to different amino acid classifications. For a given residue type (e.g. individual aa, cationic, anionic, aggregate hydrophobics) and a given protein collection C (e.g. all protein sequences of a particular species or function class), a histogram of use for the residue type was generated. Concretely, for each protein sequence of C, the frequency of the residue type in the sequence was determined and the totality of all these frequencies was described by a histogram of the given residue usage with respect to C. The quantile distribution is the cumulative representation of this histogram. Thus, the quantile distribution Q(x) of a given residue type for a given set of proteins indicates the fraction of proteins in which that residue type occurs with a frequency ^x%. The medians (the 0.50 quantile point) and 80% quantile range (corresponding to the 0.10—0.90 quantile levels) are major statistical measurements. The 0.01, 0.05, 0.95 and 0.99 quantile
points of aa usage provide standards by which to assess extremes of aa usage for any particular protein or protein family. Quantile distributions for the different protein sets were determined for each individual aa (Tables I and D), for the aa groups of positively and negatively charged residues and for total and net charge values (Table HI), for the aggregate of the major hydrophobic aa (Table IV) and for strong and weak aa codon types (Table V) (see Materials and methods).
Materials and methods
Data
Protein sets were compiled from SWISS-PROT release 17 (Bairoch and Boeckmann, 1991). Duplicate and highly similar sequences were culled to remove redundancies with the aid of the program PROSET (Brendel, 1992). The fruit fly and yeast sets respectively contain proteins from D.melanogaster and
Table I. Quantile distributions of amino acid usages in different species
Q a n O a Raat E D K R H L I V M F W P o A I T Q N C Q t m B c Rank B D R H L 1 V M F Y P 0 A 1 T Q N C Qtacrik Raox E D K R H L 1 V M P Y W P 0 A I T Q C Qoacrik R a t * E D K H L 1 V M F Y W r o A I T Q N C M k . 1 03 OI OO 0 3 0 0 O J OO 0 4 OO OJ) OO OX) O J 1 3 1 2 O J OO 0 3 0X1 OO M b . 1 O 7 03 03 1 1 OO 3 3 1 7 1 5 O J 0 3 OO 1 1 O J 1 0 1 3 1 3 0 0 0 4 OO M k . 1 OS 0.7 1X1 1.1 O J 1 1 1 9 3 4 O J 1 4 O J 0X1 O7 2 3 I J 2 3 2 3 O J OO M k . 1 1 3 1 3 0 0 0 4 1 2 OO 3 3 OO 0 5 0 0 0 0 1 5 2 2 1 1 23 I t I J O 4 0 3 XII 1 2X1 1 3 08 1 3 0 3 3 3 0 1 2 2 0 4 33 3 1 3 2 5 3X1 1 1 1 7 14 0 4 OO £ 1 I 1 3 1 3 1.7 0 2 5 2 2 3 3.7 0 7 IXI 03 00 14 2 5 4X1 1 4 2 3 1 2 1 3 0 0 XII 2 1 2 0 9 2 4 1 3 0 3 S J 1 3 3 4 O J 1 4 IXI OO 1 1 2 3 2 3 3 3 1 1 0 5 OO XII 2 I J 1 3 O J 0 9 3 3 O J 3 3 0 3 1 2 O J 0 0 1 5 2 2 1 1 1 4 SJ 1 3 0 4 0.7 XO 31 55 5 2 3 0 5 5 3 U 1 7 O J 13 1X1 02 2 4 4X1 4.1 4 2 1 0 1 3 1 4 0 4 M 36 2 3 1 4 1 7 0 4 6 3 1 4 4 4 1 1 1 7 1 1 00 13 4-2 3 4 3 2 1 3 1 5 LB 0 0 XB 7 2 3 1 5 3 J 1 5 0 3 1 1 4 2 4 4 1 3 1 5 1 3 OO 1 7 SJ 1 8 3 5 3 3 1.7 15 OO 03 6 1 5 I J 04 u 1 3 S J 1 2 4 5 0 4 I J 0 3 0 2 1 1 2 J 4 2 4X1 1 6 1 3 0 5 1X1 10 76 4 1 SXI 1 0 3 1 1 1 6.4 1 1 4 2 1X1 1 1 1 3 O4 1 4 4 4 4 3 4 7 3 3 1 7 1 1 O7 10 71 3 3 1 9 1 1 1X1 7 2 3 J 5 2 1 3 2 2 1 4 03 1 1 1 0 6 4 3 J 1 1 2 3 2 2 0 2 10 14 3 4 3 3 4 J 1 2 0 5 6 J 4 5 4 J 1 4 1 2 I J OO 2 2 4 3 4 3 4 3 1 7 11 14 OO JO 12 2 3 1 3 I J 1 7 6 5 14 3 3 O J 2 3 I J 0 3 3 2 1 7 4 J 4 J 4X1 1 5 14 I J 2 5 I B in 4J) 4 2 4 1 1 4 7 J 1 2 5 2 1 3 25 12 OJ 4 3 1 7 5 3 1 7 4 3 1 4 2 5 1 2 2 3 171 4 J 4 2 14 4.4 1 3 1 4 4 4 6.1 1 5 1 1 L9 0 4 33 6 3 1 0 4 3 4.4 1 2 1 9 0 3 l i e 2 5 14 6 4 4 7 S J 3 1 1 4 7 J S J 1 1 1 0 1 4 1 5 OJ 1 9 5 2 3 2 4 5 4 J 17 11 0 2 2 5 29 3 4 1 2 15 1 1 13 1 5 2 2 6 4 1 2 1 5 1 4 0 7 4 2 4 4 6 2 6 2 1 0 1 3 1 1 1.7 H . 3 0 376 63 SXI 34 5X1 2 3 9 4 4 3 6 4 1 1 31 10 12 5 4 6 5 6 J 7 1 5 3 4 2 1 1 1 5 E. c 3 0 335 6 3 5 4 5 7 1 3 101 3 7 7 1 2 4 3 3 1 7 4 3 7 7 9 4 3 3 5 2 4 2 3J 1.1 III! 3 0 M 1 1 1 6 7 2 4 3 1 0 1 1 7 2 7X> 1 7 1 7 1 0 0 6 1 7 7 1 7 1 6.1 5 3 3 7 0 7 3 0 5 1 3X1 4 4 2 4 3 1 102 1 4 7 J 1 5 1 7 3 2 14 5 4 5 J 7 3 7 4 6 3 S J 1 9 1 4 . . . 75 564 7J SJ 71 6 2 1 9 11X1 5 4 7 4 1 7 4J 17 15 7 3 1 4 1 3 8 3 6 3 1 1 4 7 1 9 o i l .73 533 7 3 6 3 7J> 1 0 115 6 J 1 4 3J 4 3 3 3 5 2 9X> 110 6 3 6X1 5 2 4 4 1 3 l a b l 75 102 9 4 6 3 1 3 5 3 1 1 103 1 1 1 1 3 2 4 J S J 1.1 4.4 1 1 9 3 7 J 6 2 43 53 12 .73 17 6 2 3 4 1 4 S J 113 41 1 7 1 7 4 7 4X1 1 3 7 4 7.1 • 4 1 1 1 4 4 2 4X1 1 3 5 0 676 9 4 1 1 7 3 1 7 117 6.9 1 7 3 3 57 44 15 9 3 nxi KL4 101 7 4 6 3 1 7 4 5 50 639 1 4 7 1 1 0 1 1 134 1 3 9 4 4 1 3 J 44 16 6.1 102 124 7 4 7.0 6.4 5 4 1 1 III! 5 0 122 104 7 3 10.4 6 3 3 3 111 103 9 2 3 7 6.4 4 3 1 1 4 5 10.1 105 1 2 7 1 6Xi 14 5 0 104 7 4 6.1 4 4 4S 14 1 6 3 101 1 3 3 4 5 2 1 9 9 J 9 4 1 0 1 1 0 4 » 7 1 1 1 6 "42 5 5 714 112 9 5 1 6 4 1 14X1 7 3 » J 1 1 6 2 3 1 2 5 11X1 112 114 105 1 3 7 3 6A 6.1 5 5 673 9 1 7 7 1 1 4 3 15J 9 2 104 4 7 6 4 5X1 6 5 11X1 133 | 4 7 J 7 3 6 3 2 4 5 5 129 11 1 7 5 113 7 1 4.1 135 11.7 ICLO 4 J U 5 4 2 4 5 2 104 1 1 1 9X1 7 7 6 J 1 3 5 5 i n 1X1 7 1 5 5 5 5 163 6 J 107 4 2 6 3 6X1 i t l i t 102 1 1 J 117 1L4 1 1 6 4 4 J 5 9 744 16J 14 1 110 3 4 1 7 1 9 3 103 4.7 7 3 1 7 173 2 4 J 142 14 4 11X1 105 7 4 7 4 5 9 703 i i i 1 8 1O7 5 2 173 1 0 4 115 5 7 1 2 7 2 1 3 113 110 10X1 9.1 9X1 1 0 S J 5 9 134 11.7 1 1 123 1 5 4 3 14 9 133 113 4 3 102 7 0 1 6 5 5 122 133 113 11.7 7 5 S 3 5 9 114 9 4 1 0 7 2 111 7J) 171 7 5 1 1 0 4 1 1 2 7 3 4 2 1 1 2 16.7 14.1 1 1 2 113 7J> 9 J 7 3 M I L 731 2 0 2 at 19 1 1 2 4 2 2 J 11X1 124 6 3 9 3 5 5 3 6 4 2 8 J 26.1 173 133 1 5 4 9 2 112 M n 710 119 103 119 6 3 2 1 2 13 7 139 6 3 114 1 7 16.4 142 3 0 5 114 111 110 9 7 7 5 M n . 135 143 9X1 13X1 9 2 4 J 17.4 16.1 112 4 4 103 7X1 5 2 7 J 13X1 14.1 134 111 1 0 4 4 M n . 113 1 1 1 9 1 7J 165 74 2 4 4 7 J 1 1 1 3 3 102 9 2 1 7 162 ( 9 3 144 1 1 1 19t 1 3 » 5 9 4 6.7 SJ) 3J 3 3 1 4 9 3 4 3 6.4 1 2 3 J 14 6 2 7 4 7 2 7 3 5 4 4 3 1 9 1 3 6.1 5 3 5.7 1 3 103 5 5 7 J 1 7 1 1 1 1 4 4 7 4 9 4 5 4 5 J 4 J 3 5 L I 7 7 S 3 7 3 4 2 1 2 9.1 7 4 7Xi 2 4 4.1 1 2 0 5 1 6 7 1 7 4 6 J 14 1 1 OJ M m 5X1 4 3 17 10 12 103 3 4 7 7 1 0 3 5 3 3 1 4 6.1 6 2 7 J 7 4 6 5 3 4 1 3 1 7 SJder 2 3 14 2 4 1 0 1 1 1 7 I J 1 7 0 9 13 0 9 1 1 3 2 2 3 1 2 17 15 14 17 1 0 14 15 L I 2 4 I J I J 1 1 13 IJ 1X1 L4 1 0 2 3 14 14 14 L4 0 9 1 3 14 1 1 14 0 9 1 3 2 2 17 0 1 1 5 1 2 OJ 1 1 2 2 1 6 1 7 13 1 3 0 7 S U C T 1 5 14 14 1 9 1 3 3 2 I J I J 1X1 13 14 I J 1 1 1 6 1 3 1 2 2 J I J I J M QnaraOc R M t E D I R H L 1 V M Y W P 0 A 3 T Q N C Qnamfla Racfc E D K R H L 1 V M P Y w P 0 A 1 T Q N C Qwnik R i d E D K R H I V M P Y W P G A S T Q N C H e 1 OJ IX) 1 0 0 4 0 0 1 2 1 2 1X1 OO OO 0X1 0 0 1 5 14 1 1 1 0 1X1 OXi M k 1 0 7 I J I J 0 4 OO 0 2 O7 0 5 0 0 OO 0 3 OO OO 1 2 0 3 1 1 0 3 1 1 1 3 OO MJo. 1 1 0 3 J 2 3 0 6 0 0 4 4 1 9 O J 1 3 0 3 0 0 O J I J 0 5 3 4 1 4 O J 1 9 O J i l l 3 LO 14 1 3 15 0X1 2 4 I J 2X1 0 2 0 3 0 0 13 1 1 33 L7 13 14 0 0 -a— 5 14 14 1 9 1 3 0 4 4.7 1 1 2 3 0 3 12 0 5 0 0 I J 2X1 1 7 4X1 1 6 1 4 1 0 0 0 Xil 2 15 3 J 3 J O J 0 4 4 7 3 1 O J 1 4 1 4 OO at 14 0 5 4 5 3 3 O4 1 9 0 3 XB 12 Ifc 1 3 1 1 1 6 IXI 4 J 12 1 0 0 9 1 2 0 0 2 4 2 5 4 1 32 1 4 1 6 0 2 m 22 1 4 3 3 4 1 1 1 OJ 6 0 1 5 14 0 5 2 2 14 0 0 1 3 1 7 3 2 4 J 1 7 1 0 1 1 OO 03 6 4 2 4 5 2X1 O7 6 4 1 1 I J I J 2 4 OJ) I 1 1 1 14 5 4 4 1 0 1 4 J 0 3 to 23 3 4 3X) 3 3 1 1 1 3 S 3 2 3 1 4 U 1 3 0 2 3 2 3 7 5 3 SJ 1 7 3.1 O4 10 44 4 4 4J) 4 5 1 7 1X1 6 J 4 3 3 5 1 2 1 6 1 7 0 2 1 1 3 3 S J 3 4 4 2 1 4 1 4 O J .10 11 4 3 5 2 1 3 IJ) 6.7 4 4 1 3 2 3 3 2 OO 1 5 12 1 0 S J 4 4 1X1 5 1 0 4 2 5 57 4 4 1 9 4 1 4.1 1 5 6 4 3 3 4 3 1 4 1 0 OJ 4 2 4.8 4 3 3 4 1 9 0 5 2 5 108 1 4 4 5 6.1 3 3 14 1 0 5 2 4 7 L 6 3 4 1 3 0 3 1 6 4 2 4 J 6 3 4 5 3J) 4 3 0 4 2 3 21 5 4 6 J 3 2 1 3 1 0 1 4 1 0 3 3 4 2 O J 1 4 SJ) 1 8 6.7 3J) 14 5 5 I J 3 0 114 5 9 S 1 3 2 SO 1 6 1 0 4 9 5 7 1 3 1 9 O J 3 J 6 J 5 3 4 3 4 5 1 4 3 0 216 6 3 6J> 7 4 4 3 1 1 9 1 6 3 6.0 1 0 4 3 S J 0 5 4 J 5 3 6 2 7.7 5 4 3 4 3 3 1 1 V i c e 3 0 53 6 6 7 J 4X1 1 0 1 6 94 6 3 1 7 4 7 3 1 0 4 3 4 3 9 3 4 7 J 6X1 1 1 6 J 1 5 .73 171 7 2 6.1 6 J 6 2 1 7 9 3 6.0 6 5 in 4 X 1 2 6.7 1 0 6 4 6 2 1 9 1 4 75 324 7 4 6 J 1 4 5 2 1 7 103 7 4 7 1 1 3 5 2 4.1 L4 1 1 7 1 1 0 9 2 6 3 4 3 6 3 14 i a la 75 •3 7 4 1 5 4 J 1 7 104 7 J 3 4 3 J 6.1 1 0 4 1 4 J 4 4 9 1 7 1 1 7 7 J 1 7 5 0 203 12 7 J 9 1 7 7 4 3 I1J) 7 3 1 1 35 13 4 7 1 0 8 2 100 7 3 9 1 7.1 3 4 5 0 318 1 9 1 0 1 1 6 3 3 2 117 1 3 1 1 3 2 5 5 4 J 2 1 6 0 1 4 9 3 113 7 3 5 4 1 1 1 1 5 0 99 I J 9 4 5 7 3 2 114 1 2 4.1 6.7 7X1 13 4 5 3 3 3 7 101 • 2 3 3 U 34 5 5 216 lOt IS I 0 J 90 5 5 1 1 5 7 5 1 1 4 7 S J 1 3 9 4 113 1 0 111 1 4 4 J 5 5 410 1 0 0 1 7 105 6 J 3 4 124 1 9 1 1 1 6 6.7 SJ 1 4 6.7 9 2 104 1 2 4 to 6.7 9 1 1 3 .93 KB 9 3 102 6X1 1 6 123 1 5 4 J 7 3 7 5 1.7 5 5 &4 6 4 111 9 5 1 9 93 4 1 5 9 223 14J 9 3 133 11J 7 2 14 7 9X> 102 6X> 6.7 3 3 4 5 7 4 0 4 1 7 in 8 3 5 9 427 117 111 1 3 2 1 9 4 J 143 104 1 0 2 4 4 I X I 5 5 3J) 9X1 1 0 J 1 2 4 16J> 1 0 4 117 14 4 1 3 5 9 109 11 1 1 0 1 7 3 1 4 1 3 4 9 J 3 4 1 3 1 5 2 3 6 4 7 J 1 4 U J 113 5 4 101 6 3 Max. Ill 2 7 4 102 2 6 4 2 0 J 7 5 153 142 109 6.7 9J) 4 2 no Tit 4 1 3 115 15.1 9J> Max. 431 144 16J 15J> 107 S7 117 111 no 9.1 9 3 10X1 1 1 11 1 19J) 2 0 5 1 6 3 2 5 2 2 6 5 233 3 3 Mai. 110 11X1 1 1 1 7 3 34 133 134 » 5 6 4 9 1 1 7 1 4 B.7 P06 112 14J 162 9 4 1 1 1 6 1 M » S * 6.1 17 5.1 1 7 SJ 17 34 22 18 1 4 11 13 45 1 17 1 24 1 31 1 J J 1 J IJ) 07 54 24 6J 11 62 18 5 7 19 5J 25 5X1 I J 15 13 M» * * . 64 20 6J) I J 74 10 44 13 11 09 9 2 20 63 1 6J) 1 11 0 44 1 3J 1 IJ) 0 44 1 37 2 63 2 11 1 SJ 1 4J) 2 17 22 12 OJ M m M a r 33 14 64 14 74 14 41 13 11 IJ) 17 10 92 L9 6J 13 11 11 4 7 14 12 14 O7 03 14 14 4X1 1 17 14 10 15 6J 15 22 12 69 14 11 12
Amino acid usage in protein classes
Saccharomyces cerevisiae only. The viral protein sequences
correspond to known ORFs. Several nonexclusive protein subsets were defined relying on the SWISS-PROT keyword index encompassing the human nuclear subset, a human glycoprotein subset and human and E.coli enzyme subsets. In every data set sequences shorter than 200 residues were excluded to reduce statistical fluctuations. This length limitation excluded ~ 2 5 % of all proteins. Only — 10% of enzymes fall below the 200 aa
TaWe II. Quantile distributions of amino acid usages in different subclasses
of human and E.coli proteins
QiawOe l U E D K R H L 1 V M F Y W r o A S T Q N C Qom&Je Ran. E D K R H L 1 V M F Y W P o A S T Q N C Min. I 1 5 0 J 2.7 1 4 ao u 0.7 14 0.0 0 0 0 0 0 0 1 2 2.9 3 0 1 1 2.1 0.6 0 0 fcfiu. 1 I J 0 J O0 I J OJ 3 J 0 0 0 1 0 0 0.4 ao 0 0 a t u 1 6 2 3 0-4 O J 0 J ao .01 I 2 J 0 J 2.7 14 0 0 IJ 07 14 0J> OS 0J) ao 2 J 1 9 3D 2.1 2.1 0 J 0.6 OJO J0) 4 1.9 1 7 0 J 1 7 0 4 3JS 0 J 2.9 0 J 0 J O6 0 2 2.1 2.7 3J) 1 7 2 J 1.6 1 1 0 J XB 4 3.4 1 7 3 J 1 0 0 4 4J) ng 2 J 0 9 as 0 4 ao 2.7 3 6 4 1 4 J Z9 1 2 I J a i XB 16 3 J 1 7 1 7 2.4 0-9 5-5 I J 3.9 0.1 1 7 IJ) OJ 3 3 4 1 3 7 4 J 3 J 2 4 I J 0 6 10 1 4 J 2 J 3.6 3 4 0 8 4 9 3 4 IJ) 1 7 1 1 OJ) 4 1 4 J 4 J S I 3J 19 IJ OJ 10 32 3 7 3J) 2 J 2.9 1 1 6 J 1 0 4 J IJ> 1 4 14 0.7 4J) 4 7 4 J 54 3 J 1 8 2 3 0 9 25 is 5-2 3.4 4 4 4 4 I J 6.4 2-2 4 J I J 12 I J OJ I J 5 J 6 3 7 J 4 0 37 2J O9 G l j t t ,23 SO 4 7 1 9 3.7 IS 1.7 7 J 3.2 5 J 14 3J) 2 J IJ) 4 7 5 7 5.1 6.4 4 J 34 12 I J JO 3S 6 J 5J) 5 J 5 J 1.9 S.4 JJ 52 1 3 1 9 2 J O6 1 0 6-7 7 6 1.9 52 3 J I J P ' o l e JO 139 5 7 4 J 4 J 4 9 1 4 » J 42 6 6 I J 4 0 3 1 I J 5 9 7 1 6 J 7 J 5 7 42 4 1 1 4 75 57 BJ 6X> 6 J 69 1 6 104 62 IS 3 7 3 J OS 101 S 3 9.6 10J 5S 4 4 1 4 75 239 69 5 J 6 4 5S 1 9 \]2 5 4 7 J 1 5 5 J 3-9 1 1 7 4 1 2 7 J 1 6 6-6 5 I 5J> 3 7 90 69 9 J 11 8 4 12 3J 11J 5 4 7 1 3 7 42 4 J I J 13 J) 1 1 0 II 1 13J 7 J 3 J 3J .90 ai u 6 J 7 4 7 4 3 4 13J 6 6 S J 3-2 3.9 4 7 1 7 9 J 9 7 9J 9 J 7.9 6J> 6 J 6 1 55 73 1O7 1 0 0 114 101 41, 114 6 J 7.7 4 4 5 3 3J) 2 3 14J W J 13 1 144 1 7 59 4.0 • ) 9 3 303 9 1 6.7 I J 1.4 42 149 7 4 9 J 3 7 6 3 3 4 3-1 1 U 1 U 104 i a 4 9 4 6 6 69 6.9 S9 76 I 6 J I2J) 2SJ 19 1 7 1 133 8 4 6J> 62 5 6 3 1 20 JO 2 4 J 2 6 1 15 1 11.6 6.6 4 3 99 313 111 %2 » 7 114 5 1 174 • J 10J 4 J 7 J 62 4J> its 2 7 6 134 119 113 1 4 1 2 7 9 M B J . 76 161 110 2 S J 191 7 1 U J 1 6 6JI 62 5 6 3 I 2O0 » J 26.1 13 1 116 6 6 4 J M u . 3IS 19J> 153 1) 1 133 124 2 1 1 11J) 112 6 J » J 7 3 5S 3 3 2 3 6 17J) 14J 13J I 3 J 92 BJ 7 1 3J) 6 3 59 1 1 1 3 52 2 3 1 9 1 6 0 7 12 7 J L I 9J> 52 3 J 1 7 5.9 4 J 3JI 5-1 1 4 9 7 4 3 6.7 1 0 4 1 3 1 16 6 6 7 6 6 J 7 J 51 4 4 42 1 9 Sjdev 14 1 3 3 7 1 7 I J 1 7 I J 1 0 12 I J 0 6 3 J 34 12 1 9 1.8 14 1 1 19 1 4 19 19 1 1 1 1 I J 17 0 9 14 13 0 9 1 2 3 7 1 1 I J I J I J I J 19 QMBtile E D R H L I V M F Y W r a A s T Q N C Q t m t i k Rank E D K R H L I V U F Y w T a A S T Q N C Mta. 1 9 1 9 I J 0 3 3 3 U U 0 4 0X1 0 7 ao u 1 9 1 1 I S 1 3 14 0 6 0 0 fcOa. 1 I J 12 1 1 I J O J 3 J 1 7 3 J 0 4 IJ) 0 3 0 0 1 1 19 1 0 1 1 I J 0X1 O9 0.0 J)l 23 1 6 14 2 3 OJ 3.4 1 3 3 4 OJ 09 OS ao 2 6 4 I Z 7 3 3 1 6 I J I J O2 Xtl 4 13 1 4 I J 19 O6 4 J 1 3 4X1 OJ 12 O7 0 0 13 3 1 1 9 2 3 1 7 I J 14 0 0 XU 3 9 3 4 1 4 1 6 L2 6-1 1 7 4 J LO 1 4 14 0 4 1 3 4 J 4 4 4 3 3 3 2 3 1 0 OJ xa 18 18 3 1 1 4 1 1 IJ) 6.4 1 5 4 J 1 3 IS 1 3 O2 I B 4 7 5S 1 1 1 3 1 9 1 0 0 3 10 42 is 10 34 I J 7 1 1 2 4 7 I J U 19 0 6 3.7 54 4 J 4 7 3 7 1 7 1 4 IJ) 10 36 4 4 3 J 2 J 3 4 13 12 3 J 5 3 1J> 1 3 1 4 0 3 1 1 3 J 7J> 3.7 4J) 1 4 t 5 0 4 E a z .23 52 4 J 4 1 19 SJ 4X1 5 6 I J 3 J 1 6 1X1 4 6 62 5 4 5-5 44 1 3 1 2 14 y me > JO 6 3 3-2 3 1 I J 9 J 5 0 6 4 2 3 42 1 3 I J SJ 12 6 J 6.4 3 1 4J> 1 9 I J E • I y m 1 1 25 90 5 3 4.9 3 4 4 J I J 12 4 7 6.1 2J) 1 1 1 1 0 4 3 7 6 4 1 1 4 4 4 J 3J 3 1 O8 JO 180 6 J 5 7 4 4 SJ 1 4 9 4 5.7 IX) 1 6 3 J 1 8 1 I 4 4 19 91 52 5-2 4X1 19 \2 ( k a » .75 7 4 5 7 6 J 1 0 I 0 J 53 7 J I S 3 1 4 1 1 1 6 2 8 3 BJ 7 4 5 1 4 7 4 4 1 7 • • ) SO 8.7 6 J 7 1 1 7 12J 7 1 S J 3 3 6.0 49 1 6 7 4 9 7 106 SJ 6 4 1 4 5.7 1 1 ( E . c o l i ) .73 270 7 4 6 J 5 7 6 4 3J 11-0 6.7 U 1 3 4 4 1 6 I J SJ 9X1 U J ) 6J) 6X> 49 4 J 1 4 SO 334 8.4 7 J 6 J 7 J 1 8 1 1 6 7 J 9 4 1 9 SJ 4 3 1 4 6X) 101 124 6.9 6 J 6J) 3 3 1 0 95 st 94 11 1 7 1 8J 74 19 4J) 4 4 124 149 7J 17 »4 10J 3 7 44 64 7J 5.7 62 3 8. 1 0 11 9 I S 99 114 13J 104 11 14 6. 7 4 6J 74 47 6J 95 99 342 337 84 97 74 BJ 7J S.4 SJ) 92 42 51 134 15J SJ 103 1 0 11.1 43 53 62 IB 4 7 7 J 12 4 J 64 74 109 I I 7 MO 154 7 7_ 6 , 8-4 9 1 7 4 59 7.7 2_ I S 117 9.7 13J 4 6 I 6 J 1IX) 114 5X1 9 1 7 J 59 110 I9X) 13X1 I 1 J 113 SJ 8 4 7 J M n . 160 109 9 J 106 106 3.7 17J I2J) I U 3 J 8.7 SJ 6.7 SJ U J 17J l i t i a i 103 S J 4 4 ttat 6.4 5 J 5 7 52 1 5 9 4 5J) 6.7 2 3 4 J 3 4 14 SJ 74 7 J 6 J 51 4.1 4J) 1 2 Mtm 6 4 5 4 4 7 5 J 1 3 9 7 5 J 7 J 2.7 3 7 19 I J 4 J 7 J 9.7 3 J 5 J 4 1 3.9 1 3 S a b 1.7 1 1 1 ) I J 0 9 1 0 I J I J 0 8 I J I J 0.B 14 11 1 2 I J U 1 2 U I J 14 13 I J 14 IJ) 1 1 14 14 0 9 13 U IX) I J u 2 3 13 I J 1 4 U 0 7
criterion. Small proteins might differ in their aa composition from the bulk sequences. However, proteins of small size would, with > 20 aa types, produce a preponderance of outlier observations, thus distorting the statistical analysis.
Quantile distributions and stochastic orderings
For each residue type and a specified protein class C of an organism, the quantity y = Q(x) is the fraction of proteins of
C which carry the specified residue type at a frequency at most x. The quantile distributions are displayed for the quantile levels y = min., 0.01, 0.05, 0.10, 0.25, 0.50, 0.75, 0.90, 0.95, 0.99,
max., as representatitive of the whole distribution relative to the appropriate class of proteins and residue types. The distributions are not Gaussian and for most aa the standard deviation is larger than what would be expected from the mean aa frequency and a protein size distribution based on a binomial model. A quantile distribution £)(•) is said to be stochastically larger than the quantile distribution Q{-) if Q(x) < Q(x) for all x. This rela-tion implies that at each y the usage x corresponding to the quantile distribution Q() exceeds the usage corresponding to the quantile distribution Q{-) and, more generally, each monotone transformation on levels of usage is similarly ranked; for statistical elaborations see Pe£arid et al. (1992). Stochastic dominance is
TaWe HI. Quantile distributions of charge types in different species and
viral protein sets
Dnx. YCBt E-cofl B fub. C M V EBV Vacc H a m ™ * . HmrLtp H a m . a u -Ecau. Humtn Dra-YtaM E a d B Bib C M V E B V V K C Hmn.noc Huirvgp. H u n v a u . Ec-au-Haman Dnx. Yt«fl E-colf B-fob C M V EBV V»cc H a n rot Htm\gp. Huntfnz. Ec«nz-tta«n Dre. Ynst E-atf t a n k C M V EBV HannK. Hum.rp. Hum a i . E t o n . Mln. 4 3 3 1 3 D 4 9 4 J 2 4 5 4 4.7 4 J 3 9 3.0 MJn. 0 4 1 0 3.3 3.0 1 8 1 7 3 1 6 J 3 4 3 9 4 9 3 J Mln. 6 3 7J> 7 J 7 1 9 4 9 4 9J> 13J) 9 7 » J 1 1 1 1 3 M M -144 -112 -133 -101 -7.5 -7.1 -1O6 -9J) - « 4 -144 -»X) -6.4 xn 4 J 5 1 5J> 5J) 5 4 2 4 6 3 4 7 9 4 5X) 5 ! xn 4 9 4 7 3 4 3 J 3 1 3 1 3 1 SJ) 3 4 4 9 6.4 5 J j n n j lij) 1 2 4 9X) 9 4 9 9 9X) 13.8 9 7 1 1 1 1 3 9 11J) xn -it - 8 4 - 1 0 4 -7.1 - 6 7 - 6 7 - 1 0 4 -»J> - > 4 -t9 -71 - 5 J a 6.9 7 4 6.1 6.9 5 J 3 1 SJ) S I 6 J S 3 7 4 XB 6 J 3 J 7 7 3 1 4 1 4 1 4 4 S.9 SX) 6 J » J 7 7 XB 1 3 3 1 1 1 1 6 J 1 1 J 1 1 J 1 1 7 1 1 J 1 S 4 14X) 15X) 1 6 7 16.1 XB -3-1 -3.1 -AX) - < J - 3 J -3.1 -5X> -3J) - 6 J - 3 3 -42 -42
PtXtfiviy c h a i j H amb» adds CK+ 10 7 6 8 7 7 4 IS 12 6.7 8 7 8-7 7 J B J 8.1 25 92 101 9J> 9 J 9 J BJ 102 9 3 8.7 9 4 9 J JO 1 0 4 1 1 7 104 1 1 J 1 0 J 9 4 1 1 J 1 1 4 9 9 1O9 1 0 2 7 5 1 1 9 1 1 5 1 1 1 1 1 5 1 1 2 111 1 1 9 1 3 J 11X> 11.9 114 X 1 4 J U ) 131 15X1 14 4 12J 13 9 1 5 7 1 1 7 131 115 R) 95 5t 59 I S 6X1 6 J 1 6 134 ! 0 J 4.1 4 3 3 3 Negatirdy dunjed amino adds ( I > E )
10 1 0 7 1 9 1 6.7 S J 3 J 5-5 9 6 7 J 7 4 9J) 9 4 to 1 7 1 1 5 3 1 8 4 1 4 7 1 5 7 1 3 J 13X) 19 4 1 7 J 1 6 J 1S.4 18-1 10 - 3 7 -3 6 - 4 3 - 3 7 -4-9 - 1 0 - 1 7 - 3 J - i t - I t -3J> -S9 J 3 9 4 • J 10J 1O0 121 7 1 7 4 109 • 1 f j 102 11 1 TotaJ J3 194 1B4 21J 194 2 1 9 171 173 21.5 199 112 204 204 JO 11 4 11X1 m 1 1 9 H J) 9 J 9 4 1 1 J 1 1 9 1 0 4 1 1 J 1 1 2 7 5 13-2 1 1 8 14 J 1 1 3 154 114 111 134 I 4 J 1 1 1 1 1 0 1 3 J charge 0C+B4 JO 22 1 219 2 4 J 2 2 4 2 3 4 2 0 " 1 9 J 2 3 6 2 1 2 2 0 4 2 1 3 J J J 7 5 2 5 J 7 5 7 169 2 4 9 2 8 J 23.4 2 1 3 2 3 J 2 7 4 2 2 J 2 4 7 2 4 J .90 15J 13J 1L1 144 16J 131 118 144 17J 1 3 3 14 4 1 4 J E-tD) .90 95 U 7 7 7 J 3 4 7 J 5X1 1 3 6 4 9 7 4 4 41 3X) 95 2 9 J 32.1 J 9 J 3 1 2 2 9 J 2 6 7 3 0 4 2 6 J 2 3 3 H 4 » J H B 173 4 J 27.9 29X) 3 3 7 2 3 J 2 7 J 2 » J N H charge (K>R-I}-£> J 3 - 1 2 - L 9 - 2 3 - 2 4 - 3 7 - U - 1 7 - I J - 1 3 - 1 2 - 1 0 - 1 9 JO - 0 7 -03 - 0 7 - I J -2 4 0 4 0 0 - 0 3 -O4 -Ct - 0 4 -2 1 7 5 IX) 1 3 0 9 0 4 O J 3X1 2 J I J 1 7 -1X1 O J -IX) 90 1 9 3 J 2J> 1 1 2 J 3 J 3 4 2-2 3 J 1 9 • I J - 0 4 lOJ) E6.9 t U ! 7 J 95 49 t l 3J 3 1 3 4 0 4 « J 3X1 6X1 4 7 2 7 1 4 99 2 4 J U J 1 6 J 174 1 1 1 H 9 1 4 3 3 0 J 16X1 1 6 J 1 4 3 99 22.9 2 0 J 2 1 4 1 7 3 1SJ 1BJ 1 7 3 18.9 2 < J 1 8 J 1 7 J 16.4 99 4 0 3 4 4 J 3 6 7 3 1 1 3 4 J 3 0 1 2S3 3 0 J 5 0 JJ 3 1 2 314 2 9 J 99 79 U J 7X) 7 4 4 7 U J 9 7 4 J 2 6 4 7 J 4 4 4 4 M a t . 3OJ 27X1 23.4 2 0 J 1 8 7 194 14.9 1 6 7 3 0 J 19.4 23J) 16.2 M a x . 2 6 J 34.9 2 7 J 2 0 J 2 1 J 1BJ 1 7 J 1L9 262 23.9 1 9 3 1 7 3 Max-300 3 6 4 4 1 9 3 J J 3 5 J 3O9 2 S J 3 3 J 3O0 3 « J 4 1 4 3 0 0 M j x . 2 6 4 22J 1 0 3 1 1 1 5.7 1 3 J »7 4 J 2 6 4 SX) 7J 6 ^ M««n 11 1 111 1 1 J 104 1 1 J 1 0 7 9 7 U J 1 1 1 1O0 1O9 1 0 J M a n 1 1 4 1 1 J 1 2 4 114 1 3 J 9 J 9 4 1 1 1 1 1 1 1 0 7 1 1 4 1 1 1 Mean 2 2 7 22-4 2 4 4 2 1 J 2 4 7 2OJ 1 9 1 2 3 4 2 4 J 2 0 7 2 2 J 2 1 3 M a n - O J - a i - O S -IX) - 1 7 I J O J - 0 4 OX) - 0 7 - 0 7 -IX) Stdcv 1 9 1 3 2 7 2 J 1 7 2 J 1 3 1 2 3 9 2 1 1 0 I J Std*v 1 3 3 7 3X) 3X) 1 4 3 1 2 7 1 1 4 3 2 4 1 2 1 2 Stdev 5 3 6.1 4 7 4 7 3 7 4 7 11 3 4 6.9" 18 3 4 3 4 S t d * r 3 3 1 5 3 1 2 J 1 9 3 7 3 3 2 4 4 3 2 9 1 1 I J
Table IV. Quantile distributions of major hydrophobic residue usage in
different protein sets
Table VI. Outlier statistics1
Humn D m Y M H EcsH HCMV E1V Vxx Hmn.nx. Hun-gp. Hum. era Ecau. M V 42 64 37 124 117 102 42 203 104 6.1 21J 129 41 124 144) 16.9 214 204 154 42 20J 104 119 23.4 194
MJ^OT hydnjphbbk reridut* (F+l+L
a, 183 164 2O6 242 244 174 144 234 134 1S.9 252 227 10 207 174 210 254 25.1 2O1 11.1 267 14 4 21.1 260 239 .25 237 214 26.1 274 274 244 244 3DJ 204 234 274 742 JO 264 254 743 292 294 274 274 324 227 264 745 742 75 254 282 299 311 314 301 311 337 253 294 302 7J7 50 314 312 32.4 363 344 34J. 302 354 274 334 311 31.4 M-V J5 33.4 327 344 W J 415 3*4 36.9 364 294 344 334 327 59 3*4 342 39.1 434 46.4 417 424 399 314 3<4 407 344 M A X . 414 355 437 154 475 434 424 412. 314 414 434 36.1 M a n 26.4 244 275 29J 303 774 265 314 222 267 2»2 274 Stdrr 44 54 4.1 44 34 55 64 37 44 34 34 34
Table V. Quantile distributions of strong and weak codon type amino acids
in different protein sets
H o C r a Y M E. « * B nb. HCMV EBV Viet Km ax. HHB.HL H a L r a . Ec *•" H s u Dra. YcaK E-coC B Mb. HCMV EBV V M X Horn me Htm. IP-HUB. cm. Ec TT Hmam Dna. Y « M E.cnH • «* HCMV EBV V n . H a l DDC HVB. B>-Hsm. MO. EC > n Mia. 1O3 13 7 4 7 3 7 4 4 5 134 4J 143 10J 113 73 M M . 1 9 124 112 124 192 4 7 14 183 104 1 9 91 114 Mln. - 2 2 4 - 3 1 4 -4O5 -29 4 - 3 2 4 - 1 1 4 - 4 7 -311 - 1 1 9 - 1 7 4 -19 7 -294 4 1 1 1 4 113 8 4 1 1 1 9 3 114 154 3.1 143 111 133 118 41 8.7 133 17 1 1 1 7 195 3 4 14 211 104 74 113 134 4 1 -174 -213 -233 -19J -262 -173 -6.7 -3O4 -119 -164 -164 -20J 4)5 1 4 2 1 1 4 104 15.5 113 117 163 6 4 154 14 1 152 173 45 1 1 4 1 4 8 2 1 4 1 4 4 214 4.1 » 4 271 109 114 153 15J 45 -14 1 -155 -195 -114 -224 -119 -5 4 -29 4 -113 -147. -142 -107. Stn> .10 1 5 3 13 4 1 1 4 172 112 14 1 1 6 5 7 4 16.1 153 16.1 18 4 2 5 1 6 5 1 6 4 13.4 1 9 4 1 4 4 1 6 4 1 9 4 84 110 1 7 4 1 7 4 195 WMfc codoa r^e 10 W3 155 215 164 21 1 » 5 105 28.4 119 133 16.! 163 Stn«l .10 -121 -13.1 -182 - 9 3 -194 -103 - 5 4 -273 - 9 4 -110 -113 -84) 2 3 1 7 4 1 8 4 3 4 5 182 73.1 134 134 31 7 154 164 204 1 8 4 I mim* wi 25 -9.1 - 9 3 - 1 5 2 - 6 J -134 -3.1 - 1 4 -214 - 6 4 - 9 1 - 9 2 - 6 2 rpe «m JO 1 9 4 300 1 6 3 2 1 7 1 8 4 19 1 2 1 4 105 215 U J 19 7 223 •ntao JO 21.7 224 274 214 25.7 164 164 334 115 214 224 21 0 JO -54) - 5 5 -11 4 - 3 3 -104 0 5 14 -217 - 0 5 - 4 7 - 6 4 - 3 4 boKUl ( 75 233 734 193 344) 205 72J 266 133 274 213 213 2 4 1 A«<W>) 50 271 263 215 254 344 263 314 143 317 362 234 257 • 3 b (F+4+K+N+Y) 75 2 4 7 254 294 23J 28.7 194 195 363 214 144 345 231 75 0 2 - 1 2 -8.4 03 -7 1 6 2 84 -184 5 7 O4 - 2 3 01 50 265 243 312 364 324 347 210 374 244 365 273 25.1 •K-N-Y) 50 73 34 - 6 4 33 -5 1 • 3 144 -163 105 7 4 25 2.4 55 304 244 232 273 254 337 37J 154 383 304 363 274 95 383 3CL0 311 274 33f 277 233 38J 36.7 284 217 364 55 103 5.1 - 3 4 1 0 - 1 4 164 174 - 1 3 . 1 17 4 no 34 4J 59 503 344 343 292 284 344 614 144 454 324 307. 752 59 315 344 3 4 5 323 374 29J 254 404 314 304 311 343 59 19 1 104 2 4 8 4 0 2 1 9 4 374 -104 19.1 201 104 7 4 H u . 634 46J 31J 342 244 465 3O3 454 553 319 344 Mu 363 4 1 2 4 1 1 4 0 4 4 5 1 303 254 413 314 312 33.1 404 H n . 28.7 164 134 103 12 232 374 14 191 36.7 124 82. Mao Stdct-304 62 3O 53 164 35 214 34 18 3O 34 11 23 30 4 4 17 11 3J> 6 4 6 4 202 34 21 32 Ken Stdc% 214 5.1 212 44 274 34 210 44 36>1 44 16.9 5 3 164 44 334 39 184 4 7 20 6 53 223 43 21 37 M M Stir. -34 7 6 -5 4 64 -11 33 - 3 2 14 -113 35 14 L2 3J 84 -214 34 0 84 - 3 J 7 7 - 3 . - 3 54 4 9
designated by >• (see Figures 1 and 4 for examples). A quantile distribution Q is said to be a stochastic dilation (more spread) of Q (designated Q : » Q) if Q and Q have about equal means and the plot of Q(x) crosses the plot of (Rx) once from below to above as x traverses its domain. The notion of stochastic dilation provides information about the relative degree of spread comparing the two distributions. Thus, Q ^S> Q entails that the distribution Q has a larger variance than the distribution Q and, more generally, the expectation of any convex function of the variable x is larger for Q than for Q.
Compositional anomalies (outliers)
The usage of a given aa type in a protein sequence of length N is considered anomalously high or low if its number of occurrences is three binomial standard deviations above or below the 0.9 and 0.1 quantile points respectively of an appropriate reference set, the binomial standard deviation being defined as
\J(x*)(l — x*)N where x* is the frequency of the aa type
satisfying Q(x*) = 0.9 or Q(x*) = 0.1 respectively. Amino acid E D K R H L I V M F Y W P G A S T Q N C
Total no. of proteins No. of proteins with outliers
of any kind Percentages
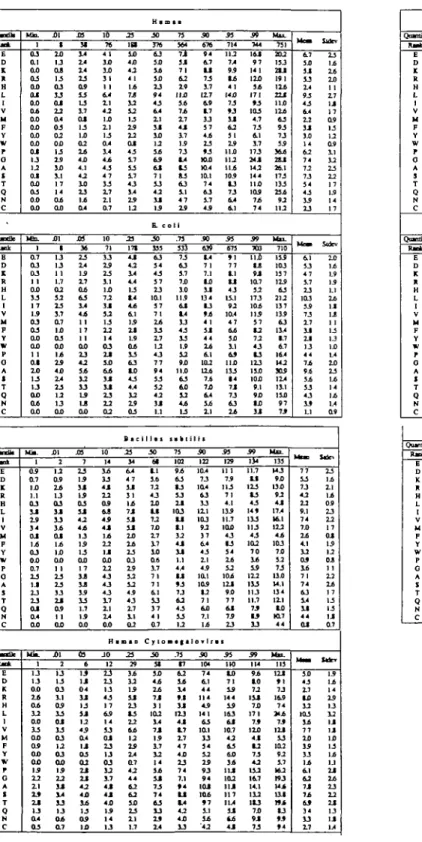
No. of proteins of outlier status human high 20 5 14 5 3 6 2 1 -2 1 2 20 18 6 8 9 11 7 12 751 114 15 low — 1 3 2 -8 2 3 -2 1 -3 1 1 3 2 -4 -.2 Drosophila high low 6 -2 2 2 2 1 1 1 -1 -6 3 -6 2 2 1 1 1 6 4 6 227 45 19.8 yeast high 3 6 2 1 1 -1 -1 -1 -4 1 2 7 4 11 8 1 431 43 low 1 -1 -3 2 2 -1 1 -2 -1 -1 -10.0 E.coli high low 1 1 -1 5 1 1 -4 4 2 2 1 1 2 2 1 2 1 3 710 30 4.7 "For definition see Materials and methods.
Results
Tables I—V display the quantile distributions of individual aa usage, cationic, anionic, and aggregate hydrophobic usage and usage of residues classified by codon type. Sample sizes (number of sequences) for each set in Table I exceed 110, reaching 751 sequences for the human collection and 710 sequences for the
E. coli data; only sequences of at least 200 residues are considered
(see Materials and methods).
Some of the quantile distributional differences reflect on the sample sizes and the codon compositional biases extending from yeast (overall genomic G + C% = 41%), B.subtilis ( = 43%),
E.coli ( = 52%), human ( = 53%) and Drosophila (=55%)
(Cherry, 1991). The human viral genomes of CMV and vaccinia differ sharply in G + C content, 58% and 38% respectively.
Medians and central 80% quantile range
For all categories of aa usage and organism type, the mean and median values are close, generally showing a slightly greater mean. The 0.1—0.9 quantile ranges for most aa types tend to be of similar length across species. The medians of negatively charged residues over most species are about 11.4-12.2%, but the human high extreme levels have substantially higher usage frequencies, 0.99 quantile = 23.0% compared with 16.2% in
E.coli.
Amino acids of most and least frequent usage for various species
The most frequently used aa (in terms of mean and median values) in almost all species is Leu, although in E.coli Ala is a virtual tie. The least frequently used aa is, generally, Trp in the eukaryotic species and in the viruses, and Cys in the prokaryotes,
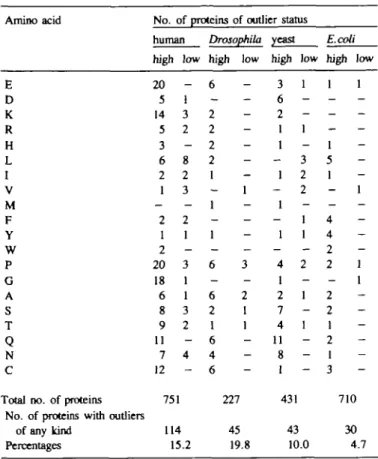
Amino acid usage in protein classes c •H o 0.8 0.6 0.4 0.2 -G, human A, human —•-G, E.coli -B A, E.coli -6 8 10 percent amino acid usage
14
Fig. 1. Glycine and alanine quantile distributions in human and E.coli. Note that stochastic ordering implies nonintersecting distribution functions with the stochastically bigger distribution entirely on the right side.
unicellular species compared with >2% in the higher eukaryotes. Cys usage entails quantile distributions that markedly deviate bet-ween human and Ecoli. Nearly 10% of the E.coli proteins, com-pared with - 5 % of the human proteins, are devoid of Cys residues. At the high extreme, E.coli lacks Cys-rich proteins (99% quantile = 3.8%), whereas the 99% quantile = 7.4% in the human protein collection.
Charged amino acid usages
The 0.1 - 0 . 9 quantile points of negatively and positively charged aa are largely concordant in all the species examined. The extreme values (corresponding to the quantile points 0.01, 0.05, 0.95 and 0.99) show substantial variation between species (especially for unicellular versus multicellular species).
Although the aggregate average positive charge frequency per protein is approximately constant across species, - 1 1 . 5 % , Lys and Arg individually vary substantially. Thus, Arg is less frequent (actually stochastically smaller; Figure 3) in human compared with E.coli proteins. The human nuclear proteins (Tables II and HI), on average, contain relatively more positively charged residues than the overall human protein sequences and 2% more than cationic occurrences in human glycoproteins.
The median and mean uses of acidic residues (D + E) are nearly invariant across species, confined to the range 11.2-13.2%, with Eon average 6.4% and Don average 5.5%. It seems paradoxical that of the quantile charge tables, CMV proteins use on average the fewest acidic residues (9.5%), although CMV incorporates eight ORF sequences containing hyper acidic charge runs (a hyper charge run is an extremely long run including at least nine contiguous residues of the specified charge type, a rare feature of a protein sequence; see S.Karlin and B.E.Blaisdell, manuscript in preparation).
Independent of species, the net charge on average (and in median terms) is slightly negative (see Table HI), with the marked exception of the ORF sequences of the CMV genome. Paren-thetically, CMV has >20 substantial (2:400 residues) ORFs with significantly low positive charge usage. The 0.01 —0.99 range of the total charge quantile distributions (Table HI) expands (apparently not dependent on the numbers of sequences) with the organism complexity: E.coli, 9.0-31%; yeast, 12.6-36.7%;
Drosophila, 11.0-44.2%; human, 11.2-40.3%. It is intriguing
that the total charge, on average, is reduced by > 2 % in CMV proteins (and all human herpes virus ORFs, data not shown) relative to species proteins.
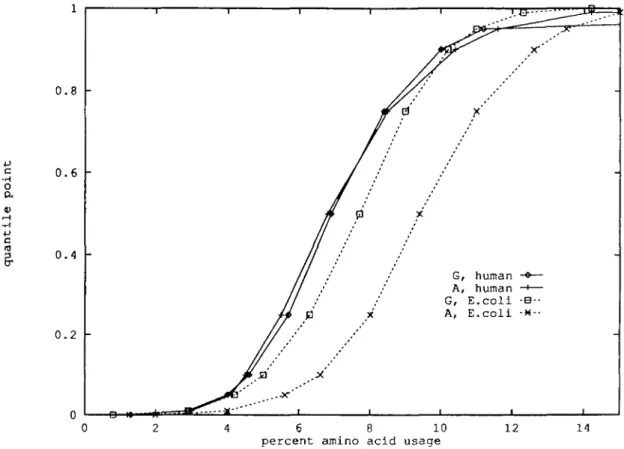
Hydrophobic residue usages
The aggregate of strong hydrophobic aa (Leu, He, Val, Phe, Met) is dominating among the prokaryotic (E.coli, B.subtilis) proteins at every quantile level compared with all the eukaryotic species examined (Figure 2). The viruses (CMV and vaccinia) at the median level show about the same hydrophobic quantile points as the prokaryotic species, but at the high quantile levels hydrophobic residue usage is lower, similar to the eukaryotic sequences. By contrast, the subclass of the human enzyme quantile distribution dominates stochastically the corresponding quantile distribution of the E.coli enzyme set (Table V). The human nuclear protein class has (except at the minimum point) the lowest (subordinating) hydrophobic quantile levels. In particular, the human nuclear proteins are rich in charged and general hydrophilic aa and also proline.
Amino add usages of strong and weak codon types
The strong codon aa group S = (Gly, Ala, Pro) is translated from codon types SSN (S is the nucleotide C or G, N is any
nucleotide) and the weak codon aa group comprises W = (Phe, He, Lys, Asn, Tyr]. The multicellular eukaryotic protein sets favor greater use of 5 aa compared with the (A + T-rich) unicellular yeast and B.subtilis gene sequences. The reverse stochastic ordering holds for W aa types (Table TV).
Comparison of the extremes of the quantile distributions
A varied picture is seen from the tails of the distributions. The human protein sequences are partitioned into proteins that are extremely rich or extremely poor in several residue types. Ten different aa are observed to be absent from at least one human protein, including the relatively abundant residue Thr. Only five aa are absent from one or more E.coli sequences. At the high usage levels, seven aa in human (Leu, Gly, Ala, Pro, Gin, Glu, Lys) reach quantile frequencies >20%. In E.coli, only Leu and Ala surpass this mark.
The percentage of proteins exhibiting quantile distributional outliers, as defined in Materials and methods, varies greatly over species: Drosophila (19.8%) > human (15.2%) > yeast (10.0%)
> E.coli (4.7%). The spectrum of aa giving rise to outliers is strongly species-dependent. Outliers on the high side tend to be hydrophilic and Gly in the eukaryotic species, but hydrophobic in E.coli. Thus, the human set includes 20 proteins with very extreme Glu usage, as compared with only one in E.coli. Generally, the expanse of the tails of the distributions increases with organismal complexity. This trend is reflected in the number of aa in each species, with minima of 0% and maxima >20%:
E.coli, 5:2; yeast 6:5; Drosophila, 7:5; human, 10:7% (Table I). Comparisons of average (or median) amino acid usages for codon degeneracy classes
Degeneracy-1 group. Pervasively, Trp < Met. For the
pro-karyotes (E.coli, B.subtilis), Cys < Trp. Except for the human collection, Cys is the second least frequently used aa.
Degeneracy-2 group. The quantile distributions of the
two-degeneracy (2-codon) aa are in the main congruent across species except for Cys and Lys. The following nearly species invariant median use pattern applies for the two-degeneracy aa: Lys, Glu > Asp > Gin, Asn > Phe, Tyr > His > Cys. For the viruses, the genome compositional biases have some influence.
Degeneracy-4 group. A weak general trend indicates Ala >
Gly > Val > Thr, Pro. Consistent with the weak base genome bias, usage of Ala and Gly is low in yeast and very low in vaccinia. Pro has low usage in prokaryotes and comparatively high usage in human nuclear proteins. The use of Pro in humans is high compared with that in E.coli. This probably reflects the higher average G + C content of human genes and the profusion of collagen-like and other extra-cellular proteins.
Degeneracy-6 group. The general trend entails Leu > Ser >
Arg. Deviations from this pattern occur for the nuclear proteins where Ser > Leu.
Stochastic orderings within and between species
Glu > Asp (i.e. Glu usage is stochastically larger than Asp usage, see Materials and methods) for most protein data sets. Lys > Arg in yeast and vaccinia consonant with their weak base-rich genomes. In most data sets there is no consistent stochastic ordering pattern between Lys and Arg.
The stochastic ordering Phe > Tyr (exception vaccinia) holds for most organisms examined despite the fact that Dayhoff et al. (1978) rank Phe and Tyr the highest in aa exchange ratio.
For every quantile level the percent use of hydrophobics entails the stochastic ordering (E.coli, B.subtilis) > yeast >- human
>• Drosophila (see Figure 2 and Table IV).
The quantile distributions of acidic versus basic residues (Table
C O a, 0.8 0.6 0.4 0.2
F+I+L+M+V, human -e— F+I+L+M+V, E.coli -*-•
.x
15 20 25 30 percent amino acid usage
35 -15
Amino acid usage in protein classes
HI, Figure 4) for the human nuclear protein set cross at least Discussion
twice indicating no distinctive preferences in usages, although Invariants, contrasts and conundrums
total charge in nuclear proteins is relatively high compared with Various questions are raised by the data. How is aa usage affected
glycoproteins. by protein structure and genomic organization, aa biosynthesis,
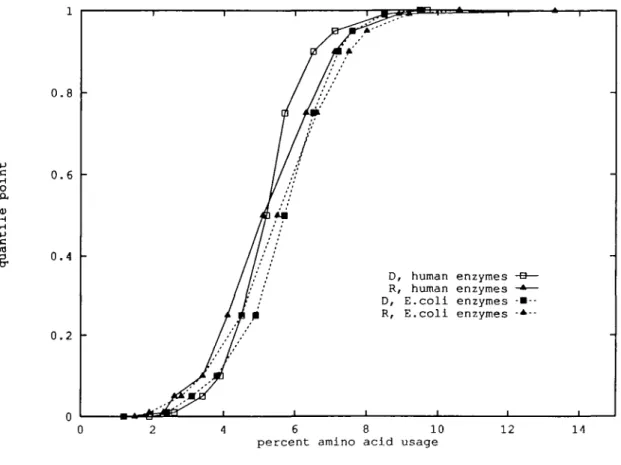
o a 0.8 0.6 0.4 0.2 -D, human enzymes R, human enzymes D, E.coli enzymes R, E.coli enzymes 4 6 8 10 percent amino acid usage
12 14
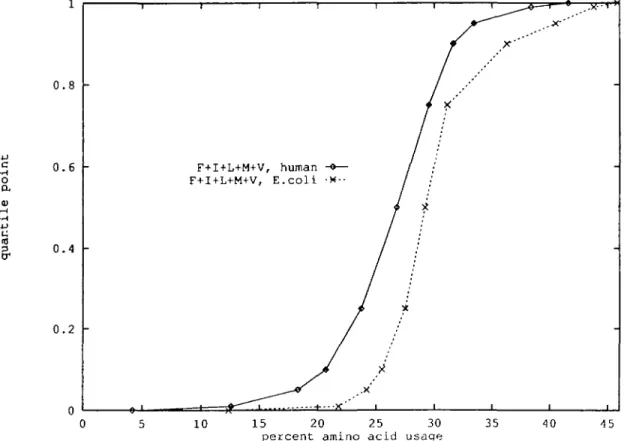
Fig. 3. Argininc and aspartate quantile distribution plots for human and E.coU enzyme sequences.
4J c o a, 0.8 0.6 0.4 0.2
D+E, human nuclear proteins K+R, human nuclear proteins
10 15 20 percent amino acid usage
25 30