Effects of tectonic structures, salt solution mining, and density-driven
groundwater hydraulics on evaporite dissolution (Switzerland)
Eric Zechner&Markus Konz&Anis Younes&
Peter Huggenberger
Abstract Subsurface dissolution (subrosion) of evaporites such as halite and gypsum can lead to extensive land subsidence. Recent land subsidences have been surveyed at six separate locations in northwestern Switzerland. The diameters of the affected surface areas range from 100 to 1,500 m, and corresponding subsidence rates reached more than 100 mm/year. Based on a geometrical model, three sites could be outlined where land subsidence can likely be attributed to salt solution mining. The effects of increased hydrostatic gradient due to both groundwater withdrawal and fluid density contrasts were evaluated in more detail for the remaining sites with a series of 2D density-coupled solute-transport simulations along an approximately 1,000-m-long and 150-m-deep 2D cross section. Simulation results indicate that the upconing process of saline groundwater into the main aquifer occurs under different distributions of subsurface parameters and hydraulic boundary conditions. For the presented setup, the simulations also revealed that the most sensitive factor for the dissolution rate is the structure or dip of the halite formation, which leads to an increase of dissolution rate with increasing dip. Due to the increased density of the brine, an intrinsic flow dynamic develops which follows the direction of the dip.
Keywords Subrosion . Tectonics . Numerical modeling . Density-driven solute transport . Switzerland
Introduction
Evaporites of gypsum or rock salt are widely seen as the most soluble common rock formation (Martinez et al. 1998). Subsaturated groundwater in contact with evapor-itic rock formations leads to subsurface dissolution or subrosion of evaporites and, consequently, to the develop-ment of karst. Depending on the geological setting such as depth of the karst, and mechanical properties of over-laying sediments, the subrosion may cause widespread land subsidence. Even comparably small subsidence rates can significantly affect sensitive urban infrastructure such as larger buildings, dams, power plants, or traffic lines. Whereas the spatial and temporal evolution of the subsidence is comparably simple to monitor, the detection of single, or even multiple causes are difficult due to the relative inaccessibility of the domain where the relevant subrosion processes take effect.
Johnson (1981,2005) defined four basic requirements for dissolution of salt (NaCl) or gypsum (CaSO4): (1) a deposit of salt or gypsum against which, or through which, water can flow, (2) a supply of water subsaturated with respect to NaCl or CaSO4, (3) an outlet where the resulting brine can escape, and (4) energy provided from hydrostatic head differences and/or density gradients, which causes groundwaterflow through the system. These requirements can be met in natural hydrogeological settings, where dissolution of evaporites starts after hydraulic boundary conditions provide a sufficient hydraulic gradient (e.g. Anderson and Kirkland 1980; Cooper 2002). Unlike carbonates, the solubility of evaporites enables karstification to proceed in a matter of days, weeks or years, and catastrophic collapse can result (Martinez et al.1998).
Any combination of the four requirements can be induced and/or influenced by human activities. They include salt solution mining, where the mineral halite is dissolved by injection of water into the formation, subsequently withdrawn as brine, and extracted by evaporation (Johnson 2005; Cooper 2002). Salt mining by means of underground excavation often requires a Received: 10 February 2010 / Accepted: 27 June 2011
Published online: 10 August 2011 * Springer-Verlag 2011
E. Zechner ())
:
M. Konz:
P. Huggenberger Institute of Geology and Paleontology, Environmental Sciences Department, University of Basel,Bernoullistr. 32, 4056, Basel, Switzerland e-mail: [email protected]
M. Konz
Risk Management Service,
Stampfenbachstr. 85, 8021, Zurich, Switzerland A. Younes
Laboratoire d’Hydrologie et de Géochimie de Strasbourg, University of Strasbourg,
lowering of the piezometric head, which can also result in massive dissolution of salt and cavity enlargement (Lucha et al.2007). Depending on the size and subsurface depth of the cavities, roof failure of the salt caverns may propagate to the surface and lead to widespread land subsidence. Construction of dams, dikes, or tunnels may create additional pathways for groundwater access or brine escapement and typically increases preexisting hydrostatic gradients (e.g. James and Kirkpatrick 1980; Gutiérrez et al. 2003). A secondary effect from the drilling of ground-water or oil wells through an evaporitic formation is the creation of voids along the drilling path, which might create preferential groundwater flow paths and, hence, incite subrosion (Johnson 2005; Martinez et al. 1998). A with-drawal of larger amounts of groundwater leads to increased hydraulic gradients which provide the energy for evaporite dissolution. Resulting land subsidence has been reported in relation to brine extraction directly within the salt formation which led to recharge of subsaturated groundwater (Cooper 2002). A similar effect is possible when large volumes of groundwater are extracted from an aquifer, which is in direct contact with the evaporitic formation by means of a fracture network providing a hydraulic connection between aquifer and evaporites (Hauber1971).
Most of the cited literature discusses a single cause for land subsidences. For the observed widespread land sub-sidences at the studied site in northwestern Switzerland, several causes were considered: (1) natural dissolution of the evaporites of the Middle Muschelkalk (anhydrite and halite), which is related to the tectonic setting of the evaporitic formations within a set of horst and graben structures, (2) salt solution mining, which has been pursued at different locations over the last 150 years, (3) large-scale extraction of groundwater in an overlyingfissured aquifer with hydro-static connection to the underlying evaporites along normal fault zones with increased hydraulic conductivity.
In order to evaluate the relevance of the possible causes for land subsidence, an approach based on observations, models, and inferred results related to tectonic setting, solution mining and groundwater hydraulics is presented in this study. First, an existing three-dimensional geological model of 47 faults and 4 faulted horizons of the main aquifers-aquitards (Spottke et al.2005) provided a basis for comparison with geodetic survey data. In a second step, survey data displaying land subsidence were compared to the locations of all the solution mining wells which had been used over the last 150 years. Surface depression cones based on an empirical relationship between formation depth and cone radius were estimated for each solution mining well. The described approach allowed for delineation of areas where land subsidence can clearly be attributed to the salt-solution-mining fields. Third, a 3D regional numerical groundwater model of constantfluid density (Spottke et al. 2005) was used to delineate areas with increased hydrostatic gradients and, therefore, possibly triggering subrosion. Both the geological and the groundwater model were used to define boundary conditions for an approximately 1,000-m-long and 150-m-deep 2D cross section, where a series of 2D density-coupled solute-transport simulations were
con-ducted. The size and complexity of the density-flow problem required the application of codes which had been recently tested on benchmark data of laboratory experiment, and which were set up to simulate the geological conditions found at the site (Konz et al.2008,2009a,b; Younes et al. 2009). The 2Dfield-scale density-flow simulations allowed for evaluating both the effect of the anthropogenic ground-water withdrawal and the dip of the halite formation on salt dissolution rate.
Tectonic setting
The Muttenz-Pratteln area in northwestern Switzerland is situated to the east of the southeastern border of the Upper Rhine Graben and is part of the Tabular Jura (Fig.1). The study area is underlain by Triassic and Jurassic strata, which slightly dip to the southeast. The lithostratigraphic column of the bedrock extends from the Middle Jurassic to the Lower Muschelkalk and, after including the Quaternary cover, is divided into four main hydrostratigraphic layers according to their hydraulic properties (Fig.2). The Lower Muschelkalk and the evaporites of the Middle Muschelkalk are considered as impermeable throughout northern and northwestern Switzerland (Gürler et al.1987). They form a lower aquitard which serves as a confining unit for the overlying aquifer. Within the Middle Muschelkalk, a gypsum karst unit, approximately 10 m thick, has been observed in two boreholes between the top of the salt layer and the anhydrite of the“Sulfatzone”. The amount of groundwater stored in this unit is negligible on the scale of this study (Gürler et al. 1987); nevertheless, it transports groundwater that leaches the underlying halite (the“lower aquifer” in this study). The “Dolomitzone” of the Middle Muschelkalk, and the Upper Muschelkalk, form the“upper aquifer”. Both units are highly porous and fractured. An average hydraulic conductivity of 1.3 × 10⁻⁴m/s (Saladin2004, from borehole tests) and unit thicknesses of 50–80 m result in transmissivities of up to 1 × 10⁻¹m2/s, thus making the unit a regionally important aquifer. The overlaying sediments of Keuper, Lias and Lower Dogger mainly consist of marls and clays and were defined as the upper aquitard due to their low to very low permeabilities. The shallow aquifer of the study site is located in the Quaternary Rhine gravels. Fracture zones causing increased permeability within the Jurassic and Triassic formations may favor vertical exchange of ground-water also across aquitards. Gürler et al. (1987) pointed out that intensively faulted and fractured zones mostly favor water circulation, which according to Hauber (1971) leads to a gradual natural dissolution of the salt layer. At the regional scale (several km), the connectivity of aquifers and aquitards is primarily influenced by the tectonic setting of horst and graben structures. The general dip of the Mesozoic strata to the SE results in direct contact between the Quaternary aquifer and the upper (Muschelkalk) aquifer, mainly in the northwestern part of the model area. The graben structures produce different connectivity scenarios—they either com-pletely or partly penetrate the aquifer, depending on the offset along the bounding normal faults.
The 3D geological model of the area is based on digital elevation models (DEM), borehole descriptions (GEODATA 2010), geological maps and geological cross-sections. The model is consistent with the kinematic evolution of the southeastern border of the Rhinegraben during the Tertiary and has been described in detail in Spottke et al. (2005). The model includes 47 faults and 4 faulted horizons in order to derive structural maps of the main aquifer-aquitard boundaries for groundwater modeling. An approximately 1,000-m-long and 150-m-deep 2D cross section was extracted from the 3D model to reproduce accurate hydrogeological boundary con-ditions for a series of 2D density-coupled solute-transport simulations (see the following sectionGroundwater hydraulics).
Spatial and temporal evolution of land subsidence
Recent land subsidences have been observed at six separate locations in the study area in northwestern Switzerland (Allia V, Noher HP, Geotechnisches Institut AG Basel, Forschungsprojekt Subrosion, Auswertung Nivellement [Research project subrosion, analysis level-ing], unpublished report, 2007): Margelacker, Lachmatt, Schweizerhalle, Ättigraben, Wartenberg and Zinggibrunn-Sulz (Fig. 1). The temporal evolution of the land
subsidence relies on survey data which have been collected over 100 years within the affected area. More than 700 leveling points with different temporal resolu-tions, ranging from less than 1 year to 4 years time intervals between measurements, are used for the interpolation of the subsidence rate. From the begin-ning of the surveys around 1900, until the 1970s, however, only areas which were around locations of solution mining wells were surveyed (Schweizerhalle, Ättigraben, Wartenberg and Zinggibrunn-Sulz). After 1975, two additional areas of subsidence with appa-rently no relationship to solution mining were surveyed (Margelacker and Lachmatt). Highest rates of up to 100 mm/year which were observed during the last 10 years at the Lachmatt site have affected railway tracks for high-speed trains which are part of the main North-South connection through Switzerland.
The actual diameters of the affected areas range from 100– 200 m (Lachmatt) to 1,500 m (Margelacker, Ättigraben). The present shapes of the land subsidence cones are“isotropic”, i.e. more or less circular (outer part of Margelacker, Wartenberg, Zinggibrunn-Sulz) or elongated (inner part of Margelacker, Schweizerhalle, Ättigraben, Lachmatt), with a SSW–NNE-oriented elongation axis with exception of Ättigraben, which is E–W oriented (Fig.1).
Margelacker Zinggibrunn-Sulz Wartenberg Lachmatt Ättigraben Schweizerhalle 0 -1 1 -2 -3 -4 0 -8 -1 0 0 0 0 -3 -4 0 0 0 0 -2 -4 -12 -12 -5 -2 -12 -120 -50 -10 -120 -10 0 1500 3000 Meter
Interpolation of subsidence rates [mm/y]
Normal fault Geodetic survey location
LEGEND -2 Riv er Rhine Switzerland France Germany Italy Austria Subsidence areas N
Fig. 1 Map of the Muttenz-Pratteln study area. Interpolation of subsidence rates between 1975–2000 (averaged over 25 years), with focus on subsidence areas at Lachmatt (lower left) and Schweizerhalle (lower right)
Solution mining
Salt solution mining started around 1850, but the resulting subsidence was only monitored after 1900. During the last 25 years of the twentieth century a total of six locations have been monitored for subsidence, but only four of them coincide with active (Ättigraben, Wartenberg and Zinggi-brunn-Sulz), or former (Schweizerhalle) solution mining fields (Fig. 1). The subsidence rates are lowest in the activefields with typically less than 5 mm/year. Slightly higher subsidence rates (up to 10 mm/year) are observed about 2 km west in the Margelacker area, where the center of the depression cone shows a SSW– NNE-elongated axis. Highest subsidence rates of more than 100 mm/year are monitored in the Lachmatt, which lies between former and active solution mining fields, and forms a smaller, but steeper SSW–NNE-elongated depression cone.
In order to single out solution mining causing subsidence, the need arises for a quantitative relationship between locations of former or active production well, mining depth and hazard surface area. Johnson (1981, 2005) shows conceptual models where the affected surface area more or less corresponds to the area of the roof of excavated salt. Cooper (2002) suggests that the size of an area susceptible to subsidence around a solution mining borehole appears to relate to the depth and amount of excavated salt. Sroka and Schober (1982) and Wassmann (1979), however, describe a model where the collapsed roof top of an excavated salt cavern propagates with the shape of a reversed cone with a 45° angle to the surface and, hence, leads with increasing depth of excavation to a proportionally larger surface area affected by subsidence. A database (GEODATA 2010) including location and excavation depth of all former and presently active solution mining wells offered the possibility to calculate the resulting circular hazard area for subsidence related to salt mining.
For most of the mining fields (Ättigraben, Wartenberg, Zinggibrunn-Sulz), the combined area of the circles corre-sponds to the observed area of subsidence (Fig. 3). The Margelacker, but also the Lachmatt subsidence sites, are both outside of the predicted hazard area. At the Schwei-zerhallefield, the monitored subsidence area is clearly larger than the predicted hazard area. Mining at the Schweizerhalle site had been stopped for more than 100 years; therefore, suggesting (like at the Margelacker and Lachmatt sites) a different cause than solution mining for the observed land subsidence. In addition, the SSW–NNE-oriented elongation axis of subsidence areas at Margelacker, Lachmatt and Schweizerhalle corresponds to the strike of the horst and graben structures, therefore, indicating that the elongated shape of depression is likely related to the tectonic setting.
Groundwater hydraulics
Simulation of groundwater flow requires an appropriate transfer of the 3D horizons and faults from the geological model into discrete elements with distributed hydraulic conductivity and storage capacity. The single-continuum approach as used in the present study is considered to be appropriate for the flow simulation in carbonate aquifers of regional scale with comparable small solution cavities and an absence of a well-developed conduit network (Zechner and Frielinsdorf2004).
3D Simulation of regional groundwater hydraulics
The used regional model is based on a 3-layer approach with afinite-difference grid to simulate groundwater flow with constant density and has been presented in Spottke et al. 2005. Model boundary conditions included well data with overall groundwater pumping rates of 2.2 m3/s, and a total artificial recharge reaching more than 1.0 m3/s in the north-western part of the 3D model. Automated calibration resulted in hydraulic conductivities of 7.4E-4 m/s for the upper (Muschelkalk) aquifer. Results demonstrated the effect of the
Aquifer Aquitard Middle Upper Lower TRIASSIC JURASSIC Muschelkalk Keuper Dogger Lias Middle Upper Lower QUATERNARY Aalénien Opalinus-Ton Trigonodusdolomit Hauptmuschelkalk Dolomitzone Sulfatzone Wellengebirge Gipskeuper Gansinger Dolomit Arietenkalk Lettenkohle Schilfsandstein / Untere Bunte Mergel Obere Bunte Mergel Rhät Fluvio-glacial gravels max. 40m 80m -90m max. 325m 70m -160m Salzlager Thickness Formation
System Series Stage Profile
Fig. 2 Lithostratigraphy and hydrostratigraphy (modified from Spottke et al.2005)
large-scale industrial pumping in the central part of the model (up to 1.5 m3/s), where the piezometric head is lowered up to 5 m (Fig. 3). The horizontal groundwater flow field in the upper (Muschelkalk) aquifer is affected at distances up to 2 km to the south. Fractured zones along the graben structures may provide a vertical hydraulic connection to the evaporites of the Middle Muschelkalk. The physical principle of resulting density-coupled flow in a deeper aquifer, which emerges along the fracture zone into a surficial aquifer has been recently investigated with a series of laboratory-scale experiments for benchmarking 2D numerical simulations (Konz et al.2008,2009a,b; Younes et al.2009).
2D Simulation of density effects
Modeling density effects at the presentedfield-scale requires a coupled flow-transport numerical model. To this end, Darcy’s flow equation and the advection dispersion transport equation are coupled with the state equations, linking density and viscosity to mass fraction (Konz et al.2009b). Darcy’s law is assumed to be valid as stated by Watson et al. (2002). At this stage, it is assumed that Fick’s law is valid in order to avoid the use of an additional parameter in contrast to Konz et al. (2009b) and Younes et al. (2009). The authors consider
this assumption valid, because only the relative changes between scenarios are of interest and not the exact description of the plume front. Furthermore, it can be assumed that the effect of non-linear dispersion is minor compared to the parameter uncertainty. Because of the non-linear coupling, codes based on standard numerical schemes require often veryfine spatial and time discretizations and, therefore, a lot of computational time. A numerical code based on mixed finite elements (MFE) for the fluid flow problem and a combination of discontinuous Galerkin (DG) and multi-point flux approximation (MPFA) methods for the transport was used for the simulation (Ackerer and Younes2008). Konz et al. (2009a) compared experimentalflow tank benchmark data with simulation results of the MFE_DG_MPFA method in order to evaluate the reliability and robustness of the numerical scheme. The method turned out to be highly appropriate for simulations in complex geometries.
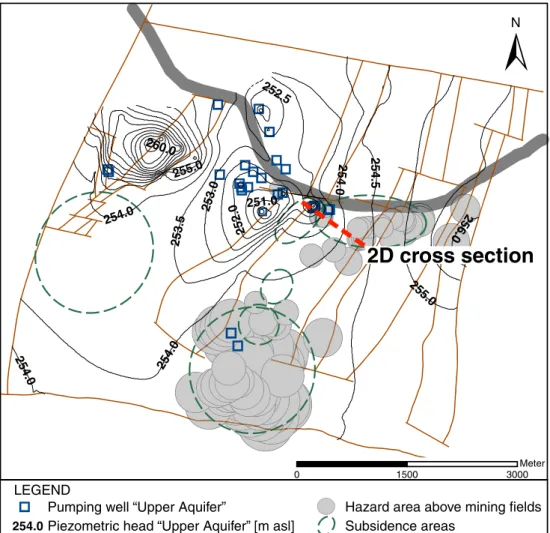
An approximately 1,000-m-long and 150-m-deep 2D field-scale model with hydrogeological boundaries defined by the 3D geological model was used for a series of 2D density-coupled solute-transport simulations (Figs. 3 and 4). The numerical model included 29,044 mixed finite elements, which were meshed to avoid possible numerical instabilities; the largest elements of up to 7-m side length 260.0 256.0 255.0 255.0 254.5 254.0 254.0 254.0 254.0 253.5 253.0 252.0 252.5 251.0
2D cross section
0 1500 3000 Meter Subsidence areas Piezometric head “Upper Aquifer” [m asl]254.0
Hazard area above mining fields Pumping well “Upper Aquifer”
LEGEND
N
Fig. 3 Study area map, showing: subsidence areas, modeled (shaded) circular subsidence hazard areas above each former and actual solution mining well depending on cavity depth, simulated piezometric head within the upper aquifer, and location of 2D cross section for density-coupled transport model
were mainly located in the upper aquifer, whereas elements in the fault zones and the lower aquifer had typical lengths of less than 1 m. It was further assumed that pre-existing fault zones at the WNW and ESE end of the cross-section, and the previously described gypsum karst unit (i.e. the lower aquifer), were both 10 m wide (Fig.4). The geometry of the upper aquifer is based on the 3D geological model as described above. Hydraulic properties of the upper aquifer were constrained to afixed value due to earlier studies (Spottke et al. 2005). Hydraulic conductivities and effective porosities of the fault zones and the gypsum lower aquifer were varied between 1E-6 and 7.4E-4 m/s, and 0.001 and 0.1, respectively, depending on the model scenario (Table 1). Global longitudinal dispersivities were set to 10 m, and global transverse dispersivities to 1 m. Previous simula-tions of data from laboratory tank experiments have shown comparably small sensitivities of dispersivity values to simulated concentrations (Konz et al. 2009a, b). Because the upper aquifer is below an aquitard in the ESE part the upper aquifer, groundwater recharge through precipitation would be only possible through the unsatu-rated zone in the WNW part of the section. However, this section corresponds to a paved and drained industrial site leading to a negligible amount of recharge, which was not accounted for in the simulations. Hydraulic boundary conditions were assigned according to the regional 3D
groundwater-flow model: a prescribed constant head of 254.5 m was imposed on the ESE boundary (Fig. 4). Anthropogenic groundwater withdrawal of a wellfield at the WNW end of the 2D cross section was simulated with a location corresponding to the pumping well with the largest withdrawal (up to 0.15 m3/s). The pumping well was simulated with an evenly distributed constant flux along the corresponding verticalfilter length and fitted to a piezometric head of 251.0 m as observed in 3D simulation of regional groundwater hydraulics (Figs. 3 and 4). Following the Hydrocoin test case (OECD 1988), which implemented a set of groundwater model-ing tests involvmodel-ing density gradients, a constant con-centration boundary condition with a density of 1,200 kg/m3 was applied at the lower model boundary and assumed a no-flow boundary (Fig. 4). Thus, salt can enter the domain only via diffusion, with what is considered to be a reliable approximation of the dilution kinetics of solid rock salt. With this lower boundary condition at the top of the salt layer it was assumed that salt dissolution was instantaneous compared to the simulated time span of 30 years due to the very high dissolution rate of halite in contact with subsaturated water (e.g. Alkattan et al. 1997). Initial conditions for both piezometric head and concentration were set to 0 for the model domain. A total of 15 scenarios with varying hydraulic conductivities and porosities were
CH=254.5 m (Scenarios “outflow”: CH=254.5m) CH=251.0 m CC=1200 kg/m3 Upper Aquifer
Lower Aquifer Fault zone
Fault zone Aquifer Aquitard/Unsaturated Ele v ation [m asl] 0 500 Distance [m] 1000 100 200 300 Pumping well WNW ESE
Fig. 4 2D cross-section with hydrostratigraphic model for the simulation of density-coupledflow and transport. Used boundary conditions are“constant head” (CH; narrow dashed line) to simulate pumping at the well, inflow from the ESE, and outflow at the bottom towards the ESE. Boundary conditions of“constant concentration” (CC; wide dashed line) simulate solute flux into the bottom of the lower aquifer
Table 1 Definitions of the 15 scenarios used for the 2D density-coupled transport modeling. Variations are concerning pumping activity, possibility of brine outflow on the bottom of the lower aquifer, and effective porosity η and hydraulic conductivity K in both the upper aquifer (Upper Aq.) and the lower aquifer (Lower Aq.)bordering fault zone
Scenario names Pumping? Outflow? K Upper Aq. η Upper Aq. K Lower Aq. + fault zones η Lower Aq. + fault zones
S_standard1 Yes No 7.4E-4 0.03 1.0E-6 0.01
S_standard2 Yes No 7.4E-4 0.03 7.4E-4 0.01
S_standard3 Yes No 7.4E-4 0.03 1.0E-6 0.1
S_standard4 Yes No 7.4E-4 0.03 7.4E-4 0.1
S_standard5 Yes No 7.4E-4 0.03 7.4E-4 0.001
S_no_pump1 No No 7.4E-4 0.03 1.0E-6 0.01
S_no_pump2 No No 7.4E-4 0.03 7.4E-4 0.01
S_no_pump3 No No 7.4E-4 0.03 1.0E-6 0.1
S_no_pump4 No No 7.4E-4 0.03 7.4E-4 0.1
S_no_pump5 No No 7.4E-4 0.03 7.4E-4 0.001
S_outflow1 Yes Yes 7.4E-4 0.03 1.0E-6 0.01
S_outflow2 Yes Yes 7.4E-4 0.03 7.4E-4 0.01
S_outflow3 Yes Yes 7.4E-4 0.03 1.0E-6 0.1
S_outflow4 Yes Yes 7.4E-4 0.03 7.4E-4 0.1
S_outflow5 Yes Yes 7.4E-4 0.03 7.4E-4 0.001
conducted with three main differences: (1) with pumping well, (2) without pumping well, and (3) with an outflow on the lower ESE boundary assuming a continuation of the lower aquifer using a fixed piezometric head of 254.5 m (Fig. 4). This outflow simulates a possible drainage or recharge of the lower aquifer along the bordering fault zone perpendicular to the 2D cross section.
Simulation results revealed that the piezometric head that was assigned in the upper aquifer for the ESE boundary and the well is basically not influenced by denser salt water due to the comparably low salt concentration in the upper aquifer. The exception is the “outflow” boundary condition in the ESE border of the lower aquifer, which is used for five scenarios: the imposed 254.5 m head could theoretically lead to inflow or outflow, depending on the corresponding piezometric head in the lower aquifer close to the boundary condition. Thisfits with the concept of the field site, where a possible hydraulic connection is considered possible but the direction offlow is unknown. In the simulations, however, all five “outflow” scenarios led to an outflow at the ESE border of the lower aquifer (see Resultssection).
Results
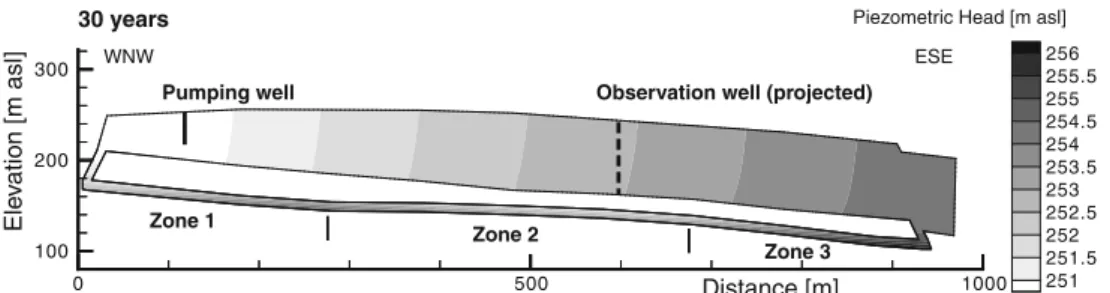
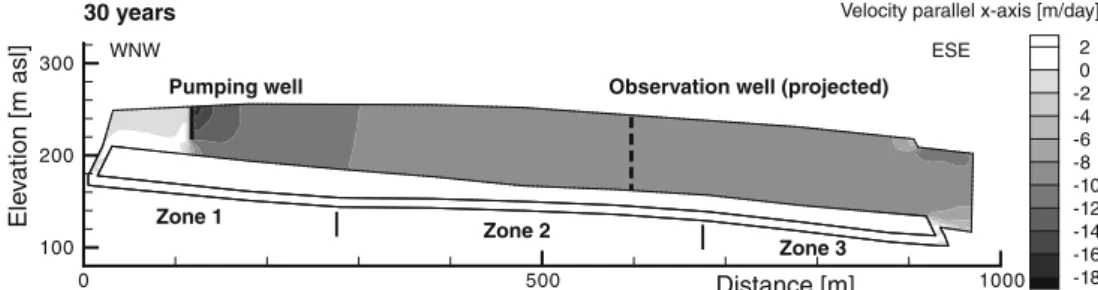
The simulated piezometric head distribution in all 15 simulations was mainly defined by the imposed piezo-metric head at the ESE boundary, which lead to a flow direction from ESE to WNW in the upper aquifer (Fig.5). The addition of a pumping well close to the WNW boundary of the upper aquifer influenced only the flow field in the WNW part of the upper aquifer (Fig. 6). Plotted flow velocities in the x-direction of the 2D cross section show that velocities increase from ESE towards the well. In between the impervious WNW-boundary and the well, however, flow velocities are comparably small: they point towards the well in the lower part of the upper aquifer and in the opposite direction in the upper part of the upper aquifer, suggesting a slow anti-clockwise circular flow which increases upwelling of dissolved salt along the WNW fault zone (Fig.7). Density effects in the lower aquifer, however, lead to a flux influenced by gravity down the dip of the formations towards the ESE for all scenarios as indicated by positive flow velocity values in the x-direction (Fig. 6). This means also that regardless of any pumping activity in the upper aquifer, flow direction in the lower aquifer is mainly controlled by
gravitation of the denser salt water. A quasi steady-state of piezometric head and salt concentration distribution in the upper aquifer was reached between approximately 0.2 and 3 years of simulation, depending on the scenario (Figs.7, 8,9,10,11,12,13,14). Time differences were mainly due to the effective porosityη and hydraulic conductivity K in the lower aquifer and the fault zones. Lower K combined with higherη increased time until steady state was reached as shown with simulated salt-concentration distribution after 3 years in Scenario S_outflow3 (Fig. 14). Higher K combined with lower η, however, led to earlier steady-state conditions at 0.2 years in Scenario S_nopump5 (Fig.12). The simulated concentration distribution in the upper aquifer was, to some extent, sensitive to the scenario. However, an upconing of saline groundwater from the lower aquifer combined with some density stratification in the upper aquifer was observed in all 15 scenarios. This is exemplified in scenario 1 with the pumping well, which led to a salt concentration gradient similar to the observed concentrations in a well about 1,000 m SSW of the 2D cross section (Fig. 15). The vertical solute gradient at both the projected location in the 2D cross section and the observation well are comparable, i.e. from 0.2 to 1.2 g/l NaCl in scenario S_standard1 (Figs. 9 and 10), and from 0.05 to 0.45 g/l chloride in the observation well.
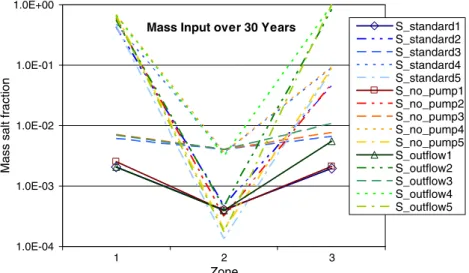
Furthermore, simulated salt mass inputs shown as normalized mass salt fractions along the lower model boundary were investigated. The mass fractions are considered to represent dissolution rates, at least in terms of dissolution dynamics. Mass fractions of all 15 density-coupled transport simulation scenarios were integrated over three zones with zone 1 representing a steeper dip of 5° on average in the WNW part, zone 2 corresponding to an average dip of 2° in the central model part, and zone 3 integrating mass inputs along the steepest dip of 6° in the ESE part of the model (Figs.5,6,7,8,9,10,11,12,13, 14). The most significant conclusion out of all the simulations is that even a comparably large pumping activity in the upper aquifer is not a relevant driving force for salt-mass input, and, therefore, subrosion. This is illustrated with the mass fractions of the scenarios without a pumping well (Fig.16; S_nopump*); they do not differ significantly from the scenarios including a pumping well (S_standard*; S_outflow*). A driving variable for subrosion is the distribution of hydraulic properties: higher hydraulic conductivities paired with
Piezometric Head [m asl] 256 255.5 255 254.5 254 253.5 253 252.5 252 251.5 251 Ele v a tion [m asl] 0 500 Distance [m] 1000 100 200 300 Pumping well Zone 1 Zone 2 Zone 3 Observation well (projected)
WNW ESE
30 years
Fig. 5 Simulated piezometric head distribution from density-coupled model after 30 years, and location of zones 1–3 for integration of mass input (Scenario S_standard1; see Table1)
2 0 -2 -4 -6 -8 -10 -12 -14 -16 -18 Velocity parallel x-axis [m/day]
Ele v a tion [m asl] 0 500 Distance [m] 1000 100 200 300 Pumping well Zone 1 Zone 2 Zone 3 Observation well (projected)
WNW ESE
30 years
Fig. 6 Simulated x-component of velocity from 2D density-coupled model after 30 years (Scenario S_standard1; see Table1)
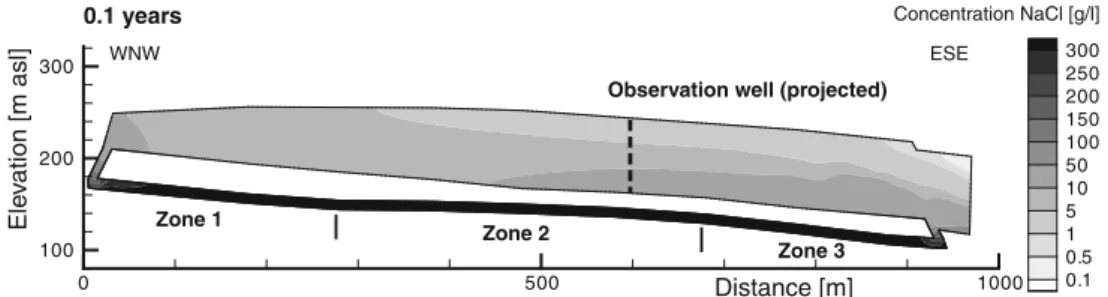
Ele v ation [m asl] 0 500 Distance [m] 1000 100 200 300 Pumping well Zone 1 Zone 2 Zone 3 Observation well (projected)
WNW ESE Concentration NaCl [g/l] 300 250 200 150 100 50 10 5 1 0.5 0.1 0.1 years
Fig. 7 Simulated NaCl concentration distribution from density-coupled model after 0.1 years (Scenario S_standard1; see Table1)
Ele v ation [m asl] 0 500 Distance [m] 1000 100 200 300 Pumping well Zone 1 Zone 2 Zone 3 Observation well (projected)
WNW ESE Concentration NaCl [g/l] 300 250 200 150 100 50 10 5 1 0.5 0.1 0.1 years
Fig. 8 Simulated NaCl concentration distribution from density-coupled model after 1 year (Scenario S_standard1; see Table1)
Ele v ation [m asl] 0 500 Distance [m] 1000 100 200 300 Pumping well Zone 1 Zone 2 Zone 3 Observation well (projected)
WNW ESE Concentration NaCl [g/l] 300 250 200 150 100 50 10 5 1 0.5 0.1 2 years
Fig. 9 Simulated NaCl concentration distribution from density-coupled model reaching quasi steady-state after 2 years (Scenario S_standard1; see Table1)
Concentration NaCl [g/l] 300 250 200 150 100 50 10 5 1 0.5 0.1 Ele v ation [m asl] 0 500 Distance [m] 1000 100 200 300 Pumping well Zone 1 Zone 2 Zone 3 Observation well (projected)
WNW ESE
30 years
Fig. 10 Simulated NaCl concentration distribution from density-coupled model after 30 years (Scenario S_standard1; see Table1) 1330
Ele v ation [m asl] 0 500 Distance [m] 1000 100 200 300 Zone 1 Zone 2 Zone 3 Observation well (projected)
WNW ESE Concentration NaCl [g/l] 300 250 200 150 100 50 10 5 1 0.5 0.1 0.1 years
Fig. 11 Simulated NaCl concentration distribution from density-coupled model after 0.1 years (Scenario S_nopump5; see Table1)
Ele v ation [m asl] 0 500 Distance [m] 1000 100 200 300 Zone 1 Zone 2 Zone 3 Observation well (projected)
WNW ESE Concentration NaCl [g/l] 300 250 200 150 100 50 10 5 1 0.5 0.1 0.2 years
Fig. 12 Simulated NaCl concentration distribution from density-coupled model reaching quasi steady-state after 0.2 years (Scenario S_nopump5; see Table1)
Ele v ation [m asl] 0 500 Distance [m] 1000 100 200 300 Pumping well Zone 1 Zone 2 Zone 3 Observation well (projected)
WNW ESE Concentration NaCl [g/l] 300 250 200 150 100 50 10 5 1 0.5 0.1 0.1 years
Fig. 13 Simulated NaCl concentration distribution from density-coupled model after 0.1 years (Scenario S_outflow3; see Table1)
Ele v ation [m asl] 0 500 Distance [m] 1000 100 200 300 Pumping well Zone 1 Zone 2 Zone 3 Observation well (projected)
WNW ESE Concentration NaCl [g/l] 300 250 200 150 100 50 10 5 1 0.5 0.1 3 years
Fig. 14 Simulated NaCl concentration distribution from density-coupled model reaching quasi steady-state after 3 years (Scenario S_outflow3; see Table1)
lower porosities led to higher flow velocities which increase the concentration gradient in the lower aquifer and favor salt mass input along the bottom boundary condition (scenarios with ending number “5”). The addition of the outflow boundary increases the mass fraction solely in zone 3, which is closest to the boundary condition at the lower end of the lower aquifer (S_outflow*). The most important contributor to subrosion within the investigated setup, however, is the formational dip of the salt layer. Steeper gradients such as represented in zones 1 and 3 apparently lead to an increase of salt dissolution up to 4 magnitudes for the scenarios with the highest flow velocities in the lower aquifer. This suggests that structural dip affecting density-driven transport plays an important role in providing the necessary hydraulic energy to support the process of salt subrosion. The results of the 2D simulations of density effects coincide to some extent with the field observation:
1. Areas in the upper aquifer with larger piezometric drawdown due to pumping as shown partly in the
central part, or larger increase due to artificial recharge like in the northwestern part, are not subject to subsidence (Fig.3). The WNW part of the 2D section, however, crosses an area with increased drawdown due to pumping and is subject to subsidence not due to solution mining.
2. The WNW part of the 2D section (Zone 1) shows an increased structural dip at the bottom of the lower aquifer, which causes increased density-driven flow and, consequently, salt dissolution. Zone 1 coincides with increased observed subsidence rate of up to 10 mm/year at the surface (Fig.1).
3. The ESE part of the 2D section (Zone 3), which also matches an increased structural dip, is located under an area of lower subsidence likely due to solution mining (less than 2 mm/year). This only supports the fact that interpretation of the complex causes of the observed land subsidences needs a careful and adequate approach, which accounts for the spatial and temporal complexity in thefield.
Conclusions
For the observed widespread land subsidences in the Muttenz-Pratteln area, three causes were evaluated: (1) natural dissolution of the evaporites of the Middle Muschelkalk related to the tectonic setting of horst and graben structures, (2) salt solution mining, which has been pursued at different locations starting 150 years ago, and (3) large-scale extraction of groundwater in the upper (Muschelkalk) aquifer coupled with density-driven salt brineflow at the interface of the halite and anhydrite about 50 m below the aquifer.
Recent land subsidences have been observed at six separate locations within the study area. The diameters of the affected surface areas range from 100 to 1,500 m. The Observation Well
Upper Muschelkalk Aquifer
160 170 180 190 200 210 220 230 240 0 0.1 0.2 0.3 0.4 0.5 0.6 Chloride concentration [g/l] Elevation [m asl] 13. Jun 06 12. Jul 06 14. Aug 06 05. Sep 06 26. Okt 06 27. Nov 06 18. Dec 06 31. Jan 07 22. Feb 07 21. Mar 07 17. Apr 07 10. May 07
Fig. 15 Observed chloride concentration in observation well located about 1,000 m SSW of the 2D cross section
Mass Input over 30 Years
1.0E-04 1.0E-03 1.0E-02 1.0E-01 1.0E+00 1 2 3 Zone
Mass salt fraction
S_standard1 S_standard2 S_standard3 S_standard4 S_standard5 S_no_pump1 S_no_pump2 S_no_pump3 S_no_pump4 S_no_pump5 S_outflow1 S_outflow2 S_outflow3 S_outflow4 S_outflow5
Fig. 16 Comparison of normalized mass salt fractions within a zone over 30 years from the 15 density-coupled transport simulations (S_standard*=with pumping well, S_no_pump*=without pumping well, S_outflow=with pumping well, and with outflow boundary condition at the lower aquifer towards the ESE)
corresponding subsidence rates reach up to more than 100 mm/year. The shapes of the depression cones are either more or less circular, or elongated along a SSW– NNE-oriented axis. This elongation axis corresponds to the striking of the horst and graben structures and, therefore, indicates that the elongated shape of the depression is strongly related to the tectonic setting. The predicted area of surface depression cones above each former or recent solution mining well was estimated based on a model concept, where the collapsed roof of excavated salt propagates with a 45° angle to the surface. This approach allowed for the delineation of three sites where land subsidence can clearly be attributed to the salt solution mining fields. One site, where solution mining has stopped more than 100 years ago, shows evidence that the initial cause of subsidence, i.e. solution mining, has been replaced by an additional cause related to ground-water hydraulics. For the remaining sites, the effects of increased hydrostatic gradient due to both groundwater withdrawal andfluid density contrasts were evaluated with a series of 2D density-coupled solute-transport simulations along an approximately 1,000-m-long and 150-m-deep 2D cross section.
Results indicate that the upconing process of saline groundwater from the deeper aquifer above the halite formation to the upper aquifer occurs under different sets of subsurface parameter distributions and hydraulic boundary conditions. Steady-state of the concentration distribution in the upper aquifer is reached in most simulations after a relatively short time span of less than 3 years, and increased salinities are affecting most parts of the aquifer. The resulting salinity stratification with increase towards the bottom of the upper aquifer corre-sponds both tofield-observation data and measurements in laboratory-scale flow-tank experiments. The 2D density-driven simulations reveal that the effect of the anthro-pogenic groundwater withdrawal on salt-dissolution rate is significantly lower than expected. Considerably more sensitive to the dissolution rate, however, is the structure or dip of the halite formation. An increase of dissolution rate can be observed with increasing dips. The dissolved salt moves along the dip and initiates a local flow field driven by gravity which is decoupled from the regional hydrostatic gradient. The comparably small dip of less than 5° suggests that density effects, which have not been described in the hereby presented quantitative detail, significantly contribute to subrosion in a large variety of geological settings. Therefore, it is proposed that structural dip is added as an additional basic requirement for subsurface dissolution of evaporites.
However, the presented density-driven simulations along 2D cross sections also present limitations for a general interpretation regarding the causes of some of the observed land subsidences. This is, for one, due to the additional spatial and temporal complexity in the field including highly transient hydraulic boundary conditions, a more complex 3D structure, e.g. of the top of the salt layer, or the exact location and hydraulic properties of the fault zones. Secondly, the assumption of a well-established
10-m-thick homogenous gypsum karst layer (the lower aquifer) does not take into account the initial process of karst evolution. It is, for example, very possible that the pumping activity in the upper aquifer plays a triggering role at the initial stage of the subrosion process with creation of groundwater pathways in the evaporitic rock; whereas, at a later stage, structural dip forms the driving force for subrosion.
Acknowledgements This work has been funded by the“Amt für Umweltschutz und Energie Basel Landschaft”. We would like to thank the United Swiss Salt Works for providing the necessary data on salt production and the solution mining process. Comments by K. Bernet, J. Nunn, S. Hurwitz, I. Lewin and one anonymous reviewer have been very helpful in improving the manuscript.
References
Ackerer P, Younes A (2008) Efficient approximations for the simulation of density drivenflow in porous media. Adv Water Res 31(1):15–27
Alkattan M, Oelkers EH, Dandurand JL, Schott J (1997) Exper-imental studies of halite dissolution kinetics: I. the effects of saturation state and the presence of trace metals. Chem Geol 137:201–220
Anderson RY, Kirkland DW (1980) Dissolution of salt deposits by brine densityflow. Geology 8:66–69
Cooper AH (2002) Halite karst geohazards (natural and man-made) in the United Kingdom. Environ Geol 42:505–512
GEODATA (2010) Digital geological database for the city of Basel and northwestern Switzerland. Geological Survey Basel-Land-schaft and Basel-Stadt, University of Basel, Switzerland Gutiérrez F, Desir G, Gutiérrez M (2003) Causes of the catastrophic
failure of an earth dam built on gypsiferous alluvium and dispersive clays (Altorricón, Huesca Province, NE Spain). Environ Geol 43:842–851
Gürler B, Hauber L, Schwander M (1987) Die Geologie der Umgebung von Basel mit Hinweisen über die Nutzungsmö-glichkeiten der Erdwärme [The geology of the Basel region including directions for the possibilities to use geothermal energy]. Beitrag zur Geologischen Karte der Schweiz. Stämpfli & Cie, Bern, Switzerland
Hauber L (1971) Zur Geologie des Salzfeldes von Schweizerhalle-Zinggibrunn (Kt. Baselland)[On the geology of the salt mining field Schweizerhalle-Zinggibrunn (Canton Baselland)]. Eclogae geol Helv 64(1):163–183
James AN, Kirkpatrick IM (1980) Design of foundations of dams containing soluble rocks and soils. Quart J Eng Geol Hydrogeol 13(3):189–198
Johnson KS (1981) Dissolution of salt on the east flank of the Permian Basin in the southwestern USA. J Hydrol 54:75–93 Johnson KS (2005) Subsidence hazards due to evaporite dissolution
in the United States. Environ Geol 48:395–409
Konz M, Ackerer P, Meier E, Huggenberger P, Zechner E, Gechter D (2008) On the measurement of solute concen-trations in 2-D flow tank experiments. Hydrol Earth Syst Sci 12:727–738
Konz M, Ackerer P, Younes A, Huggenberger P, Zechner E (2009a) Two-dimensional stable-layered laboratory-scale experiments for testing density-coupledflow models. Water Resour Res 45: W02404. doi:10.1029/2008WR007118
Konz M, Younes A, Ackerer P, Fahs M, Huggenberger P, Zechner E (2009b) Variable-densityflow in heterogeneous porous media: laboratory experiments and numerical simulations. J Cont Hydrol 108:168–175. doi:10.1016/j.jconhyd.2009.07.005 Lucha P, Cardona F, Gutierrez F, Guerrero J (2007) Natural and
outcrop of the Cardona Diapir (NE Spain). Environ Geol. doi:10.1007/s00254-007-0729-3
Martinez JD, Johnson KS, Neal JT (1998) Sinkholes in evaporite rocks. Am Sci 86:38–51
OECD (ed) (1988) Hydrocoin Project. The International Hydrocoin Project, level 1: code verification. OECD, Paris
Saladin M (2004) Hydrogeologischer Zusammenhang von Tektonik und Grundwasserzirkulation im Gebiet Muttenz-Pratteln [Hydrogeologic relationship between tectonics and groundwater circulation in the Muttenz-Pratteln area]. Diplomarbeit, Uni-versität Basel, Switzerland
Spottke I, Zechner E, Huggenberger P (2005) The southeast border of the Upper Rhine graben: a 3D structural model of geology and its importance for groundwaterflow. Int J Earth Sci 94:580–593 Sroka A, Schober F (1982) Die Berechnung der maximalen
Bodenbewegungen über kavernenartigen Hohlräumen unter
Berücksichtigung der Hohlraumgeometrie [Calculation of the maximum ground deformation considering the geometry of cavities]. Kali & Steinsalz, Berlin, pp 273–277
Wassmann TH (1979) Mining subsidence in the East Netherlands. Proc Fifth Int Symp on Salt 1:463–475
Watson SJ, Barry DA, Scotting RJ, Hassanizadeh SM (2002) Validation of classical density-dependent theory for stable, high-concentration gradient brine displacements in coarse and medium sand. Adv Water Resour 25:611–635
Younes A, Fahs M, Ahmed S (2009) Solving density drivenflow problems with efficient spatial discretizations and higher-order time integration methods. Adv Water Resour. doi:10.1016/j. advwatres.2008.11.003
Zechner E, Frielinsdorf W (2004) Evaluating the use of data on canal seepage and solute concentration in aquifer parameter estimation. J Hydrol 289:62–77