Journal of Antimicrobial Chemotherapy (1981)8,29-37
Human pharmacokinetics and CSF penetration of clavulanic acid
R. Munch*, R. Lflthy*, J. Blaser*f and W. Siegenthaler*
*Department of Medicine, University of Zurich, f Institute for Biomedical Engineering, University of Zurich and Federal Institute of Technology, CH-8091 Zurich, Switzerland
Clavulanic acid, a product of Streptomyces clavuligerus with /Mactam structure, is a potent inhibitor of several /Mactamases. To study its pharmacokinetic and CSF penetration in patients without meningeal inflammation, a single oral dose of 250 mg of clavulanic acid was given to 21 patients. One patient was studied in a multiple dose schedule. Fifteen of these 21 patients had a diagnostic lumbar puncture and 3 neurosurgical patients had a continuous CSF drainage. Serum and urine concentrations of clavulanic acid were available from 22 patients. The mean peak serum concentration was 4'3 mg/1 and individual peak serum concentrations ranged from (M-9-5 mg/1 between 40 and 60 min after ingestion of clavulanic acid. Urinary recovery between 300 and 400 min ranged from 0"8-54'3% of the administered dose. The mean absorption half life was 0"26 h and the mean elimin-ation half life was 0'9 h. Considerable degradelimin-ation of clavulanic acid occurred in vitro at 37"C. In pooled human serum, phosphate buffer pH 7 and 5, an hourly loss of activity of about 10,7 and 10% respectively, was observed.
Introduction
Clavulanic acid, a product of Streptomyces clavuligerus, which structurally resembles the penicillin nucleus, is one of the first compounds with /Mactamase inhibiting properties (Brown et al., 1976; Reading & Cole, 1977). It has only weak broad spectrum antibacterial activity but it was shown that it acts as an irreversible inhibitor of many clinical important /Mactamases of Richmond types II-V (Neu & Fu, 1978) and protects /Mactamase susceptible broad spectrum penicillins from hydrolysis by /Mactamases (Paisley & Washington, 1978; Dumon et al., 1979; Wust &Wilkins, 1978; Reeves, Bywater& Holt, 1978).
Certain strains of the most common pathogens of bacterial meningitis in children, Haemophilus influenzae, are resistant to aminopenicillins due to the production of a ^-lactamase (Howard, 1977; Turk, 1978, Thomas et al., 1974). It could be demon-strated, that concentrations of 1-5 mg/1 of clavulanic acid regularly rendered such /?-lactamase producing ampicillin resistant strains sensitive to blood concentrations of broad spectrum penicillins attainable in vivo (Reeves, Bywater & Holt, 1978). This could be of potential importance in the future treatment of//, influenzae meningitis due to /Mactamase-producing organisms.
There are only few data available on human pharmacokinetics of clavulanic acid after oral administration and no data on penetration of clavulanic acid into human
29
cerebrospinal fluid (CSF)- Therefore, our study was designed (1) to report on pharmacokinetics of clavulanic acid after oral application of 250 mg, (2) to study the entry of clavulanic acid into CSF of human adults without meningeal inflammation and (3) to obtain some information on the in-vitro stability of clavulanic acid.
Material and methods Materials
Clavulanic acid capsules (BRL 14151, batch CT 9047) containing 125 mg of the sodium salt, clavulanic acid reference standard and benzylpenicillin laboratory standard were kindly supplied by Beecham Pharmaceuticals, England. The assay organism Klebsiella pneumoniae designated BRL 1003 was obtained from Beecham Pharmaceuticals.
Patients
Twenty-two patients (15 male and 7 female) of the Departments of Neurology, Neurosurgery and Medicine of the University Hospital of Zurich took part in our investigation. Informed consent according to institutional policies was obtained from each participant. Eighteen of these 22 patients were studied for CSF pene-tration of clavulanic acid. Of the 18 patients, 3 had a continuous CSF drainage (Cocchi drainage) after a neurosurgical procedure. In the remaining four patients only serum and urine concentrations of clavulanic acid were measured.
Dosage
After fasting for at least 4 h, 18 subjects received a single dose of 250 mg of clavulanic acid taken with 150 ml of water. In 3 subjects, who were unable to take capsules, the content of two capsules was dissolved in 150 ml water and immediately taken by mouth or gastric tube. An additional patient received the dissolved drug in a multiple dose schedule of 5 times 250 mg of clavulanic acid every 6 h. No food intake was allowed at least for 1 h after dosing.
Sampling
In the single dose studies, blood samples were drawn prior to, 0 3 , 0 7 , 1 and 15 h after administration and simultaneously to CSF specimen collection. Additional samples were drawn at 2, 3,4 and 6 h after ingestion of clavulanic acid. In the three patients with continuous CSF drainage CSF specimens were drawn simultaneously to the blood samples prior to, 0 3 , 0 7 , 1, 1 5 , 2 , 4 and 6 h after administration of the drug.
Sampling schedules of blood and CSF in the neurosurgical patient studied in the multiple dose regimen are indicated in Figure 8. Urine collection periods are shown in Figure 5(b).
Blood was allowed to clot at room temperature and then centrifuged at +4'C. Serum-, urine- and CSF-specimens were immediately frozen and stored in liquid nitrogen.
Routine CSF examination including cell counts and measurement of protein concentration showed elevated CSF protein concentrations with 40, 62 and > 100 mg/100 ml (upper l i m i t ^ 34 mg/100 ml) in 3 of 15 patients, who underwent
Clavulanlc acid in the CSF 31 a lumbar puncture. In all three cases CSF cell counts remained within normal range (<^5/mm3). In two of the three neurosurgical patients with continuous CSF
drainage routine CSF analysis was done. In both cases CSF protein concentrations were elevated (198 and 310 mg%, respectively), and in one of these two patients cell count was above the normal range (167/mm3).
Assay methods
Serum-, urine- and CSF-specimens were assayed within 1 week with a slightly modified large plate agar diffusion method (Bennett et al., 1966). The assay method for clavulanic acid was developed by Beecham Research Laboratories. Benzyl-penicillin was added to CLED agar (Oxoid, code CM 301) to achieve a final concen-tration of 5 mg/1. Due to the inactivation by clavulanic acid of the /Mactamase produced by the assay organism Klebsiella aerogenes A, the benzylpenicillin was protected from enzymatic degradation. Thus, the benzylpenicillin was then able to inhibit the growth of the assay organism producing zones dependent on the concentration of the inhibitor. Concentrations of clavulanic acid in serum could be measured within the range of 062-10 mg/1, in CSF and urine within the range of 0" 16-2-5 mg/1. Serum, CSF and urine standards were prepared on each study day from pooled, antibiotic free human serum, human CSF and 0 0 5 M phosphate buffer pH 7, respectively.
Stability studies
The time, medium and temperature dependent loss of activity was best described by an exponential decline. Hourly degradation rates were calculated by regression analysis.
Two series of three different concentrations of clavulanic acid were prepared by twofold dilution steps in pooled antibiotic free human serum, 0 0 5 M phosphate buffer pH 5 and pH 7, respectively. Each sample was kept at 37"C, serum samples additionally at room temperature. The degradation process was interrupted by freezing at — 196'C after 0, 1,2,4,6 and 8 h. The assay was performed within 1 week as described above. For each study condition mean values and standard deviations of the degradation rate were calculated from all six results.
Pharmacokinetic analysis
Serum concentration time courses of the 14 patients with at least five measurable serum levels were analysed using a one-compartment open model (Figure 1) incorporating the following four parameters: absorption lag time (rG|) total volume
of distribution (VD) and the first-order rate constants for absorption (/cj and
elimination (kj (Gibaldi & Perrier, 1975). Serum and CSF kinetics in the three patients with continuous CSF drainage were fitted using a linear multicompartment model (Figure 2) incorporating six variable parameters (TGI, k^, kt as defined above
and tcsp = CSF lag time (see below), Q = transfer constant (liters/h), VB = volume of
distribution minus ^CSF)- TWO additional parameters, the degradation constant of CSF A:D= 10% h and the volume of CSF FCSF = O-135 1 (Wissenschaftliche
Tabellen-Geigy, 1977) were kept constant.
The following differential equations define the model:
ion Figure 1. One compartment open model. Gl = gastrointestinal tract; TGI = gastrointestinal absorption lag time (min); k& = absorption rate constant (A"1); /ke = elimination rate constant (/r1); KD = volume of
distribution (I).
Figure 2. Linear multicompartment model. GI = gastrointestinal tract; XQ\ = gastrointestinal absorp-tion lag time (min); TCSF = C S F lag time (min); k^ = absorpabsorp-tion rate constant (/r1); ^ = eliminaabsorp-tion rate constant (/r1); kD = CSF degradation constant (10%/h); KB = volume of distribution minus volume of
CSF compartment (1); KCSF = volume of CSF (0135 1); (? = transfer constant (1/h).
^B
_ K
dt 'Gl _ Q (2) (3) 'CSFDue to the inhomogeneity of the CSF concentration and the capacity of the drainage tube, there is a delay (TCSF) between the CSF concentration in the CSF compartment and the value measured in the outflow of the drainage. This delay was taken into account by fitting the CSF data not to the time corresponding concentrations of the model, but to the calculated CSF values of the time (/ — rCSF). All pharmacokinetic
parameters were adapted to the experimental data with a non-linear fitting program (Metzler, Elfring & McEwen, 1974).
Results and discussion Stability studies
The time dependent loss of activity followed an exponential function which seems to be medium-, temperature- and pH-dependent. At room temperature a loss of 4 2 ± 10 %/h could be observed in serum while at 37"C the mean degradation was 1 1 2 ± 0 1 % / h . To simulate the physiological urine conditions, the in-vitro degradation was studied at two different pH values in phosphate buffer at 37"C. At pH 7 the degradation was 6-5 ± 0 8 %/h (Figure 3), at pH 5 109 ± 19 %/h. These degradation studies demonstrate, that the sodium salt of clavulanic acid appears to be relatively unstable, a fact that has to be taken into account in pharmacokinetic and microbiological evaluations.
Clavulanic acid in the CSF 33
Time (h )
Figure 3. Time dependent loss of activity of clavulanic acid in phosphate buffer pH 7 at 37'C. Two series (A and B) of three concentrations (2-5 mg/1, 1-25 mg/1, 0-30 mg/1) were analysed to estimate the hourly degradation rate. Series A, Series B.
Pharmacokinetic study
The mean serum concentration time course after oral administration of 250 mg of clavulanic acid is shown in Figure 4. At 60 min the serum level averaged 4 3 ± 22 mg/1. The individual peak serum concentrations were reached between 40 and 60 min after ingestion of clavulanic acid and ranged from 0 1 - 9 5 mg/1.
Ball et al. (1980) observed in a single dose pharmacokinetic study a mean peak serum concentration of 255 mg/1 of clavulanic acid 60 min after oral administration of 125 mg sodium clavulanate to four volunteers in combination with 250 mg amoxycillin. If a linear dose response is assumed, our measured serum concen-trations are comparable to these data. In two patients of the same study who received 250 mg potassium clavulanate, a peak serum concentration of 59 mg/1 could be detected. A mean peak serum concentration of approximately 6 mg/1 was
2 3 4 5 6 Time(h)
Figure 4. Senim concentrations (X ± S.D.) after oral administration of 250 mg of clavulanic acid.
determined in four fasting volunteers 60 min after oral administration of 250 mg of potassium clavulanate (Reeves et al., 1980). The published pharmacokinetic data on the potassium salt of clavulanic acid are insufficient to demonstrate a significantly improved gastrointestinal absorption.
The observed wide range in peak serum concentrations may be due to a between-subject variability in gastrointestinal absorption and/or in-vitro degradation. These striking variations are confirmed by the observation of Hoffler & Dalhoff (1980) who found peak serum concentrations ranging from 135-4-5 mg/1 after oral adminis-tration of 250 mg sodium clavulanate.
The terminal serum half life averaged 0 9 ± 0-5 h (range: 0-6-2-5 h), which is comparable to most penicillins (Barza & Weinstein, 1976). The terminal serum half-life of clavulanic acid determined in four volunteers in the above mentioned study by Ball et al. (1980) averaged 61 min. The absorption rate constant ka averaged
2-6 ± 1-1 h"1 (range: 1 -2-4-7). The lag time between ingestion and appearance of the
drug in the serum (TGI) averaged 0 3 ± 0 1 h (range: 0-1-0-6), indicating a relatively
fast absorption of the drug. No remarkable differences in the rate of drug absorption were observed regardless of the form of administration (intact capsules or dissolved drug).
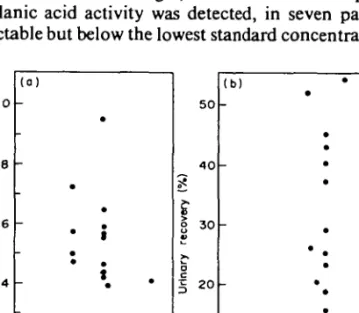
Urinary excretion after 5 to 6 7 h ranged from 0-8-54-3% of the administered dose. Figure 5(a) and (b) show a comparison of peak serum concentrations and the urinary recovery. In the three patients with peak serum concentrations below 2 mg/1 [A, O, D, Figure 5(a)], urinary recovery during the first 6 h was less than 5% of the adminis-tered dose [Figure 5(b)], indicating a very poor absorption in these three patients.
Figure 6 shows the results of the CSF concentrations of clavulanic acid in 15 patients with non-inflammed meninges, who underwent a spinal tap. In seven patients no clavulanic acid activity was detected, in seven patients CSF concen-trations were detectable but below the lowest standard concentration (0-16 mg/1) and
I
S O O 33 0-66 50 4 0 30 2 0 10 0 (b) -• i • • • * P . i 133 166 Time<h)Figure 5. Peak serum concentrations (a) and urinary recovery in % of the administered dose (b) after oral administration of 250 mg clavulanic acid. Corresponding peak serum concentrations and urinary recoveries are marked (D, A, O).
Clavulanic acid in the CSF 35
Figure 6. CSF concentrations after oral administration of 250 mg of clavulanic acid. Each symbol represents a CSF concentration of one patient Detectable amounts of clavulanic acid below the lowest standard concentration (0-16 mg/l) were extrapolated.
had to be extrapolated and only in one case the observed CSF concentration was with 0 2 mg/l within the range of the standards.
There seems to be a lag time between administration and appearance of clavulanic acid at the site of the lumbar puncture. In all patients except one, who had their spinal tap within the first 2 h, no clavulanic acid was detected in the CSF, whereas in all six patients who had CSF taps after 2 h of administration, clavulanic acid activity was 8% or less of the simultaneous serum concentration.
10-0 • A (CSF) ' " ° - A (Serum) B (CSF) B (Serum) Time(h)
Figure 7. Serum- and CSF concentration time curves in two patients (A) and (B) with a continuous CSF drainage after oral administration of 250 mg clavulanic acid. Data were analysed using a linear multi-compartment model (Figure 2).
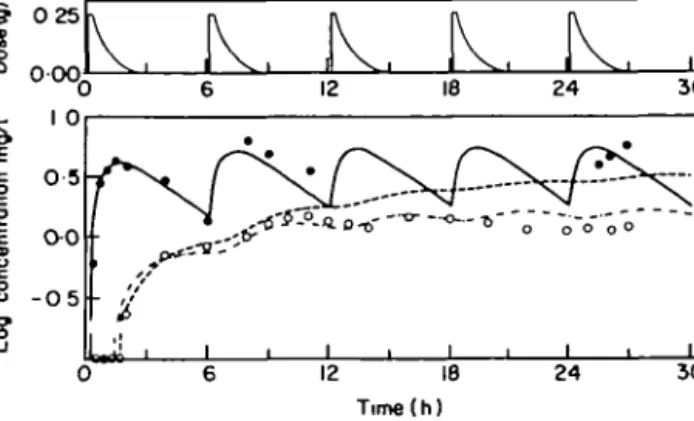
The serum and CSF concentration time courses of the two patients with continuous CSF drainage, who received a single dose are shown in Figure 7. In both patients equalization between serum and CSF time curves was attained after approximately 3 7 h. Peak CSF concentrations were measured 4 h after ingestion of clavulanic acid. At that time, CSF concentrations were 2 4 mg/l for patient A and 0 4 for patient B, while the corresponding serum levels were 2 3 mg/l and 0 3 mg/l, respectively. In contrast to these two patients, no such equalization was observed during the first 6 h in a patient with a multiple dose study (Figure 8). This could be attributed to a lower drug penetration into the CSF.
The discrepancy of these relatively high CSF concentrations in the three neuro-surgical patients with continuous CSF drainage compared to the findings of a very poor penetration of clavulanic acid into CSF in patients studied by lumbar puncture can be explained by differences in the permeability of the blood brain barrier. In the postsurgical period a derangement of this barrier is a common finding in most
3 0 25
000,
K. K . K.
IV.
.
12
Figure 8. Serum and CSF concentration time course in one patient with a continuous CSF drainage studied in a multiple dose scheme. Clavulanic acid concentrations of serum and CSF measured during the first 6 h were analysed with a linear multi-compartment model (Figure 2). Computer fitted serum concentration time course; -, computer fitted CSF concentration time course; , computer fitted CSF concentration time course incorporating an hourly degradation rate of 10%.
patients (Davson, 1967). The elevated protein levels in two of these patients support this observation. However a better permeability in patients with a disturbed blood brain barrier need to be confirmed by CSF measurements of clavulanic acid concen-trations in patients with meningeal inflammation.
Another result of the multiple dose trials is that although a steady state is reached, measured CSF concentrations are constantly below the corresponding serum values (Figure 8). A possible explanation for this observation would be a semi-permeable behaviour of the blood brain barrier. However, pharmacokinetic analysis with a multicompartment model (Figure 2) is capable of describing this phenomenon adequately without this hypothesis of a semipermeable behaviour.
Parameters of this model were fitted to the serum- and CSF concentrations of the first 6 h and subsequently used to simulate the time course of serum and CSF over the whole study period.
An hourly degradation rate of 10% as an additional route of elimination in CSF was incorporated into the model according to the loss of activity in pooled human serum observed in our in-vitro studies. With this procedure, the CSF concentration time course can be predicted over a longer time period (Figure 8).
The observed difference between measured and predicted serum concentrations could be due to various factors including an intraindividual variation in absorption and/or changes in the volume of distribution.
Acknowledgements
We appreciate the co-operation of the staff of the Departments of Neurology and Neurosurgery of the University Hospital of Zurich and are grateful to Mrs C. Sidler for the skilful technical assistance.
References
Ball, A. P., Geddes, A. M , Davey, P. G., Farrell, J. D. & Brookes, G. R. (1980). Clavulanic acid and amoxycillin: A clinical bacteriological and pharmacological study. Lancet r 620-3.
Clavulanic acid in the CSF 37
Barza, M. & Weinstein, L. (1976). Pharmacokinetics of penicillins in man. Clinical Pharmacokinetics 1,297-308.
Bennett, J. V., Brodie, J. L., Benner, E. J. & Kirby, W. M. M. (1966). A simplified, accurate method for antibiotic assay of clinical specimens. Applied Microbiology 14,170-7. Brown, A. G., Butterworth, D., Cole, M., Hauscomb, G., Hood, J. D. & Reading, C.
(1976). Naturally-occurring /?-lactamase inhibitors with antibacterial activity. Journal of Antibiotics 24, 668-9.
Davson, H. (1967). Physiology of the Cerebrospinal Fluid. J. & A. Churchill Ltd., London. Dumon, L., Adriens, P., Anne, J. & Eyssen, H. (1979). Effect of clavulanic acid on the
minimum inhibitory concentration of benzyl-penicillin, ampicillin, carbenicillin, or cephalothin against clinical isolates resistant to beta-lactam antibiotics. Antimicrobial Agents and Chemotherapy 15, 315-7.
Gibaldi, M. & Perrier, D. (1975). Multicompartment model. In Drugs and Pharmaceutical Sciences (Swarbrick, J. Ed.), vol. 1, pp. 45-96. Pharmacokinetics. Marcel Dekker, New York.
Howard, A. J. (1977). Ampicillin resistance in Haemophilus influenzae. Journal of Anti-microbial Chemotherapy's, 535-17.
Hoffler, D. & Dalhoff, A. (1980). Pharmacokinetics of clavulanic acid in patients with normal and impaired renal function. In Current Chemotherapy and Infectious Disease, Proc. 11th Int. Congress of Chemotherapy, Vol. 1, pp. 322-3. American Society for Micro-biology, Washington D.C.
Metzler, C. M., Elfring, G. L. & McEwen, A. J. (1974). A Users Manual for NONLIN and Associated Programs: Research Biostatistics. The Upjohn Co., Kalamazoo, Mich. Neu, H. C. & Fu, K. P. (1978). Clavulanic acid, a novel inhibitor of /Mactamases.
Antimicrobial Agents and Chemotherapy 14, 650-8.
Paisley, J. W. & Washington, II, J. A. (1978). Combined activity of clavulanic acid and ticarcillin against ticarcillin-resistant, Gram-negative bacilli. Antimicrobial Agents and Chemotherapy 14,224-7.
Reading, C. & Cole, M. (1977). Clavulanic acid: a beta-lactamase inhibiting beta-lactam from Streptomyces clavuligerus. Antimicrobial Agents and Chemotherapy 11, 852-7.
Reeves, D. S., Bywater, M. J. & Holt, H. A. (1978). Antibacterial synergism between beta-lactam antibiotic: Results using clavulanic acid (BRL 14151) with amoxycillin, carbeni-cillin or cephaloridin. Infection 6, Suppl. 1,9-15.
Reeves, D. S., Elliott, P., Holt, H. A., Mojaddedi, Z. & Chapman, S. (1980). Clinical trial of clavulanic acid/amoxycillin combination in urinary tract infections. Current Chemotherapy and Infectious Disease, Proc. 11 th Int. Congress of Chemotherapy, Vol. 1, pp. 347-349, American Society for Microbiology, Washington D.C.
Thomas, W. J., McReynolds, J. W., Mock, C. R. & Bailey, D. W. (1974). Ampicillin-resistant Haemophilus influenzae meningitis. Lancet i: 313.
Turk, D. L. (1978). Ampicillin resistance in Haemophilus influenzae. Journal of Anti-microbial Chemotherapy 4, 185.
Wissenschaftliche Tabellen Geigy. (1977). Teilband Korperfliissigkeiten. 8. Auflage, Basel, pp. 161-173.
Wiist, J. & Wilkins, T. D. (1978). Effect of clavulanic acid on anaerobic bacteria resistant to beta-lactam antibiotics. Antimicrobial Agents and Chemotherapy 13,130-3.