Abdominal aorta infection by Streptococcus pyogenes
Dominique Schaakxs
a, Alexander Fumeaux
b, Ludwig K. von Segesser
aand Denis A. Berdajs
a,*
a
Department of Cardiovascular Surgery, Centre Hospitalier Universitaire Vaudois (CHUV), Lausanne, Switzerland
b Department of Radiology, Centre Hospitalier Universitaire Vaudois (CHUV), Lausanne, Switzerland
* Corresponding author. Department of Cardiovascular Surgery, Centre Hospitalier Universitaire Vaudois (CHUV), Rue du Bugnon 46, Lausanne 1011, Switzerland. Tel: +41-21-3142695; e-mail: [email protected] (D.A. Berdajs).
Received 4 July 2012; received in revised form 10 September 2012; accepted 2 October 2012
Keywords:
Abdominal aorta infection
• Streptococcus aortitis
A 63-year old patient with acute abdominal pain, nausea and
temperature (38.8°C) was admitted to emergency; 4/4
haemo-cultures were positive for
Streptococcus pyogenes. Computed
tomography scan revealed a suspicion of an abdominal aorta
infection with in
filtration of surrounding tissue (Fig.
1
). Diagnosis
was con
firmed by fluorodeoxyglucose (FDG)-positron emission
tomography (PET)
–CT scan (Fig.
2
).
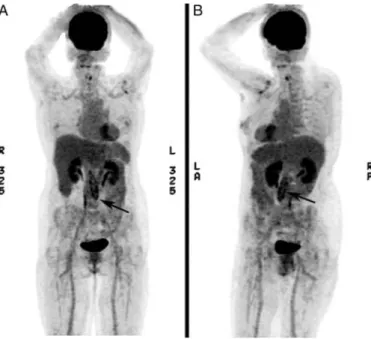
Figure 1:FDG-PET–CT scan, 3-dimensional (3-D) reconstruction, shows elevated tissue activity in terms of regional glucose at the abdominal aorta. (A) The PET–CT 3-D reconstruction shows an abdominal aorta from the posterior (B) and lateral views. Note that the arrow shows an area of augmented FDG uptake in the aortic wall.
Figure 2:Contrast CT scan (venous phase) shows a cross section of abdomen at the (A) level of the left kidney and (B) level of the right kidney. The white arrows indicate an envelope of infected tissue surrounding the aorta. Note the calcification sheets marking the real wall of the vessel. (C) A 3-D reconstruction of the ab-dominal aorta shows calcifications plaques in the wall (arrow). (1) Abab-dominal aorta, (2) liver, (3) left kidney and (4) right kidney.
© The Author 2013. Published by Oxford University Press on behalf of the European Association for Cardio-Thoracic Surgery. All rights reserved.
European Journal of Cardio-Thoracic Surgery 43 (2013) e48